

Green-Card Holders and Legal Immigration to the United States
There are four main pathways to gain LPR status in the United States: family sponsorship, a job offer from a U.S. employer, humanitarian reasons, and selection via a green-card lottery. The current immigrant admission system prioritizes family-based immigrants, followed by employer-sponsored immigrants and those who arrive as humanitarian migrants. A total of 55,000 green cards are reserved for the green-card lottery, known as the diversity visa program.
This Spotlight examines federal statistics on foreign nationals who gained LPR status during 2012. This article uses data from the Yearbook of Immigration Statistics, one of the most commonly used publications on U.S. immigration statistics, which is published by the Department of Homeland Security (DHS) Office of Immigration Statistics (OIS).
Note: All yearly data is for the government's fiscal year (October 1 through September 30). All data are from OIS unless otherwise noted.
Click on the bullet points below for more information:
- According to U.S. immigration law, immigrants are persons lawfully admitted for permanent residence in the United States.
- The law provides for four general immigrant categories: family reunification, employment sponsorship, humanitarian cases (refugee and asylum adjustments), and diversity immigrants.
- The total yearly inflow of immigrants in these categories is composed of both new arrivals to the United States and status adjusters.
- The number of new arrivals remained relatively stable at about 420,000 annually between 1986 and 2012.
- In 2012, more than 1 million people were granted lawful permanent resident status.
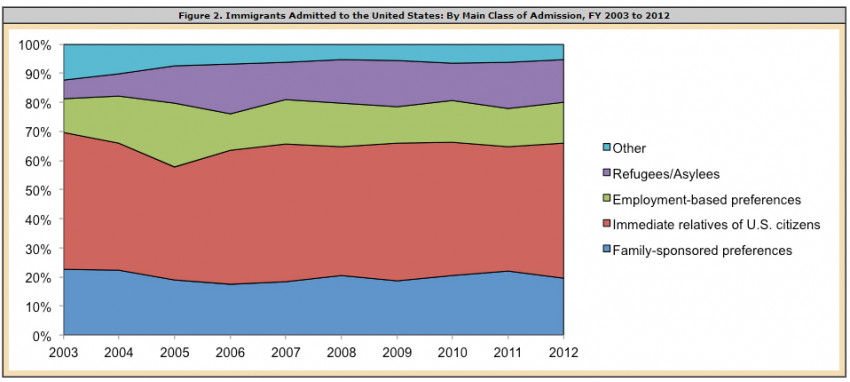
- Family reunification accounted for two-thirds of all lawful permanent immigration in 2012.
- Employment-preference immigrants made up 14 percent of all lawful permanent immigration in 2012.
- In 2012, about 15 percent of all lawful permanent residents were status adjusters who entered as refugees or asylees.
- On average, about 45,000 foreign-born residents received green cards as diversity immigrants in the last decade.
- The Department of State received more than 7.9 million qualified applications for the 2013 green-card lottery, down from around 14.8 million the year before.
- There were about 16,000 "other immigrants" in 2012.
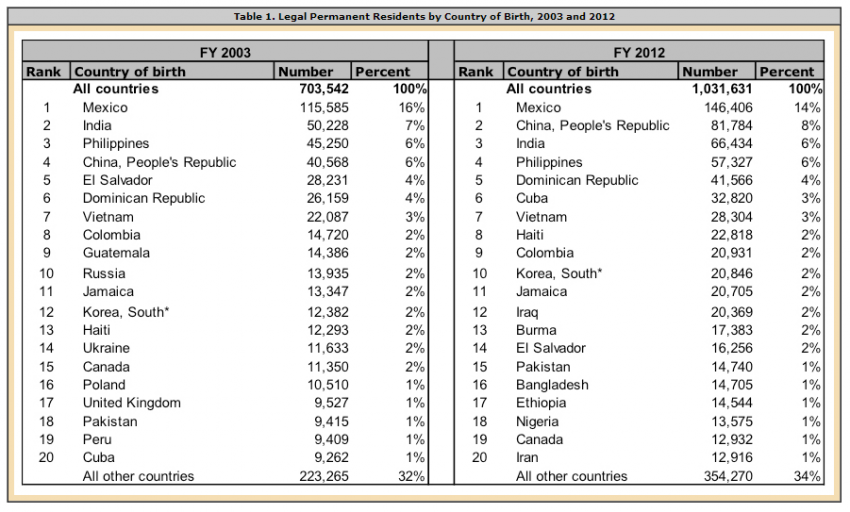
- Mexico, China, India, the Philippines, and the Dominican Republic were the top five countries of birth of new lawful permanent residents in 2012.
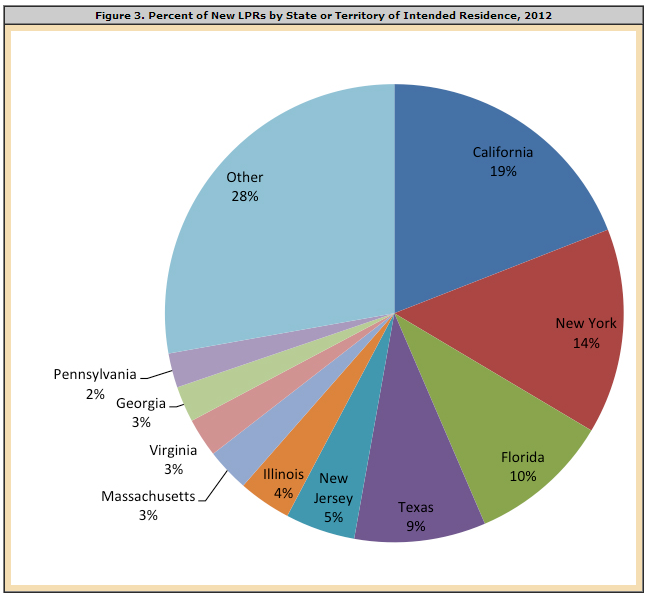
- California, New York, Florida, Texas, and New Jersey were home to 58 percent of new LPRs in 2012.
- In 2012, close to 8.8 million lawful permanent residents were eligible for naturalization, up from 8.1 million in 2010.
According to U.S. immigration law, immigrants are persons lawfully admitted for permanent residence in the United States.
Also known as green-card holders, immigrants are persons lawfully admitted for permanent residence in the United States who have the right to reside, work, study, and own property in the country. In contrast, foreign students, H-1B workers, and tourists are part of the large category of temporary nonimmigrant admissions.
The law provides for four general immigrant categories: family reunification, employment sponsorship, humanitarian cases (refugee and asylum adjustments), and diversity immigrants.
The majority of people who wish to obtain lawful permanent residence (LPR) or a green card in the United States qualify because they are family members of a U.S. citizen or lawful permanent resident, foreigners with needed job skills, refugees or asylum seekers who have been granted protection in the United States, or foreigners from countries with low rates of immigration to the United States (i.e., diversity immigrants or green-card lottery immigrants).
The total yearly inflow of immigrants in these categories is composed of both new arrivals to the United States and status adjusters.
The number of all immigrants admitted to the country shown in the immigration statistics tables below consists of two different flows. One is newly arrived LPRs — people who were issued immigrant visas overseas by the U.S. Department of State. The other is status adjusters — people who enter the United States with legal status and then adjust to permanent residence while in the country.
A person, for example, might arrive in the United States on an H-1B temporary worker visa. If her company chooses to sponsor her for permanent residence, the employer can petition U.S. Citizenship and Immigration Services (USCIS) for a green card on her behalf under an employment-preference visa. If she meets the criteria and if annual numerical ceilings for employment-preference visas and per-country limits have not been met, she would receive a card stating she is lawfully admitted for permanent residence. She would then be counted as a status adjuster for that year.
The number of new arrivals remained relatively stable at about 420,000 annually between 1986 and 2012.
Although the number of adjustments has greatly varied between 1986 and 2012, the number of new arrivals has remained relatively stable, with about 420,000 on average per year (see Figure 1). Changes in immigration legislation, application and visa processing times, and backlogs at the former Immigration and Naturalization Service (INS) and the current USCIS are primarily responsible for wide fluctuations in the total numbers.
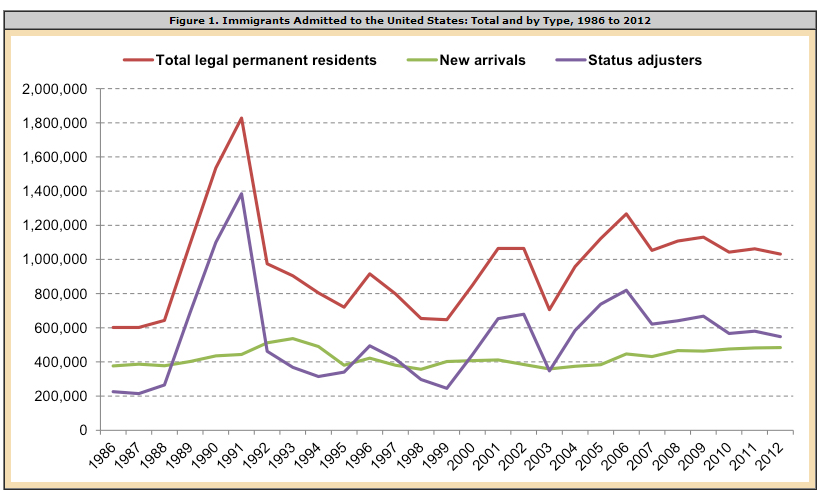
In 2012, more than 1 million people were granted lawful permanent resident status.
There were 1,031,631 immigrants granted LPR status in 2012. Of those, 484,072 (47 percent) were new arrivals who entered the country with LPR status in 2012. The other 547,559 (53 percent) were status adjusters, who had arrived earlier in the United States as nonimmigrants (e.g. students, temporary workers, and similar) and had their green-card applications approved during 2012.
Family reunification accounted for two-thirds of all lawful permanent immigration in 2012.
Immigrants who obtained green cards on the basis of a family relationship accounted for 66 percent of all LPRs in 2012, with spouses, children under the age of 21, or parents of U.S. citizens representing 478,780 of that total; and immediate family of LPRs and certain other family members of U.S. citizens accounting for an additional 202,019 (see Figure 2). During the last decade, family-based immigration has accounted for between 60 percent and 70 percent of total lawful permanent immigration.
Employment-preference immigrants made up 14 percent of all lawful permanent immigration in 2012.
The 143,998 immigrants who received green cards through sponsorship from their U.S. employers accounted for 14 percent of all LPRs.
The share of employment-preference immigrants has varied over the past decade between 12 percent (81,714) in 2003 and 22 percent (246,865) in 2005 (see Figure 2).
Similar to past trends, immediate family members of employment-based immigrants accounted for more than half of the employment-preference category in 2012: 54 percent (or 78,080) of employment-sponsored immigrants were spouses and children of principal applicants.
In 2012, about 15 percent of all lawful permanent residents were status adjusters who entered as refugees or asylees.
(Note: these figures refer to those refugees and asylees who adjusted their status to LPR in 2012. They do not refer to the numbers and percentages of refugee and asylum applicants granted refugee or asylum status in 2012. Read more on the latter here.).
The 105,528 refugees and 45,086 asylees who adjusted to LPR status in 2012 constituted 15 percent of all lawful permanent immigrants.
The number and percentage of refugees and asylees who adjusted to LPR status varied significantly between 2003 and 2013, from a low of 6 percent (44,764) in 2003 to a high of 17 percent (216,454) in 2006 (see Figure 2).
Refugees are required to adjust to LPR status after one year of residence in the United States. Asylees are eligible to apply for LPR status after one year in asylum status. Until 2005, there was a limit of 10,000 asylee adjustments per year. The REAL ID Act of 2005 (enacted in May 2005) eliminated this numerical limit. The number of asylee adjustments since 2005 has averaged around 63,000, almost six times higher than in 2004 (10,217).
On average, about 45,000 foreign-born residents received green cards as diversity immigrants in the last decade.
Each year the U.S. government grants lawful permanent residence to a select number of applicants around the world with its green-card lottery — officially known as the Diversity Visa Lottery, or DV Lottery — run by the Department of State. In 2012, 40,320 people received LPR status as diversity immigrants, representing 4 percent of the 1 million new LPRs.
The Immigration Act of 1990 established the Diversity Immigrant Visa Program (the green-card lottery) to allow entry to immigrants from countries with low rates of immigration to the United States. No more than 55,000 diversity visas are made available each fiscal year. Of the 55,000 visas, 5,000 must be used for applicants under the Nicaraguan and Central America Relief Act of 1997.
The visas are divided among six geographic regions — Africa, Asia, Europe, North America, Oceania, and South/Central America and the Caribbean — with no single country receiving more than 7 percent of the available diversity visas in any one year. Nationals of countries with high rates of immigration to the United States are not eligible to participate. For the purposes of the DV 2015 lottery (the registration for which began on October 1, 2013 and ended on November 2), excluded countries were Bangladesh, Brazil, Canada, China (mainland-born, excluding Hong Kong S.A.R., Macau S.A.R., and Taiwan), Colombia, Dominican Republic, Ecuador, El Salvador, Haiti, India, Jamaica, Mexico, Nigeria, Pakistan, Peru, the Philippines, South Korea, United Kingdom (except Northern Ireland) and its dependent territories, and Vietnam.
Before receiving permission to immigrate to the United States, lottery winners must provide proof of a high school education or its equivalent, or show two years of work experience within the past five years in an occupation that requires at least two years of training or experience. They must also pass a medical exam.
The Department of State received more than 7.9 million qualified applications for the 2013 green-card lottery, down from around 14.8 million the year before.
Overall interest in the DV lottery is significantly higher than the 50,000 available visas, but each year the application number varies depending on which countries are eligible. For instance, according to the most recent country-specific data available, more than 7.9 million qualified applications were registered between October 4, 2011 and November 5, 2011 for the DV-2013 program (or 12.6 million including spouses and minor children listed on the applications). While an impressive amount, that number is significantly lower than the 14.8 million entries registered a year earlier (or 19.7 million with dependents). The 46 percent drop in qualified applications between DV-2012 (14.8 million) and DV-2013 (7.9 million) was almost exclusively due to the exclusion of one country — Bangladesh — from the list of eligible countries (in 2012, Bangladeshis accounted for 7.7 million of the total 14.8 million applications).
There were about 16,000 "other immigrants" in 2012.
Less numerous groups of immigrants, including persons and their dependents legalized under the Immigration Reform and Control Act (IRCA) of 1986, parolees, and children born to LPRs abroad, are examples of "other immigrants" who are eligible for LPR status. In 2012, there were 15,900 "other immigrants" who accounted for 2 percent of all lawful permanent immigrants.
Mexico, China, India, the Philippines, and the Dominican Republic were the top five countries of birth of new lawful permanent residents in 2012.
The top five countries of birth — Mexico, China, India, the Philippines, and the Dominican Republic — accounted for 38 percent of all persons who received LPR status in 2012. Nationals of the next five countries — Cuba, Vietnam, Haiti, Colombia, and Korea — comprised another 12 percent. In all, the top 10 leading countries of birth made up 50 percent of the total (see Table 1).
As in 2003, the top 20 countries of birth in 2012 accounted for about two-thirds of all LPRs (see Table 1). Fourteen of the top 20 countries on the list in 2012 were also on the 2003 list. Guatemala, Russia, Ukraine, Poland, United Kingdom, and Peru dropped off the list, while Iraq, Burma, Bangladesh, Ethiopia, Nigeria, and Iran joined it.
California, New York, Florida, Texas, and New Jersey were home to 58 percent of new LPRs in 2012.
California was the intended state of residence for 19 percent of the 1 million new LPRs in 2012. Other leading states of intended residence included New York (14 percent), Florida (10 percent), Texas (9 percent), and New Jersey (5 percent). The top 10 states of destination — which also included Illinois, Massachusetts, Virginia, Georgia, and Pennsylvania — accounted for 72 percent of all LPR destinations (see Figure 3).
In 2012, close to 8.8 million lawful permanent residents were eligible for naturalization, up from 8.1 million in 2010.
According to the latest available OIS estimates, there were 13.3 million LPRs residing in the United States as of January 1, 2012. Of them, 8.77 million were eligible to naturalize.
Sources
Department of Homeland Security, Office of Immigration Statistics. Various years. Yearbook of Immigration Statistics and Annual Flow Report. Available online.
Department of State. 2013. Diversity Visa Lottery 2007-2013 Results. Available online.
U.S. Citizenship and Immigration Services (USCIS). 2013. Estimates of the Legal Permanent Resident Population in 2012. Available online.
Definitions of terms can be found at the Office of Immigration Statistics website. Available online.