

Immigrants in New-Destination States
As diverse as the United States is in terms of its geography, climate, and culture, there is a longstanding tradition of immigrants choosing to settle in the same places year after year. In fact, since the 1960s just seven states — California, New York, Florida, Texas, New Jersey, Illinois, and Massachusetts – have collectively attracted more than 60 percent, and in some years as much as three-quarters, of the entire foreign-born population in the country.
In the past 20 years, however, there has been an increasing trend of immigrants in the United States settling outside of what would generally be considered the traditional locales.
While the total U.S. foreign-born population grew by 57 percent from 19.8 million to 31.1 million between 1990 and 2000, this growth was considerably more pronounced in the southern and central regions of the country. The immigrant population more than doubled in 19 states, many of which had little prior experience with the foreign born.
This trend continued in the 2000s, despite the slowing of overall immigration that saw the foreign-born population grow at less than half the rate of the previous decade.
Between 2000 and 2009, the number of immigrants grew by 24 percent from 31.1 million to 38.5 million. And while most of the country was experiencing more or less stagnant growth and even decline, the population of the foreign born grew by 49 percent or more in 14 states: South Carolina, Alabama, Tennessee, Delaware, Arkansas, South Dakota, Nevada, Georgia, Kentucky, North Carolina, Wyoming, Idaho, Indiana, and Mississippi (listed in descending order of growth).
These 14 states primarily in the southern and central regions represent the "new destinations" of immigrants in the United States — states where the foreign-born population grew at or above twice the national rate between 2000 and 2009.
This Spotlight compares the size, origins, and demographic and socio-economic characteristics of the immigrant populations in the aforementioned new-destination states and the traditional-destination states of California, New York, Florida, Texas, New Jersey, Illinois, and Massachusetts. It relies on data from the U.S. Census Bureau's 2009 American Community Survey (ACS) as well as the 2000 and earlier Decennial Censuses.
Click on the bullet points below for more information:
Size and Origins
- There were 3.5 million immigrants in new-destination states in 2009.
- The annual inflow of immigrants to new-destination states continued during the 2000s at a similar rate as during the 1990s.
- South Carolina, Alabama, and Tennessee had the fastest growing foreign-born populations during the 2000s.
- Over one-third of immigrants in new-destination states are from Mexico.
|
Definition
|
||
|
Legal and Unauthorized Immigrants
- The foreign born in new-destination states are less likely to be naturalized U.S. citizens.
- Over 800,000 immigrants in new-destination states obtained lawful permanent residence between 2000 and 2009.
- New-destination states were home to about 1.6 million unauthorized immigrants in 2010.
Demographic and Socioeconomic Overview
- Nearly two of every five immigrants in new-destination states arrived in 2000 or later.
- Immigrants in new-destination states were more likely than immigrants elsewhere to be of working age.
- Foreign-born males outnumbered females in new-destination states; the opposite was true in traditional destinations.
- Immigrants in new-destination states are less likely to be limited English proficient than immigrants in traditional-destination states.
- The education profiles of immigrants in new- and traditional-destination states are remarkably similar.
- Foreign-born men residing in new-destination states were more likely to participate in the labor force than foreign-born men in traditional-destination states; the same was not true for foreign-born women.
- Employed immigrants in new-destination states were less likely than employed immigrants in traditional destinations to be employed in management, business, and finance occupations.
- Immigrant women in traditional-destination states were much more likely than their counterparts elsewhere to work in healthcare support.
- Over one-fifth of the foreign born in new-destination states lived in poverty.
- The foreign born in new-destination states were less likely than immigrants elsewhere to have health insurance.
Size and Origins
There were 3.5 million immigrants in new-destination states in 2009.
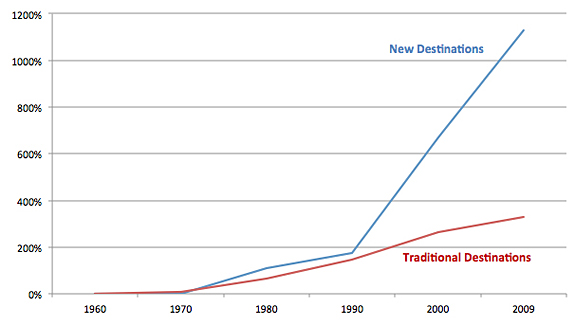
In 2009 there were 3.5 million immigrants in new-destination states — nearly four times the number in 1990 and more than 12 times the number in 1970 (see Figure 1). About one in every 11 immigrants in the United States resided in a new-destination state, compared to one in 25 in 1990.
By comparison, in 2009 there were 26 million immigrants — roughly two-thirds of the U.S. total — living in traditional-destination states. While the number of immigrants in these states grew from the 15 million reported in 1990, their share of the total foreign-born population declined from 75.8 percent to 67.6 percent.
|
|
||
|
|
|
||||||||||||||||||||||||||||||||||||||||||
|
||||||||||||||||||||||||||||||||||||||||||
The annual inflow of immigrants to new-destination states continued during the 2000s at a similar rate as during the 1990s.
The number of immigrants in new-destination states grew by about 142,000 (14.4 percent) per year between 1990 and 2000, and by 145,000 (6.3 percent) annually between 2000 and 2009.
In contrast, the number of immigrants in traditional-destination states grew by about 709,000 (5.4 percent) each year during the 1990s, but by only 440,000 (2.3 percent) per year during the first decade of the 2000s.
South Carolina, Alabama, and Tennessee had the fastest growing foreign-born populations during the 2000s.
Among new-destination states, South Carolina, Alabama, and Tennessee had the fastest growing immigrant populations during the first decade of the 21st Century. South Carolina experienced 77 percent growth, while both Alabama and Tennessee had 67 percent growth.
The rest of the new-destination states experienced the following rates of growth: Delaware, 65 percent; Arkansas, 63 percent; South Dakota, 61 percent; Nevada, 60 percent; Georgia, 59 percent; Kentucky, 59 percent; North Carolina, 55 percent; Wyoming, 53 percent; Idaho, 52 percent; Indiana, 51 percent; and Mississippi, 49 percent.
- For more information on immigrants by state, please see the ACS/Census Data tool on the MPI Data Hub.
Over one-third of immigrants in new-destination states are from Mexico.
The Mexican-born accounted for 35.5 percent of immigrants in new-destination states, but a smaller share (30.9 percent) of immigrants in traditional-destination states. The other top countries of origin of immigrants in new-destination states were India (4.7 percent), the Philippines (3.9 percent), China (3.1 percent), and Guatemala (2.8 percent) (see Table 1).
|
|
||||||||||||||||||||||||||||||||||||||||||||||||||||||||||||||
|
||||||||||||||||||||||||||||||||||||||||||||||||||||||||||||||
Legal and Unauthorized Immigrants
The foreign born in new-destination states are less likely to be naturalized U.S. citizens.
About one-third (34.3 percent) of immigrants in new-destination states were naturalized U.S. citizens, while 45.3 percent were naturalized in traditional-destination states.
Over 800,000 immigrants in new-destination states obtained lawful permanent residence between 2000 and 2009.
According to data published by the Department of Homeland Security's Office of Immigration statistics, 817,496 immigrants in new-destination states obtained lawful permanent resident (LPR) status between 2000 and 2009. They accounted for 7.9 percent of the 10.3 million immigrants who obtained LPR status nationwide. About 6.9 million immigrants in traditional destinations, or 66.7 percent of the total, obtained LPR status over the same period.
New-destination states were home to about 1.6 million unauthorized immigrants in 2010.
About 1.6 million unauthorized immigrants, or 14.5 percent of the 11.2 million unauthorized immigrants in the United States, resided in new-destination states in 2010. By comparison, 6.8 million unauthorized immigrants (61.5 percent of the total) resided in traditional-destination states.
The unauthorized immigrant population in new-destination states grew by 80 percent between 2000 and 2010 from 905,000. In traditional-destination states it grew more slowly over the same period, up 40 percent from 4.9 million in 2000.
- For complete estimates of the unauthorized immigrant population by state, see the Pew Hispanic Center's February 2011 estimates of the unauthorized immigrant population.
Demographic and socioeconomic characteristics
Nearly two of every five immigrants in new-destination states arrived in 2000 or later.
As of 2009, 42.0 percent of the 3.5 million foreign born residing in new-destination states entered the country since 2000, 29.4 percent entered between 1990 and 1999, 14.2 percent between 1980 and 1989, 7.1 percent between 1970 and 1979, and 7.3 percent prior to 1970.
In traditional-destination states, 28.8 percent of immigrants entered since 2000, 27.5 percent between 1990 and 1999, 21.5 percent between 1980 and 1989, 12.2 percent between 1970 and 1979, and 10.0 percent prior to 1970.
Immigrants in new-destination states were more likely than immigrants elsewhere to be of working age.
Among immigrants in new-destination states, 73.3 percent were of working age (between 18 and 54-years-old), compared with 68.1 percent in traditional-destination states. Foreign-born children were also a larger share of the immigrant population in new destinations (9.8 percent) than in traditional destinations (6.3 percent). On the other hand, nearly 16.9 percent of immigrants in new-destination states were elderly (age 55 and older), compared with over one-quarter (25.6 percent) in traditional-destination states.
Foreign-born males outnumbered females in new-destination states; the opposite was true in traditional destinations.
Over half of immigrants (52.7 percent) in new-destination states were men, compared with just under half (49.6 percent) in traditional-destination states.
Immigrants in new-destination states are less likely to be limited English proficient than immigrants in traditional-destination states.
Over half (54.5 percent) of immigrants age 5 and older in traditional-destination states reported speaking English less than "very well," thus classifying them as limited English proficient (LEP). The share of immigrants who were LEP in new-destination states was somewhat lower, with a reported 49.8 percent.
Note: The term "limited English proficient" refers to any person age 5 and older who reported speaking English "not at all," "not well," or "well" on their survey questionnaire. Individuals who reported speaking only English or speaking English "very well" are considered proficient in English.
The education profiles of immigrants in new- and traditional-destination states are remarkably similar.
Among foreign-born adults age 25 and older, the distribution across the education spectrum is nearly identical for new- and traditional-destination states. In both groups of states, about 31 percent of immigrants have less than a high school education, about 23 percent have a high school diploma or the equivalent general education diploma, about 19 percent have some college education or an Associate's degree, and about 27 percent have a Bachelor's degree or higher.
Foreign-born men residing in new-destination states were more likely to participate in the labor force than foreign-born men in traditional-destination states; the same was not true for foreign-born women.
Among the 1.7 million immigrant men of working age (age 16 and older) residing in new-destination states, 84.4 participated in the labor force in 2009, compared with 79.4 percent of their 12.2 million counterparts in traditional-destination states. Among foreign-born women, however, labor force participation rates were almost identical in new destinations (57.2 percent) and traditional destinations (57.4 percent).
For both genders in both groups of states, labor force participation rates were higher than those among the native born.
Employed immigrants in new-destination states were less likely than employed immigrants in traditional destinations to be employed in management, business, and finance occupations.
The construction, extraction, and transportation sectors employed the largest number of male immigrants age 16 and older in both new- and traditional-destination states. However, immigrant men in new destinations were more likely to work in these sectors than immigrant men elsewhere (see Table 2).
In contrast, immigrant men in traditional-destination states were more likely to be employed in management, business, and finance occupations than immigrant men residing in new destinations.
Immigrant women in traditional-destination states were much more likely than their counterparts elsewhere to work in healthcare support.
Among the 7 million immigrant women age 16 and older employed in traditional-destination states, 6.0 percent worked in healthcare support occupations, compared with just 2.9 percent of immigrant women employed in healthcare support in new-destination states.
|
|
|||||||||||||||||||||||||||||||||||||||||||||||||||||||||||||||||||||||||||||||||||||||||||||||||||||||||||
|
|||||||||||||||||||||||||||||||||||||||||||||||||||||||||||||||||||||||||||||||||||||||||||||||||||||||||||
Over one-fifth of the foreign born in new-destination states lived in poverty.
In 2009, immigrants in new-destination states were more likely than immigrants in traditional-destination states to reside in a household with an annual income below the federal poverty line. The share of immigrants living in poverty was 21.3 percent in new destinations and 16.8 percent in traditional-destinations.
Similarly, the native born living in states designated as new destinations for immigrants were also more likely to reside in a household with an annual income below the federal poverty line in 2009 (15.9 percent) than were their counterparts in traditional-destination states (13.2 percent). However, the poverty gap between immigrants and natives is larger in new-destination states than in traditional-destination states.
Note: Individuals residing in families with a total annual income of less than the federal poverty line are described as living in poverty. Whether an individual falls below the official poverty line depends not only on total family income, but also on the size of the family, the number of children, and the age of the head of household. The ACS reports total income over the 12 months preceding the interview date.
The foreign born in new-destination states were less likely than immigrants elsewhere to have health insurance.
Among the foreign born in new-destination states, 44.3 percent lacked health insurance coverage in 2009, compared with 33.5 percent of immigrants in traditional-destination states.
In contrast, the native born in new- and traditional- destination states had similar rates of noncoverage, with 14.8 percent and 13.2 percent not having health insurance, respectively. Both rates are much lower than the noncoverage rate among all foreign born, although the gap between immigrants and the native born is wider in new-destination states.
Note: Health insurance coverage includes: employer-provided insurance; privately purchased insurance; Medicare, Medicaid, or other governmental insurance; TRICARE or other military care; or Veterans Administration provided insurance.
Sources
Department of Homeland Security (DHS), Office of Immigration Statistics. 2010. Yearbook of Immigration Statistics 2009. Washington, DC: DHS. Available online.
Passel, Jeffrey S. and D'Vera Cohn. 2011. Unauthorized Immigrant Population: National and State Trends, 2010. Washington, DC: Pew Hispanic Center. Available online.
Ruggles, J., Steven, Trent Alexander, Katie Genadek, Ronald Goeken, Matthew B. Schroeder, and Matthew Sobek. 2010. Integrated Public Use Microdata Series: Version 5.0 [Machine-readable database]. Minneapolis: University of Minnesota. Available online.