

Immigration Enforcement in the United States

Border Patrol agents with a group of migrants caught illegally crossing the border in Southern California.
Immigration enforcement functions have traditionally been the responsibility of federal immigration authorities. In recent years, however, the enforcement landscape has broadened — not without controversy — to include state and local actors in the enforcement of federal immigration laws.
The Department of Homeland Security (DHS) houses the major federal immigration enforcement agencies — Customs and Border Protection (CBP) and Immigration and Customs Enforcement (ICE) — that enforce immigration laws both between and at official ports of entry to the United States, as well as in the country’s interior. Federal authorities have also authorized certain state and local actors to perform immigration enforcement functions under the 287(g) program, and DHS recently announced plans to move toward a nationwide data-sharing program with state and local jails through the Secure Communities program.
Although down slightly from 2009, the number of immigrants removed in 2010 (387,242) was still over 100 percent higher than the number in 2000 (188,476). Detailed statistics on immigration enforcement actions are not yet available for 2011, but top-line removal figures recently announced by DHS show that removals in 2011 increased by about 3 percent from the previous year and hit an all-time high of 396,906 persons removed.
The percent of criminal removals in 2010 (44 percent) and 2011 (55 percent) marks a continuing trend of increased shares of criminal removals that began in 2008, when only 29 percent of removals were criminal. The proportion of criminal removals had previously been on the decline each year from 2004 to 2008.
The total number of persons detained in 2010 was 363,064, down from 383,524 in 2009, which had also been a record high. The annual decline in the number of apprehensions that began in 2006 continued into 2010, with apprehensions in 2010 (516,992) hitting the lowest number since 1972.
This Spotlight describes and examines trends in immigration enforcement in the United States by defining key terms and procedures, describing the work of various federal agencies, and analyzing trends in annual immigration enforcement statistics. Drawing from the Yearbook of Immigration Statistics, published by the Office of Immigration Statistics (OIS) of DHS, this article provides data on apprehensions, detentions, removals, and returns of noncitizens in the United States in Fiscal Year (FY) 2010 and, in select cases where data are available, FY 2011. (Note: the FY covers the period from October 1 through September 30.)
Click on the bullet points below for more information:
Background
- Immigration enforcement includes locating, arresting, detaining, returning, and removing non-U.S. citizens (including lawful permanent residents) who violate U.S. immigration laws.
- At the federal level, immigration enforcement activities are chiefly carried out by Customs and Border Protection and Immigration and Customs Enforcement.
- Immigration and Customs Enforcement may train state and local law enforcement officers to perform immigration law enforcement functions.
- Some state and local jurisdictions share biometric data collected at jails with federal immigration authorities.
- The Border Patrol is responsible for enforcing border areas between legal ports of entry.
- Inspectors verify admissibility of entrants to the United States at official ports of entry.
- ICE investigators apprehend unauthorized immigrants in the interior of the United States.
- ICE enforcement and removal officers are responsible for the custody and tracking of individuals in removal proceedings.
Apprehensions
- Immigrants are apprehended (arrested) when found to be inadmissible or in violation of immigration laws.
- In 2010, DHS immigration officials made over 500,000 apprehensions.
- The Border Patrol accounted for about nine in ten of all apprehensions in 2010.
- Apprehensions along the Southwest border have decreased each year since 2005.
- The Tucson, Arizona sector accounted for more Border Patrol apprehensions in 2010 than any other sector.
- Mexican nationals accounted for more than eight in ten apprehensions in 2010.
Detentions
- ICE may detain individuals who are apprehended and awaiting removal proceedings.
- The United States currently holds detainees in service processing centers, contract detention centers, and other facilities such as state and local jails.
- In 2010, immigration officials detained 363,064 individuals.
- Sixty-one percent of detainees in 2010 were from Mexico.
Removals and Returns
- Foreign-born individuals who have to leave the United States are categorized as either "removals" or "returns."
- Formal removal proceedings are usually conducted during immigration hearings that involve judges from the Executive Office of Immigration Review (EOIR).
- Certain forms of removal may allow a person to be removed from the country without a hearing before an immigration judge.
- There were 387,242 removals in 2010, down 2.0 percent from 395,165 removals in 2009.
- The share of criminal removals has increased each year since 2008.
- Removals more than doubled between 2000 and 2010.
- Mexican nationals accounted for more than seven of every ten removals in 2010.
- Expedited removals accounted for more than a quarter of all removals in 2010.
- There were over 476,000 returns in 2010.
- The number of removals and returns combined stood at fewer than 1 million in 2010 and the lowest level since 1975.
- Returns outnumbered removals in 2010.
Background
Immigration enforcement includes locating, arresting, detaining, returning, and removing non-U.S. citizens (including lawful permanent residents) who violate U.S. immigration laws.
Immigration enforcement includes locating, apprehending, detaining, returning, and removing non-U.S. citizens (including lawful permanent residents) who are deportable or not admissible under the Immigration and Nationality Act (INA), as well identifying and preventing attempted illegal entries to the country.
The Illegal Immigration Reform and Immigrant Responsibility Act (IIRIRA) of 1996, which amended INA, significantly changed previous enforcement procedures, categories, and definitions, especially those pertaining to detention and removals. For example, IIRIRA increased border and interior enforcement, and the penalties for unlawful presence in the United States.
- For information on INA amendments, visit the U.S. Citizenship and Immigration Services (USCIS) website.
At the federal level, immigration enforcement activities are chiefly carried out by Customs and Border Protection and Immigration and Customs Enforcement.
Since the creation of the DHS in 2003, two bureaus within the department have primarily had responsibility for immigration enforcement: Customs and Border Protection (CBP) and Immigration and Customs Enforcement (ICE).
Most immigration enforcement activities fall under four main categories: border patrol, inspections, investigations, and detention and removal. CBP, which oversees enforcement at and between ports of entry, handles border patrol and inspections.
ICE is responsible for enforcing immigration laws within the interior of the United States. Investigations fall under Homeland Security Investigations (HSI), which was previously known as the Office of Investigations. The Office of Enforcement and Removal Operations (ERO), previously known as the Office of Detention and Removal, is responsible for identifying, apprehending, detaining, and removing unauthorized immigrants.
Immigration and Customs Enforcement may train state and local law enforcement officers to perform immigration law enforcement functions.
Section 287(g) of the INA, which was introduced by IIRIRA, authorizes DHS to enter into agreements with state and local law enforcement agencies, allowing officers to be trained to perform immigration law enforcement functions under the supervision of an ICE officer.
In order to deputize state and local law enforcement officers, ICE must sign a memorandum of agreement (MOA) with the head of the local agency, the governor of the state, or a “senior political entity.” Although agreements previously differed among participating law enforcement agencies, ICE attempted to standardize them and issued revised agreements to participating law enforcement agencies in 2009. Revised agreements were intended to strengthen federal oversight of the program and better align program priorities with federal enforcement objectives.
As of October 2011, DHS maintained 69 active MOAs across 24 states and had provided 287(g) training to more than 1,500 officers.
- For more information on 287(g) agreements, visit the Immigration and Customs Enforcement website.
Some state and local jurisdictions share biometric data collected at jails with federal immigration authorities.
To perform criminal background checks, fingerprint data collected from individuals booked into state and local jails is shared electronically with the Federal Bureau of Investigation (FBI). Under the Secure Communities program, the FBI also shares this data with DHS in order for the agency to perform immigration status checks. If DHS finds that an individual may be subject to removal, ICE may request that the state or local facility retain the person for up to 48 hours (not including weekends or holidays) in order to allow for an interview with ICE officials. Subsequently, ICE can choose whether or not to initiate removal proceedings.
Secure Communities began in 14 jurisdictions in 2008, but has since expanded to 1,595 jurisdictions —half of the 3,181 jurisdictions nationwide. ICE has expressed plans to launch Secure Communities nationwide by 2013.
- For more information on Secure Communities and the jurisdictions in which it is already active, see this recent report from ICE.
The Border Patrol is responsible for enforcing border areas between legal ports of entry.
CBP Border Patrol officers are responsible for enforcing roughly 9,000 miles of U.S. land and water boundaries between legal ports of entry (designated points where immigration officials can regulate entry). The goal of the Border Patrol is gain operational control of the border in order to prevent the entry of terrorists, unauthorized migrants, and illicit materials (such as drugs and weapons) into the United States.
Inspectors verify admissibility of entrants to the United States at official ports of entry.
CBP inspectors verify admissibility of entrants to the United States at official ports of entry, such as a land-border crossing or airport. If an individual is deemed inadmissible, the inspector has the authority to allow the person to withdraw his or her application for entry, refer the case to a formal removal hearing, or, in some instances, order removal themselves under a process called "expedited removal."
ICE investigators apprehend unauthorized immigrants in the interior of the United States.
Working as part of HSI, ICE investigators engage in formal investigations of individuals and organizations that may be in violation of the INA and other immigration-related laws. Investigators may work in task force teams that involve officials from multiple agencies.
Major issue areas for ICE investigations include: worksite enforcement, terrorism, violent and organized crime, human smuggling and trafficking, and the movement of illicit materials (such as drugs and weapons) into the United States.
ICE enforcement and removal officers are responsible for the custody and tracking of individuals in removal proceedings.
ICE detention and removal officers transport individuals in removal proceedings, manage their detention or alternative-to-detention arrangements, and, if applicable, remove individuals from the United States.
- For more information on ICE's Office of Enforcement and Removal Operations, read this fact sheet.
Apprehensions
Immigrants are apprehended (arrested) when found to be inadmissible or in violation of immigration laws.
Immigrants are apprehended (arrested) when found to be inadmissible or in violation of immigration laws. The Border Patrol apprehends individuals attempting to enter the country illegally between ports of entry, CBP apprehends inadmissible persons at official ports of entry, and ICE apprehends noncitizen violators within the country’s interior. Individuals can also be apprehended by certain state and local law enforcement officials as part of the 287(g) program.
In 2010, DHS immigration officials made over 500,000 apprehensions.
According to DHS, immigration officials made 516,992 apprehensions in 2010 — the lowest number of apprehensions since 1972 when there were 505,949 apprehensions. The number of apprehensions in 2010 was 15.7 percent lower than in 2009 (613,003 apprehensions) and less than one-third the number in 2000 (1,814,729) when apprehensions reached the decade's highest.
Note: Apprehensions are events, not individuals. In other words, the same individual can be apprehended more than once.
The Border Patrol accounted for about nine in ten of all apprehensions in 2010.
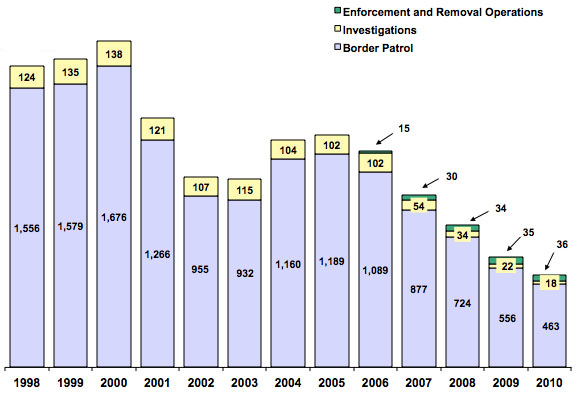
The Border Patrol made 89.6 percent (463,382) of all apprehensions (516,992) in 2010, while administrative arrests of individuals in violation of immigration laws by ICE Homeland Security Investigations were 3.4 percent (17,836) of apprehensions. The arrest of individuals by ERO accounted for 6.9 percent (35,774) of apprehensions (see Figure 1).
Additionally, 223,217 charging documents, which initiate the removal process, were issued through the Criminal Alien Program (CAP) in 2010. The CAP program is designed to locate, process, and initiate removal proceedings against noncitizens incarcerated in federal, state, and local prisons and jails.
|
Figure 1. Number of Apprehensions by Program (thousands) and Percentage Attributed to Investigations, 1998 to 2010
|
||
|
Apprehensions along the Southwest border have decreased each year since 2005.
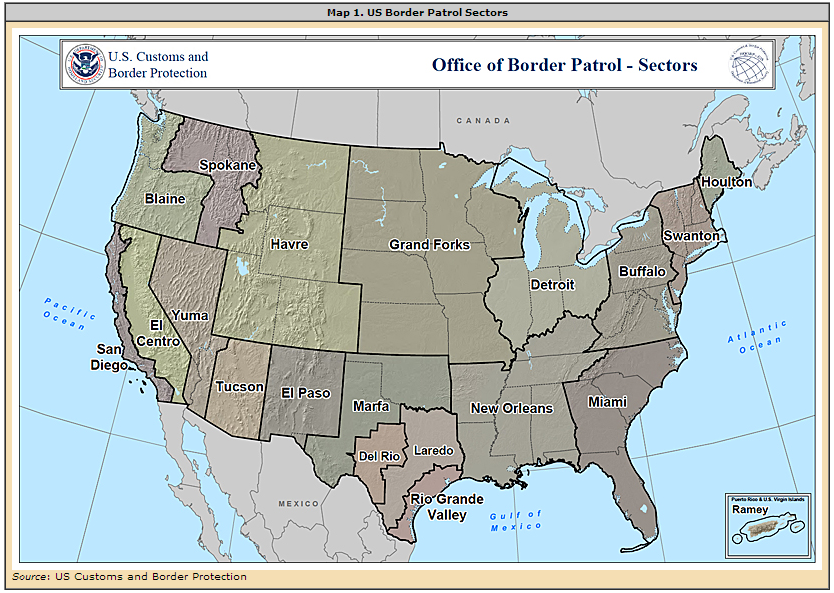
There are a total of 21 Border Patrol sectors, nine of which are along the Southwest border: five in Texas, two in California, and two in Arizona (see Map 1).
Among Border Patrol apprehensions, 96.6 percent (447,731) occurred along the Southwest border. Apprehensions in this area decreased by 61.8 percent between 2005 (1,171,428) and 2010 (447,731). During the last decade, apprehensions in Southwest sectors peaked in 2000 (1,643,679) and hit their lowest point in 2010 (447,731).
The Tucson, Arizona sector accounted for more Border Patrol apprehensions in 2010 than any other sector.
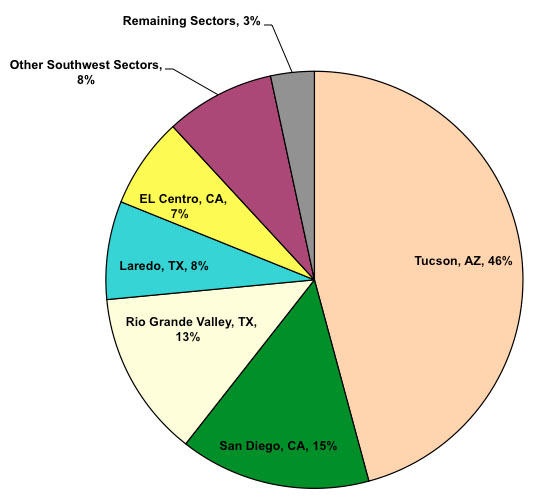
Five of the nine Southwest sectors accounted for 88.1 percent (408,382) of all apprehensions made by the Border Patrol. These five sectors were Tucson, Arizona (212,202 or 45.8 percent of BP total); San Diego, California (68,565 or 14.8 percent); Rio Grande Valley, Texas (59,766 or 12.9 percent); Laredo, Texas (35,287 or 7.6 percent); and El Centro, California (32,562 or 7.0 percent) (see Figure 2).
Apprehensions in the Tucson sector also outnumbered those in any other sector in 2000, accounting for 616,346 (36.5 percent) of the 1,689,638 total apprehensions. During the same year, apprehensions in the following five sectors accounted for 76.7 percent of all apprehensions: Tucson, Arizona; El Centro, California (238,126 or 14.1 percent); Del Rio, Texas (157,178 or 9.3 percent); San Diego, California (151,681 or 9.0 percent); and Rio Grande Valley, Texas (133,243 or 7.9 percent).
|
Figure 2. Border Patrol Apprehensions by Sectors, 2010
|
||
|
Mexican nationals accounted for more than eight in ten apprehensions in 2010.
Mexican nationals accounted for the majority of apprehensions in 2010, representing 82.8 percent (427,940) of the 516,992 total apprehensions. Nationals from Guatemala, El Salvador, and Honduras were the next leading countries of origin and accounted for 23,068 (4.5 percent), 18,520 (3.6 percent), and 17,899 (3.5 percent) of apprehensions, respectively.
Detentions
ICE may detain individuals who are apprehended and awaiting removal proceedings.
Individuals in ICE custody may be detained, given temporary legal permission to remain in the United States, released from detention on bond, or placed in alternative-to-detention programs. Since the implementation of the Illegal Immigration Reform and Immigrant Responsibility Act (IIRIRA) in 1997, detention has become mandatory for certain criminal and terrorist cases. However, detention is not mandatory for all those detained.
In some instances, individuals may be detained indefinitely because they are considered a threat to national security or because their country of origin will not accept responsibility for them.
The United States currently holds detainees in service processing centers, contract detention centers, and other facilities such as state and local jails.
As of 2011, ICE reported holding an average of 33,400 detainees per day across as many as 253 facilities. These facilities include: six service processing centers, seven contract detention centers, and 240 facilities — such as state and local jails — operated under intergovernmental service agreements. Reporting has shown that many of these facilities are largely designed for penal, not civil detention (noncitizens in ICE custody are civil detainees).
In August 2009, the Obama administration created the Office of Detention Policy and Planning to make the system more closely resemble a civil detention system. The Office of Detention Oversight was created to improve federal monitoring of ICE's detention facilities.
- See the steps ICE has taken so far to change the detention system.
- See the MPI report Immigrant Detention: Can ICE Meet Its Legal Imperatives and Case Management Responsibilities?
In 2010, immigration officials detained 363,064 individuals.
ICE officials detained 363,064 individuals in 2010. The number of individuals detained in 2010 was slightly lower than the 2009 high of 383,064, but 52.8 percent higher than in 2005 (237,667).
Sixty-one percent of detainees in 2010 were from Mexico.
About 221,500 detainees were from Mexico (61.0 percent), up from 49 percent in 2007. Yet due to their relatively brief stays in detention, in 2010 Mexican detainees accounted for only 36 percent of "detention bed days," or the number of days a detainee is housed in a detention facility.
After Mexico, the leading countries of nationality for those detained were El Salvador (11 percent of bed days), Guatemala (10 percent), and Honduras (8 percent).
|
The End of "Catch and Release"
|
||
|
Removals and Returns
Foreign-born individuals who have to leave the United States are categorized as either "removals" or "returns." Both removals and returns result in the departure of a foreign-born individual from the United States.
Enforcement actions categorized as removals are generally ordered by an immigration judge and often place weightier criminal and/or administrative consequences on reentry. In addition to the removal itself, individuals can be subject to fines, as well as temporary or permanent bars on reentry to the United States.
Returns require apprehended individuals to waive their right to a hearing before an immigration judge and subsequently depart from the country under supervision. Returns are often deemed appropriate in instances when the Border Patrol has apprehended a noncriminal alien, although they can also be extended at ports of entry to inadmissible noncriminals or to individuals apprehended in the country’s interior. Those individuals who agree to a return may sometimes seek legal readmission to country without consequence.
Formal removal proceedings are usually conducted during immigration hearings that involve judges from the Executive Office of Immigration Review (EOIR).
Formal removal proceedings are usually conducted during immigration hearings that involve judges from the Department of Justice’s Executive Office of Immigration Review (EOIR), as well as prosecutors from DHS. Individuals in proceedings may be represented by attorneys at their own expense and may also appeal the court's decision through DOJ's Board of Immigration Appeals. Individuals seeking asylum in the United States may make an asylum claim during formal removal proceedings.
Aside from removal, penalties for those ordered removed can include fines as well as temporary or permanent bars on readmission to the country.
Certain forms of removal may allow a person to be removed from the country without a hearing before an immigration judge.
Expedited removal, administrative removal, and reinstatement of removal are forms of removal that may allow a person to be removed without a hearing before an immigration judge.
An expedited removal can be used for certain persons who attempt to enter without entry documents or with fraudulent documents. An inspector at the time of attempted entry usually orders this type of removal; the individual is not allowed to consult legal counsel or present his or her claim before an immigration judge.
Any person subject to expedited removal who raises a claim for asylum — or expresses fear of returning to his or her home country — is given the opportunity to explain his or her fears to an asylum officer in a credible fear interview. Persons subject to expedited removal can also voice claims for legal status in the United States.
Administrative removal and reinstatement of removal may also allow persons to be removed without a hearing before an immigration judge. Individuals convicted of an aggravated felony or certain other criminal offenses may be subject to administrative removal. Persons previously ordered removed who departed the country and then reentered illegally may be subject to reinstatement of removal.
Reinstatements of final removal orders accounted for 33.8 percent (130,840) of removals in 2010, an increase from the previous year when this type of removal accounted for 29.6 percent of total removals (116,903). Reinstatements have increased every year over the past ten years, rising 236.0 percent since 2001 when there were 38,943 reinstatements. The DHS Office of Immigration Statistics does not publish data on administrative removals.
There were 387,242 removals in 2010, down 2.0 percent from 395,165 removals in 2009.
The number of removals decreased 2.0 percent from 2009 (395,165) to 2010 (387,242). Detailed statistics on immigration enforcement actions are not yet available for 2011, but top-line removal figures announced by DHS show that removals in 2011 increased by 2.5 percent from the previous year and hit an all-time high of 396,906 persons removed.
Note: Removals are events, not individuals. In other words, the same individual can be removed more than once in the same year.
The share of criminal removals has increased each year since 2008.
Of the 387,242 removals in 2010, 43.5 percent (or 168,532) were convicted as criminals, a higher share than in 2009 (33.4 percent of 131,840). Statistics released for 2011 show a continued increase in the share of criminal removals, with convicted criminals accounting for 54.6 percent (216,698) of removals that year.
The share of criminal removals has increased each year since 2008, when only 29.3 percent (105,266) of removals were criminal. Previously, from 2004 to 2008, the share of criminal removals had been declining each year. (The share of criminal removals in 2004 was 38.4 percent.)
Removals more than doubled between 2000 and 2010.
Removals increased by 105.5 percent, from 188,476 in 2000 to 387,242 in 2010.
Mexican nationals accounted for more than seven of every ten removals in 2010.
Mexican nationals made up 282,003 of 387,242 removals, or 72.8 percent. The next-largest source countries were Guatemala (7.6 percent or 29,378) and Honduras (6.4 percent or 24,611).
Expedited removals accounted for more than a quarter of all removals in 2010.
Expedited removals accounted for 28.7 percent (111,116) of total removals in 2010, up from 26.8 percent in 2009 (106,025 out of 395,165).
The share of expedited removals as a percentage of all removals fluctuated between 2001 and 2010, peaking in 2006 at 39.4 percent of the 280,974 total removals that year, and bottoming out in 2003 at 20.8 percent of the 211,098 total removals recorded that year.
There were over 476,000 returns in 2010.
There were 476,405 returns in 2010, which marked an 18.7 percent decrease compared to the 586,164 returns in 2009. In 2010, Mexican nationals accounted for 74.5 percent of returns, Canadians 6.1 percent, Filipinos 4.5 percent, and Chinese 3.5 percent. In 2009, those particular groups of individuals accounted for 80.2, 4.4 percent, 3.2 percent, and 2.6 percent of returns, respectively.
Note: Returns are events, not individuals. In other words, the same individual can be apprehended and counted as "returned" to his or her home country more than once in the same year.
The number of removals and returns combined stood at fewer than 1 million in 2010 and the lowest level since 1975.
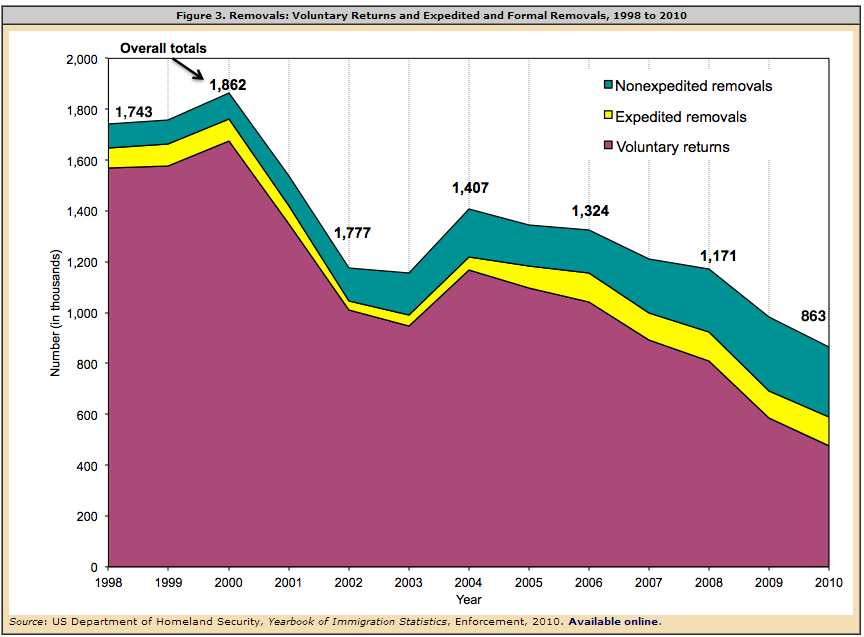
Combined removals and returns in 2010 totaled 863,647, the lowest number since 1990 when removals and returns totaled 1,052,572. Combined removals and returns in 2010 were 12.0 percent lower than in 2009 (981,329) and 53.7 percent lower than the decade's highest number of 1,864,343 in 2000 (see Figure 3).
Returns outnumbered removals in 2010.
In 2010, returns accounted for 55.2 percent of the 863,647 total removals and returns, while removals were 44.8 percent. Returns in 2010 made up a smaller share of the combined removals and returns than they have since 1941, when returns accounted for 47.1 percent (6,531) of total removals and returns (see Figure 3).
Sources
Meissner, Doris and Donald Kerwin. 2009. DHS and Immigration: Taking Stock and Correcting Course. Washington, DC: Migration Policy Institute. Available online.
Siskin, Alison. 2004. Immigration-Related Detention: Current Legislative Issues. Washington, DC: Congressional Research Service. Available online.
U.S. Customs and Border Protection, Office of Border Patrol. 2009. Secure Borders, Safe Travel, Legal Trade: U.S. Customs and Border Protection Fiscal Year 2009-2014 Strategic Plan. Available online.
U.S. Department of Homeland Security, Office of Immigration Statistics. 2011. 2010 Yearbook of Immigration Statistics, various tables. Available online.
_____. 2011. Immigration Enforcement Actions: 2010. Available online.
U.S. Immigration and Customs Enforcement. 2011. A day in the life of ICE enforcement and removal operations. Available online.
_____. 2011. Fact Sheet: Delegation of Immigration Authority Section 287(g) Immigration and Nationality Act. Available online.
_____. 2011. FY 2011: ICE Announces year-end removal numbers, highlights focus on key priorities including threats to public safety and national security. News release, October 28, 2011. Available online.
_____. 2011. Secure Communities. Available online.