

Language Diversity and English Proficiency in the United States

Approximately 2.2 million children ages 5 to 17 were Limited English Proficient (LEP) in 2015, making up about 9 percent of the total LEP population. (Photo: U.S. Department of Education)
While a record 64.7 million people ages 5 and older in the United States spoke a language other than English at home in 2015, a growing share of them are also fully proficient in English. Sixty percent of those speaking a foreign language at home were fully proficient in English in 2015, up from 56 percent in 1980—even as immigration levels rose significantly.
The population of immigrants and U.S. natives speaking a language other than English at home—which represents about one in five U.S. residents—has nearly tripled since 1980 when it stood at 23.1 million. This growth is not surprising: The immigrant population in the United States increased by 29.2 million people between 1980 and 2015, the lion’s share coming from countries where English is not an official language. While immigrants learn English in school and in the workplace, their U.S.-born children grow up learning English while also hearing and speaking Spanish, Chinese, Vietnamese, Russian, and a host of other languages. Indeed, the U.S. Census Bureau records the use of more than 350 languages.
Just a few languages, however, account for the largest share of those spoken at home, with speakers of Spanish, Chinese, and Tagalog representing 70 percent of the overall population of immigrants and U.S. natives using a language other than English in the household. Most of these people are also fluent in English: The share of people who are bilingual (i.e., those who speak another language at home and reported that they speak English “very well”) is more than half for the speakers of German, French, Tagalog, Arabic, Spanish, French Creole, and Russian (see Table 1).
Table 1. Top Ten Languages Other Than English Spoken in U.S. Homes, 2015
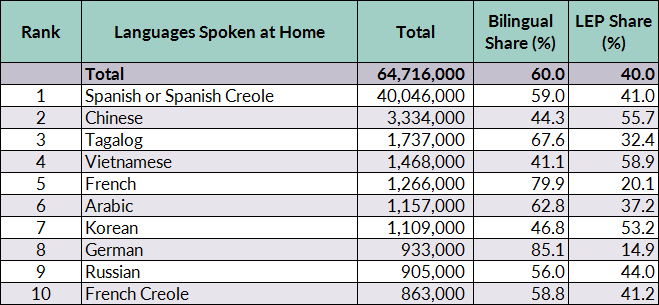
Notes: Chinese includes Chinese, Mandarin, and Cantonese; French includes Patois and Cajun; German includes Pennsylvania Dutch.
Source: Migration Policy Institute (MPI) tabulation of data from the U.S. Census Bureau 2015 American Community Survey (ACS).
The subset of this population that is Limited English Proficient (LEP) has fallen: 40 percent in 2015, compared to 44 percent in 1980. Limited English proficiency refers to anyone age 5 or older who reported speaking English less than “very well,” as classified by the U.S. Census Bureau.
In 2015, more than 25.9 million people were LEP, accounting for 9 percent of the overall U.S. population ages 5 and older. While this number is high compared to earlier decades, the LEP population has been largely stable for the past five years (see Figure 1). In contrast, the overall number of foreign-language speakers has continued to rise since 2010, increasing linguistic diversity in the United States, albeit with the numbers not rising as fast as before. Although most of the LEP population in 2015 was foreign born, 18 percent of those speaking English less than “very well” were born in the United States.
Figure 1. Speakers of Foreign Languages and LEP Population, 1980-2015
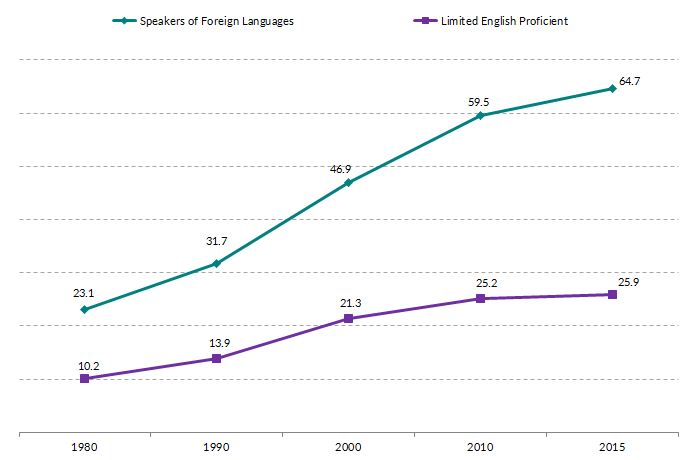
Note: The 1980 decennial Census was the first to ask respondents about their level of English proficiency.
Source: MPI tabulations from the U.S. Census Bureau’s 1980, 1990, and 2000 Decennial Censuses and 2010 and 2015 ACS.
Immigrants to the United States come from many language backgrounds and while some speak English very well, roughly half of the total immigrant population of 43.3 million in 2015 was LEP.
The Limited English Proficient Population
Compared to the English-proficient population, the overall LEP population (immigrant and U.S. born) was less educated and more likely to live in poverty in 2015. Employed LEP men were much more likely to work in construction, natural resources, and maintenance occupations than English-proficient men, while LEP women were more than twice as likely to be employed in service and personal-care occupations than English-proficient women.
Using data from the U.S. Census Bureau (the most recent 2015 American Community Survey [ACS], 2010 ACS, and the 1980, 1990, and 2000 Decennial Census), this section of the Spotlight provides a demographic and socioeconomic profile of LEP individuals (ages 5 and older) residing in the United States, focusing on its size, geographic distribution, and socioeconomic characteristics.
- Distribution by State and Key Cities
- Nativity
- Language Diversity
- Age, Race, and Ethnicity
- Education and Employment
- Poverty
Distribution by State and Key Cities
As of 2015, the highest concentrations of LEP individuals were found in the six traditional immigrant-destination states—California (6.8 million, or 26 percent of the total LEP population), Texas (3.6 million, 14 percent), New York (2.5 million, 10 percent), Florida (2.3 million, 9 percent), Illinois (1.1 million, 4 percent), and New Jersey (1 million, 4 percent). Together, the top six states accounted for approximately two-thirds of the 25.9 million LEP individuals.
Seven states had a higher share of LEP residents than the nationwide proportion of 9 percent. California had the highest share, with individuals reporting limited English proficiency accounting for 19 percent of the state population, followed by Texas and New York (14 percent each) (see Figure 2).
Figure 2. States with Highest Share of LEP Residents, (%), 2015
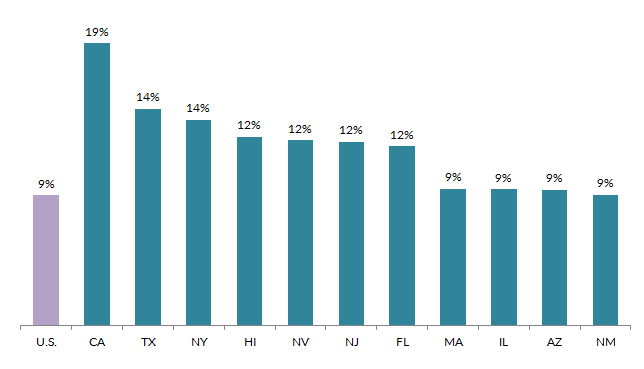
Source: MPI tabulation of data from the U.S. Census Bureau 2015 ACS.
Click here for data on the LEP population by state from 1990-2015.
In the 2010-14 period, the top five counties with the largest LEP populations were Los Angeles County in California (9 percent of the U.S. LEP population), Miami-Dade County in Florida (3 percent), Harris County in Texas (3 percent), Cook County in Illinois (3 percent), and Queens County in New York (2 percent). Together, these five counties represented 21 percent of the total LEP population in the United States.
LEP residents accounted for more than one-third of the total population ages 5 and older in nine counties. Of these counties, seven were located in Texas, one in Alaska, and one in Florida. The counties with the highest share of LEP residents included Starr County, Texas (51 percent of the total county population, or 28,000 LEP residents); Maverick County, Texas (46 percent, 23,000); Webb County, Texas (44 percent, 103,000); Zapata County, Texas (42 percent, 5,000); and Aleutians East Borough, Alaska (42 percent, 1,000). While most of these areas did not have large populations of LEP individuals in absolute terms relative to other counties, the share with limited English proficiency was significantly higher.
As of 2010-14, two metropolitan areas were home to 3 million or more LEP individuals: the greater New York (12 percent of the total U.S. LEP population) and Los Angeles (11 percent) metropolitan areas. The next three cities, with about 1 million LEP residents each, were the greater Miami (5 percent), Chicago (4 percent), and Houston (4 percent) metropolitan areas. Together, these five cities represented 37 percent of the U.S. LEP population.
LEP residents represented more than one-quarter of the total population ages 5 and older in six metropolitan areas, including four in Texas and two in California. The metropolitan areas with the highest share of LEP residents included Laredo, Texas (44 percent of total population, or 103,000 individuals); El Centro, California (33 percent, 53,000); McAllen, Texas (32 percent, 232,000); and El Paso, Texas (31 percent, 236,000).
Whereas a majority of LEP individuals were foreign born in 2015, about 18 percent (4.7 million) were native born (see Figure 3).
Figure 3. LEP Population by Nativity, 1990-2015
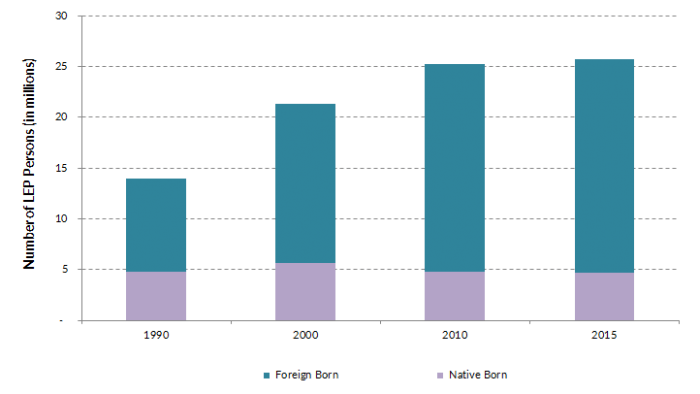
Source: MPI tabulations from the U.S. Census Bureau’s 1990 and 2000 Decennial Censuses and 2010 and 2015 ACS.
The foreign-born population was much more likely to have limited English proficiency than the U.S.-born population (see Table 2). In 2015, approximately 49 percent of immigrants (21 million) were LEP, compared to 2 percent of the U.S.-born population.
Table 2. LEP Individuals (ages 5 and Older) in the United States by Nativity, 2015
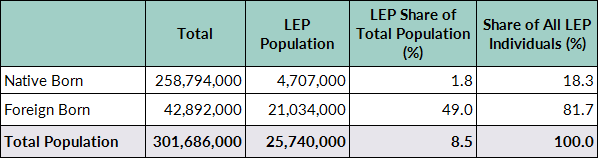
Source: MPI tabulation of data from the U.S. Census Bureau 2015 ACS.
Of the total foreign-born LEP population of 21 million, 38 percent were born in Mexico, followed by China/Hong Kong (7 percent), El Salvador (5 percent), and Vietnam and Cuba (4 percent each). The next five countries were the Dominican Republic, Guatemala, the Philippines, India, and Korea, with 3 percent each. Foreign-born LEP individuals were less likely than the overall immigrant population to be naturalized citizens (37 percent versus 48 percent, respectively).
Of the 4.7 million native-born LEP individuals, 14 percent were born in Puerto Rico and less than 2 percent were born in Mexico to at least one U.S.-citizen parent. Another 3 percent were born abroad elsewhere to at least one U.S.-citizen parent. Among the U.S. states, California and Texas were the birthplace of the highest share of native-born LEP persons, with about 19 percent each, followed by New York with about 7 percent.
Spanish was the predominant language spoken by both immigrant and U.S.-born LEP individuals. About 64 percent (16.4 million) of the total LEP population spoke Spanish, followed by Chinese (1.8 million, or 7 percent), Vietnamese (867,000, 3 percent), Korean (592,000, 2 percent), and Tagalog (566,000, 2 percent). Close to 80 percent of the LEP population spoke one of these five languages.
There were marked differences, however, in the top languages spoken by LEP persons by nativity. Of the U.S.-born LEP population, 77 percent (3.6 million) spoke Spanish, followed by German (142,000, or 3 percent), Chinese (130,000, 3 percent), French (80,000, 2 percent), and Vietnamese (66,000, 1 percent). Among immigrant LEP individuals, Spanish was also the predominant language, spoken by about 61 percent (12.8 million). However, Asian languages were more likely to be spoken by the foreign-born LEP population, including Chinese (1.7 million, or 8 percent), Vietnamese (801,000, 4 percent), Korean (554,000, 3 percent), and Tagalog (531,000, 3 percent) (see Figure 4).
Figure 4. Top Ten Languages Spoken by Native- and Foreign-Born LEP Individuals, 2015
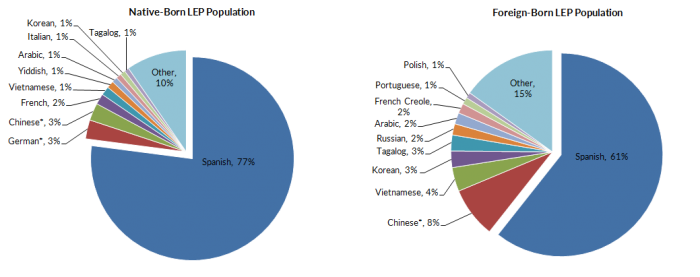
Notes: Chinese includes Chinese, Mandarin, and Cantonese; Hmong includes Mien; German includes Pennsylvania Dutch.
Source: MPI tabulation of data from the U.S. Census Bureau 2015 ACS.
The linguistic diversity of the LEP population varied across the nation due to differing immigration trends and population composition. For instance, in 2015, the top three languages spoken by LEP residents in New York were Spanish, Chinese, and Russian. In contrast, the top three in Maine were French, Spanish, and Cushite. In Hawaii, Illocano, Tagalog, and Chinese were the top three languages spoken by LEP persons.
In addition, the LEP share among speakers of particular languages (including foreign- and native-born) varied widely. Burmese speakers had the highest share of limited English proficiency (74 percent), compared to 58 percent of Vietnamese and Nepali speakers, and 55 percent of Chinese speakers. LEP individuals accounted for 41 percent of Spanish speakers.
Compared to their English-proficient counterparts, LEP individuals were much less likely to be of school age and much more likely to be of working age (see Table 3). In 2015, 9 percent of LEP individuals were children between the ages 5 and 17, versus 19 percent of the English-proficient population. Seventy-five percent were between ages 18 and 64 compared to 66 percent of English-proficient individuals. About 16 percent of both the LEP and English-proficient populations were senior citizens.
Table 3. Age Distribution by English Proficiency, 2015
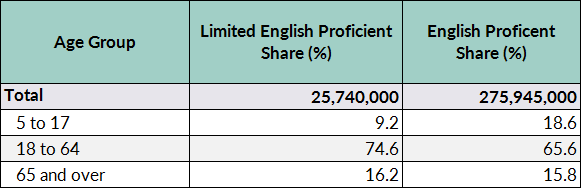
Source: MPI tabulation of data from the U.S. Census Bureau 2015 ACS.
LEP individuals were much more likely to be Latino or Asian than their English-proficient counterparts (see Figure 5). While Latinos comprised 62 percent of the LEP population, they accounted for 13 percent of the English-proficient population. Likewise, 22 percent of LEP individuals were Asian compared to 5 percent of English-proficient individuals.
Figure 5. Race and Ethnicity of LEP and English-Proficient Populations, 2015
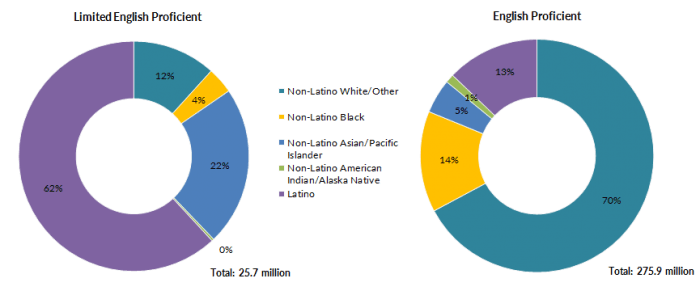
Source: MPI tabulation of data from the U.S. Census Bureau 2015 ACS.
In general, LEP adults were much less educated than their English-proficient peers. As of 2015, 45 percent of all LEP individuals ages 25 and older lacked a high school diploma compared to 9 percent of their English-proficient counterparts. About 15 percent of LEP adults had a bachelor’s degree or higher, compared to 32 percent of English-proficient adults.
LEP individuals ages 16 and older participated in the civilian labor force at a slightly lower rate than English-proficient individuals (60 percent versus 63 percent), largely because of greater gender differences in employment outcomes within the LEP population. Among English-proficient individuals, men participated in the civilian labor force at a higher rate than women (68 percent versus 59 percent), while the gender gap was much larger for LEP individuals (74 percent versus 48 percent).
Figure 6. Employed Workers in the Civilian Labor Force (ages 16 and Older) by Occupation, English Proficiency, and Gender, 2015
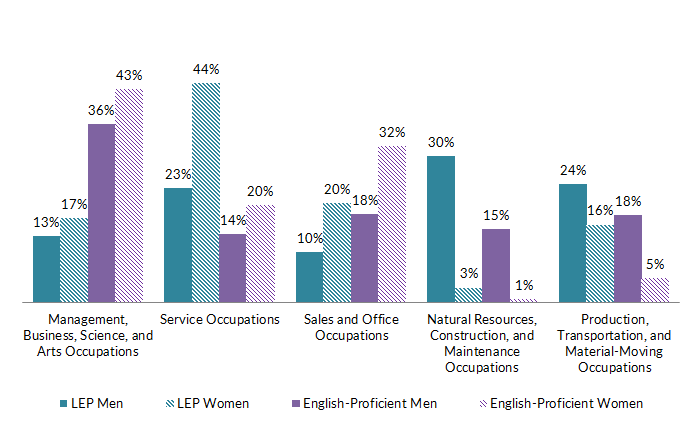
Source: MPI tabulation of data from the U.S. Census Bureau 2015 ACS.
Compared to their English-proficient counterparts, LEP men were more likely to work in natural resources, construction, and maintenance occupations (15 percent versus 30 percent), service occupations (14 percent versus 23 percent), and production, transportation, and material-moving occupations (18 percent versus 24 percent) (see Figure 6). LEP women were significantly more likely to work in service occupations (44 percent versus 20 percent), as well as production, transportation, and material-moving occupations (16 percent versus 5 percent) than their English-proficient counterparts.
LEP individuals were more likely to live in poverty than English-proficient individuals. In 2015, about 23 percent of LEP individuals lived in households with an annual income below the official federal poverty line—nearly twice as high as the share of English-proficient persons (13 percent).
Sources
U.S. Census Bureau. 2012. 2010 American Community Survey. Accessed from Steven Ruggles, Katie Genadek, Ronald Goeken, Josiah Grover, and Matthew Sobek. Integrated Public Use Microdata Series: Version 6.0 [Machine-readable database]. Minneapolis: University of Minnesota. Available online.
---. 2013. 1990 Decennial Census Summary Tape File 3. 2013. Accessed from the Minnesota Population Center, University of Minnesota. National Historical Geographic Information System: Version 2.0. Minneapolis: University of Minnesota. Available online.
---. 2013. 2000 Decennial Census Summary File 4. 2013. Accessed from the Minnesota Population Center, University of Minnesota. National Historical Geographic Information System: Version 2.0. Minneapolis: University of Minnesota. Available online.
---2016. 2015 American Community Survey. Accessed from U.S. Census Bureau, Public Use Microdata Series (PUMS) Data. Washington, DC: U.S. Census Bureau. Available online.