

Mexican Immigrants in the United States

Click here for larger version of map. Due to compatibility issues, you may need to download the map for it to load properly.
Source Spotlights are often updated as new data become available. Please click here to find the most recent version of this Spotlight.
Since claiming the top spot among all immigrant groups in the 1980 census, the Mexican immigrant population in the United States has continued to outsize other immigrant groups. In 2008, there were 11.4 million Mexican immigrants in the United States, accounting for 30.1 percent of all U.S. immigrants and 10 percent of all Mexicans. Over half of all Mexican immigrants reside in the United States illegally.
However, recent evidence suggests that immigration from Mexico has slowed in the context of the deep recession that officially began in December 2007 but started earlier in some regions of the country and sectors of the economy that are particularly important for immigrants.
Mexican immigrants mainly settle in "traditional" destination states like California and Texas, which combined are home to well over half of this group. But over the last two decades, the foreign born from Mexico, like other immigrant groups, have begun moving to "nontraditional" settlement areas. These include states in the South, such as Georgia and North Carolina, as well as Midwestern states such as Nebraska and Ohio (for more information on immigrants by state, see the ACS/Census Data tool on the MPI Data Hub).
The origins of Mexican immigrants have also changed over the past decade with more Mexicans coming from Mexico's less prosperous south and southeast compared to the traditional sending zones in Mexico's center-west region.
This spotlight focuses on Mexican immigrants residing in the United States, examining the population's size, flow, geographic distribution, and socioeconomic characteristics using data from the U.S. Census Bureau's 2008 American Community Survey (ACS) and 2000 Decennial Census, and the Department of Homeland Security's Office of Immigration Statistics (OIS) for 2008.
It also includes data from the Mexican National Institute of Statistics and Geography's Survey of Occupations and Employment (ENOE) and the Survey of Migration on the Northern Border of Mexico (EMIF), which is conducted jointly by Mexico's ministries of Foreign Affairs, Interior, and Labor and Social Protection, and the College of the Northern Border Region (COLEF) in Tijuana.
Click on the bullet points below for more information:
Size and Flow
- There were 11.4 million foreign born from Mexico residing in the United States in 2008.
- The Mexican-born population in the United States was larger than the total populations of nearly two-thirds of UN Member States.
- About one of every 10 Mexicans resides in the United States.
- The flow of migrants leaving Mexico has slowed substantially in recent years.
Distribution
- About 70 percent of the Mexican born resided in just four states.
- Mexican immigrants made up more than half of all foreign born in six states.
- Between 2000 and 2008, 11 states saw their Mexican-born population grow by at least 50,000.
- In four states, Mexican immigrants accounted for one-fifth or more of total population growth between 2000 and 2008.
- Over half of all Mexican immigrants resided in 10 metropolitan areas in 2008.
- Mexican immigrants made up over half of all foreign born in 15 metropolitan areas in 2008.
- Two of every five Mexican immigrants moving to the United States in 2008 came from six Mexican states.
Demographic and Socioeconomic Overview
- Nearly one-third of all Mexican foreign born in the United States arrived in 2000 or later.
- Over three-quarters of Mexican immigrants in 2008 were adults of working age.
- Mexican immigrant men outnumbered women in 2008.
- The majority of Mexican immigrants were not U.S. citizens in 2008.
- About three-quarters of Mexican immigrants in 2008 were limited English proficient.
- More than half of Mexican foreign-born adults did not have a high school education.
- Mexican immigrant men were more likely to participate in the civilian labor force than foreign-born men overall.
- Almost 40 percent of employed Mexican-born men worked in construction, extraction, and transportation.
- Over one-third of employed Mexican-born women worked in services.
Legal and Unauthorized Mexican Immigrant Population
- There were 3.4 million Mexican-born lawful permanent residents in 2008.
- Nearly all Mexican immigrants receiving lawful permanent residence in 2008 were admitted as family-based immigrants.
- Over 80 percent of Mexican-born lawful permanent residents in 2008 were eligible to naturalize.
- In 2009, 62 percent of all unauthorized immigrants in the United States were from Mexico.
- The number of unauthorized immigrants from Mexico increased 42 percent between 2000 and 2009.
- Over half of all Mexican immigrants in the United States were unauthorized.
|
Definitions
|
||
|
Size and Flow
There were 11.4 million foreign born from Mexico residing in the United States in 2008.
Immigrants from Mexico totaled 11,412,668 in 2008. The population has increased more than fivefold since 1980, when the decennial census counted 2.2 million Mexican immigrants.
Up until 1980, the foreign born from Mexico ranked behind foreign-born groups from Europe and Canada in terms of size (see Table 1). But this changed over the course of the 1960s and 1970s. By 1980, the 2.2 million Mexican born were almost similar in size compared to the next three origin groups combined: German born (849,384), Canadian born (842,859), and Italian born (831,922).
The share of the foreign born represented by Mexican immigrants doubled from 7.9 percent in 1970 to 15.6 percent in 1980 and then almost doubled again to 30.1 percent by 2008 (see Table 1; see also the pie charts showing the top 10 countries of birth of immigrants residing in the United States over time here).
|
Table 1. Total and Mexican Foreign-Born Populations, 1960 to 2008
|
||||||||||||||||||||||||||||||||||||||||
|
||||||||||||||||||||||||||||||||||||||||
The Mexican-born population in the United States was larger than the total populations of all but seven U.S. states.
The Mexican-born population in the United States was larger than the total populations of all but seven U.S. states: California, Texas, New York, Florida, Illinois, Pennsylvania, and Ohio.
This population was also larger than the total populations of about two-thirds (63 percent) of the 192 UN Member States in 2008, including Greece (10.7 million), Portugal (10.7 million), Belgium (10.4 million), and Sweden (9.0 million).
About one of every 10 Mexicans resides in the United States.
The 11.4 million Mexican immigrants in the United States represent 10.8 percent of the 105.9 million native-born Mexicans living in Mexico in 2008. (This excludes the estimated 734,000 foreign born residing in Mexico of whom nearly three-quarters — 74.0 percent or 543,000 — were born in the United States.)
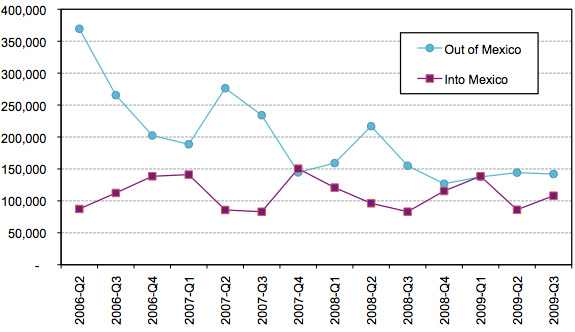
The flow of migrants leaving Mexico has slowed substantially in recent years.
The number of Mexicans departing from Mexico has declined substantially over the past two years. In the third quarter (July to September) of 2009, about 142,000 Mexicans departed for abroad, according to the Mexican government's National Survey of Occupations and Employment (ENOE), a monthly household survey. This was 8 percent lower than the number who departed in the third quarter of 2008 (155,000), 39 percent lower than in 2007 (234,000), and 47 percent less than in 2006 (266,000) (see Figure 1).
Moreover, the number of migrants departing from Mexico has historically peaked in the summer months, but this trend disappeared in 2009. This lack of seasonal migration appears to be particularly pronounced in Mexico's small towns with 2,500 residents or less where the springtime (April to June) emigration rate declined from 25.4 emigrants per 1,000 residents in 2006 to 19.0 in 2007, 17.0 in 2008, and 8.8 in 2009.
Return migration — measured as the number of migrants entering Mexico but who are overwhelmingly composed of Mexicans returning from abroad — has remained stable between 80,000 and 150,000 persons per quarter since 2006.
|
|
||
|
Distribution
About 70 percent of the Mexican born resided in just four states.
California had the largest number of foreign-born residents from Mexico (4,254,415, or 37.3 percent of the total) in 2008, followed by Texas (2,396,390, or 21.0 percent), Illinois (720,106, or 6.3 percent), and Arizona (611,410, or 5.4 percent).
The remaining six states with the largest numbers of Mexican immigrants include Georgia (282,290, or 2.5 percent), Florida (256,911, or 2.3 percent), North Carolina (250,614, or 2.2 percent), Colorado (250,329, or 2.2 percent), New York (235,254, or 2.1 percent), and Nevada (233,899, or 2.0 percent).
Mexican immigrants made up more than half of all foreign born in six states.
Mexican immigrants accounted for more than half of all immigrants in New Mexico (71.8 percent), Arizona (65.6 percent), Texas (61.6 percent), Arkansas (54.2 percent), Idaho (51.7 percent), and Colorado (50.1 percent).
By contrast, the Mexican-born made up less than 5 percent of all immigrants in seven states: Maryland (4.9 percent), Rhode Island (3.1 percent), Hawaii (3.0 percent), Vermont (2.6 percent), New Hampshire (2.6 percent), Massachusetts (1.4 percent), and Maine (0.5 percent).
Between 2000 and 2008, 11 states saw their Mexican-born population grow by at least 50,000.
The Mexican-born population grew by 50,000 people or more between 2000 and 2008 in Texas (+517,000), California (+326,000), Arizona (+175,000), Illinois (+102,000), Georgia (+92,000), Nevada (+80,000), North Carolina (+79,000), New York (+74,000), Colorado (+69,000), Florida (+68,000), and Washington (+61,000).
In four states, Mexican immigrants accounted for one-fifth or more of total population growth between 2000 and 2008.
Mexican immigrants accounted for over half (58.6 percent) of Rhode Island's total population growth between 2000 and 2008. Of the 2,469-person increase in Rhode Island's population over the period, 1,447 were Mexican immigrants. Mexican immigrants also accounted for a substantial portion of total population growth between 2000 and 2008 in Michigan (37.5 percent), West Virginia (34.3 percent), Illinois (21.2 percent), New Mexico (18.1 percent), Nebraska (16.8 percent), New Jersey (16.4 percent), and Oklahoma (15.5 percent).
In two states, Louisiana and North Dakota, the total population shrunk between 2000 and 2008, but the Mexican immigrant population grew. In Louisiana, the total population decreased by 58,180 people, but the Mexican immigrant population grew by 10,670 people. Admittedly on a much smaller scale, in North Dakota, the total population decreased by 719 people, but the Mexican-born population grew by 480 people.
Over half of all Mexican immigrants resided in 10 metropolitan areas in 2008.
Los Angeles-Long Beach-Santa Ana, CA, was the metropolitan area with the largest number of Mexican born (1,820,388, or 16.0 of all Mexican immigrants in the United States), followed by Chicago-Naperville-Joliet, IL-IN-WI (691,113, or 6.1 percent); Dallas-Fort Worth-Arlington, TX (640,551, or 5.6 percent);Houston-Sugar Land-Baytown, TX (592,193, or 5.2 percent); Riverside-San Bernardino-Ontario, CA (554,295, or 4.9 percent); Phoenix-Mesa-Scottsdale, AZ (442,880, or 3.9 percent); San Diego-Carlsbad-San Marcos, CA (304,883, or 2.7 percent); New York-Northern New Jersey-Long Island, NY-NJ-PA (303,949, or 2.7 percent); San Francisco-Oakland-Fremont, CA (250,492, or 2.2 percent); and Atlanta-Sandy Springs-Marietta, GA (189,908, or 1.7 percent). These 10 metropolitan areas accounted for 50.7 percent of the 11.4 million Mexican immigrants in the United States.
Mexican immigrants made up over half of all foreign born in 15 metropolitan areas in 2008.
Mexican immigrants accounted for over half of all the foreign born in 15 metropolitan areas in 2008. They were nearly three-quarters of all immigrants in Salinas, CA (92,174, or 73.4 percent); Bakersfield, CA (112,504, or 72.1 percent); and Santa Barbara-Santa Maria-Goleta, CA (64,797, or 70.5 percent).
The Mexican born were about two-thirds of all immigrants in San Antonio, TX (143,244, or 66.3 percent); Albuquerque, NM (55,153, or 65.0 percent); Phoenix-Mesa-Scottsdale, AZ (442,880, or 64.9 percent); Fresno, CA (122,725, or 64.5 percent); Santa Rosa-Petaluma, CA (49,846, or 62.6 percent); Riverside-San Bernardino-Ontario, CA (554,295, or 62.0 percent); and Tucson, AZ (80,166, or 61.7 percent). They were around half of all immigrants in Oxnard-Thousand Oaks-Ventura, CA (104,168, or 58.7 percent); Dallas-Fort Worth-Arlington, TX (640,551, or 57.1 percent); Austin-Round Rock, TX (124,424, or 51.9 percent); Reno-Sparks, NV (31,564, or 51.0 percent); and Stockton, CA (77,577, or 50.7 percent).
Two of every five Mexican immigrants moving to the United States in 2008 came from six Mexican states.
According to data from the Mexican government's 2008 Survey of Migration on the Northern Border of Mexico (EMIF), nearly half of the 963,000 Mexicans moving to the United States in 2008 originated in six Mexican states: Chiapas (136,388, or 14.2 percent), Guanajuato (82,701, or 8.6 percent), Oaxaca (69,473, or 7.2 percent), Sonora (66,826, or 6.9 percent), Michoacán (62,108, or 6.5 percent), and Veracruz (56,185, or 5.8 percent). The states of Mexico (54,428, or 5.7 percent) and Jalisco (51,443, or 5.3 percent) also sent large numbers of migrants to the United States in 2008.
As Mexican immigrants have settled in increasingly diverse destinations across the United States, their origins have become more diverse as well. In 1995, the top states of origin of Mexicans migrating to the United States were the four central-western Mexican states that had traditionally sent most migrants to the United States for much of the 20th century: Guanajuato (17.6 percent), Michoacán (16.6 percent), Jalisco (7.4 percent), and Zacatecas (6.1 percent). At that time, these four states accounted for almost half of all Mexicans migrating to the United States, but by 2008 they accounted for less than one-quarter of the flow.
Over the decade, flows came largely from states from southern and southeastern Mexico — such as Chiapas, which saw its share increase from 0.6 to 14.2 percent over the period, Veracruz (from 1.3 to 5.8 percent), and the State of Mexico (from 2.8 to 5.7 percent).
Note: The Survey of Migration on the Northern Border of Mexico is a sample survey of Mexican nationals age 12 and older encountered by enumerators in 23 localities on the Mexican side of the U.S.-Mexico border. The Mexican National Population Council (CONAPO) estimates that these localities account for about 94 percent of total border crossings. The survey does not include individuals who enter the United States by air. For more information on EMIF methodology, click here (in Spanish).
Demographic and Socioeconomic Overview
Nearly one-third of all Mexican foreign born in the United States arrived in 2000 or later.
As of 2007, 31.3 percent of the 11.4 million Mexican foreign born entered the country in 2000 or later. Another 32.0 percent entered between 1990 and 1999, 20.0 percent between 1980 and 1989, 10.9 percent between 1970 and 1979, and the remaining 5.7 percent prior to 1970.
Over three-quarters of Mexican immigrants in 2008 were adults of working age.
Of the Mexican immigrants residing in the United States in 2008, 8.7 percent were minors (under age 18), 78.4 percent were of working age (between ages 18 and 54), and 12.9 percent were seniors (age 55 or older).
Of the total foreign-born population in the United States in 2008, 7.4 percent were minors, 69.0 percent were of working age, and 23.6 percent were seniors.
Mexican immigrant men outnumbered women in 2008.
Men were 55.8 percent of the Mexican immigrant population in 2008 and 44.2 percent were women. Among all immigrants, 50.2 percent were men and 49.8 percent were women.
The majority of Mexican immigrants were not U.S. citizens in 2008.
Among the Mexican foreign born, 22.0 percent were U.S. citizens, compared to 43.0 percent among the overall foreign-born population.
About three-quarters of Mexican immigrants in 2008 were limited English proficient.
About three-quarters of Mexican immigrants in 2008 were limited English proficient. Of the 11.4 million Mexican immigrants age 5 and older, 3.1 percent reported speaking "English only" while 23.1 percent reported speaking English "very well." In contrast, 73.8 percent reported speaking English less than "very well," much higher than the 52.1 percent reported among all foreign born age 5 and older.
(Note: The term limited English proficient refers to any person age 5 and older who reported speaking English "not at all," "not well," or "well" on their survey questionnaire. Individuals who reported speaking only English or speaking English "very well" are considered proficient in English).
More than half of Mexican foreign-born adults did not have a high school education.
In 2008, 61.5 percent of the 9.2 million Mexican-born adults age 25 and older had no high school diploma or the equivalent general education diploma (GED), compared to 32.5 percent among all foreign-born adults. About 22.2 percent had a high school diploma or GED compared to 21.9 percent among all foreign-born adults.
On the other end of the education continuum, about 5.2 percent of Mexican immigrants had a bachelor's degree or higher compared to 27.1 percent among the 31.9 million foreign-born adults.
Because of the size of Mexican immigrant population, Mexico was the fourth-largest supplier of highly skilled immigrants to the United States, following India, the Philippines, and China.
In 2008, there were about 480,000 Mexican immigrants with a bachelor's degree or higher, of whom about one-fourth had a master's or other professional degree.
Mexican immigrant men were more likely to participate in the civilian labor force than foreign-born men overall.
In 2008, Mexican-born men age 16 and older were more likely to be in the civilian labor force (86.8 percent) than foreign-born men overall (80.6 percent). However, Mexican-born women (52.5 percent) were less likely to participate in the civilian labor force than all foreign-born women (57.1 percent).
Almost 40 percent of employed Mexican-born men worked in construction, extraction, and transportation.
Among the 4.9 million Mexican-born male workers age 16 and older employed in the civilian labor force in 2008, 38.8 percent reported working in construction, extraction, and transportation, and 22.8 percent reported working in services (see Table 2). By contrast, 25.9 percent of all foreign born reported working in construction, extraction, and transportation and 17.4 percent reported working in services.
In addition, 17.9 percent of civilian employed Mexican-born males age 16 and older reported working in manufacturing, installation, and repair compared to 14.6 percent among all foreign-born men.
Together, these three industry groups employed nearly 80 percent of all civilian employed Mexican-born males age 16 and older. All three of these industry groups suffered heavy job losses in 2008 and 2009 as a result of the economic recession that began in December 2007.
Over one-third of employed Mexican-born women worked in services.
Among the 2.2 million Mexican-born female workers age 16 and older employed in the civilian labor force in 2008, 38.6 percent reported working in service occupations and 14.9 percent in manufacturing, installation, and repair occupations (see Table 2).
By contrast, 25.7 percent of all civilian employed immigrant women age 16 and older worked in services and 8.5 percent worked in manufacturing, installation, and repair occupations.
|
Table 2. Occupations of Employed Workers in the Civilian Labor Force Age 16 and Older by Gender and Origin, 2008
|
||||||||||||||||||||||||||||||||||||||||||||||||||||||||||||||||||||||||||||||||||||||||||||||||||||||
|
||||||||||||||||||||||||||||||||||||||||||||||||||||||||||||||||||||||||||||||||||||||||||||||||||||||
Legal and Unauthorized Mexican Immigrant Population
There were 3.4 million Mexican-born lawful permanent residents in 2008.
The 3,390,000 Mexican-born lawful permanent residents (LPRs) in the United States in 2008 made up about 26.9 percent of all LPRs (12.6 million). In 2008, 189,989 Mexicans received LPR status, about 17.2 percent of the 1.1 million immigrants receiving LPR status in 2008. The number of Mexicans receiving LPR status in 2008 was the largest since 2002.
Nearly all Mexican immigrants receiving lawful permanent residence in 2008 were admitted as family-based immigrants.
Almost all (93.9 percent) Mexican immigrants receiving lawful permanent residence in 2008 were admitted as family-based immigrants — principally as the immediate relatives of U.S. citizens (111,703, or 58.8 percent) and as family-sponsored immigrants (66,693, or 35.1 percent).
Over 80 percent of Mexican-born lawful permanent residents in 2008 were eligible to naturalize.
U.S. Citizenship and Immigration Service's Office of Immigration Statistics (OIS) estimates that 2,720,000 Mexican-born LPRs, or about 80 percent of all Mexican-born LPRs, were eligible to naturalize in 2008. The Mexican-born accounted for one-third (33.3 percent) of all LPRs eligible to naturalize in 2008.
If the entire Mexican-born population eligible to naturalize did so, it would double the number of naturalized U.S. citizens born in Mexico and raise the share of naturalized citizens among the Mexican immigrant population to about 46 percent — in line with the naturalization rate among all immigrant groups.
In 2009, 62 percent of all unauthorized immigrants in the United States were from Mexico.
OIS has estimated that 6,650,000, or 62 percent, of the approximately 10.8 million unauthorized migrants in January 2009 were born in Mexico.
The number of unauthorized immigrants from Mexico increased 42 percent between 2000 and 2009.
The estimated number of unauthorized immigrants from Mexico has increased 42 percent since 2000, rising from 4.7 million to 6.7 million. The Mexican-born share of all unauthorized immigrants rose from 55 percent in 2000 to 62 percent in 2009.
OIS estimates that the unauthorized immigrant population from Mexico increased on average by about 220,000 people per year between 2000 and 2009 although most analysts estimate that most of this growth occurred early in the decade and slowed substantially starting in 2007 as the U.S. economy faced a deep recession.
Over half of all Mexican immigrants in the United States were unauthorized.
According to the Pew Hispanic Center, over half (55 percent) of all Mexican immigrants in the United States were unauthorized in 2008. Mexicans accounted for more than three-quarters of all unauthorized immigrants in Arkansas, California, Colorado, Idaho, Indiana, Mississippi, Nevada, Oregon, Texas, and Wisconsin. They accounted for 90 percent or more of unauthorized immigrants in Arizona, Colorado, and New Mexico.
For information about ACS methodology, sampling error, and nonsampling error, click here.
Sources
Hoefer, Michael, Nancy Rytina, and Bryan C. Baker. 2010. Estimates of the Unauthorized Immigrant Population Residing in the United States: January 2009. U.S. Department of Homeland Security, Office of Immigration Statistics. Available online.
Instituto Nacional de Estadística y Geografía (INEGI). 2008. Encuesta nacional de ocupación y empleo 2008. Aguascalientes, Mexico. Available online.
———. 2009. En el 2009 se rompe el patrón estacional de la emigración internacional en México. Aguascalientes, Mexico. Press release no. 351/09. Available online.
Monger, Randall and Nancy Rytina. 2009. U.S. Legal Permanent Residents: 2008. U.S. Department of Homeland Security, Office of Immigration Statistics. Available online.
Passel, Jeffrey S. and D'Vera Cohn. 2009. Mexican Immigrants: How Many Come ? How Many Leave? Washington, DC : Pew Hispanic Center. Available online.
———. 2009. A Portrait of Unauthorized Immigrants in the United States. Washington, DC: Pew Hispanic Center. Available online.
Rendall, Michael S., Peter Brownell and Sarah Kups. 2009. Declining Return Migration from the United States to Mexico in the late-2000s Recession. RAND Labor and Population Working Paper WR-720, December 2009. Available online.
Rytina, Nancy. 2009. Estimates of the Legal Permanent Resident Population in 2008. October 2009. U.S. Department of Homeland Security, Office of Immigration Statistics. Available online.
Secretaría de Trabajo y Previsión Social, Consejo Nacional de Población, Instituto Nacional de Migración, Secretaría de Relaciones Exteriores, and el Colegio de la Frontera Norte. 2009. Encuesta sobre Migración en la Frontera Norte de México. Available online.
U.S. Census Bureau. 2008 American Community Survey. Accessed from Steven Ruggles, Matthew Sobek, Trent Alexander, et al., Integrated Public Use Microdata Series: Version 3.0. Minneapolis, MN: Minnesota Population Center, 2004.
U.S. Department of Homeland Security, Office of Immigration Statistics. 2008 Yearbook of Immigration Statistics. Various tables. Available online.