

Mexican Immigrants in the United States

Cinco de Mayo celebration in Washington, DC (Photo: pml2008/Flickr)
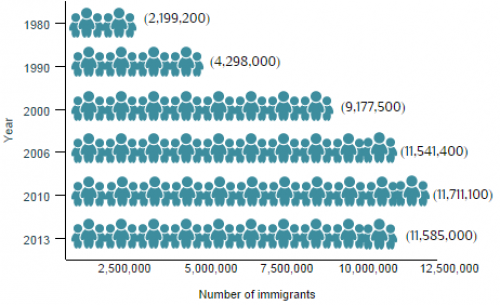
Large-scale Mexican migration to the United States began in the early 20th century, motivated by labor demands in the United States and political unrest in Mexico. Throughout the 20th century, major reforms to the U.S. immigration system played a role in shaping the size and character of Mexican immigration flows. Since 1980, Mexicans have been the largest immigrant group in the United States. As of 2013, approximately 11.6 million Mexican immigrants resided in the United States—up from 2.2 million in 1980—and Mexicans accounted for 28 percent of the country’s 41.3 million foreign born.
Immigration from Mexico to the United States has gone through four main periods. The first wave, occurring prior to World War II, consisted of agricultural workers recruited by private labor contractors, with the number of Mexican immigrants rising from 105,200 in 1900 to 624,400 in 1930. The Bracero program, from 1942 to 1964, ushered in the second wave, also consisting mostly of agricultural guest workers. The third, largely unauthorized wave began after the Bracero program was terminated and after 1965 changes to U.S. immigration law ended national-origin quotas and imposed the first numerical limits on Mexico and other Latin American countries. The majority of Mexican immigrants in this third wave were male, seasonal farm laborers who regularly traveled back and forth across the border. The passage of the Immigration Reform and Control Act of 1986 (IRCA) and subsequent investments in border security were a turning point, initiating the fourth wave of Mexican migration. IRCA legalized close to 3 million unauthorized migrants, including 2.3 million Mexicans, in return for tougher border enforcement and penalties for American employers who hired unauthorized workers. As crossing the border became more difficult, and as economic changes in the United States opened additional jobs to low-skilled foreign workers, immigrants began to settle permanently, bringing their families to live in the United States. Between 1990 and 2010 more than 7.5 million Mexican immigrants—many of whom were unauthorized—arrived.
More recently, Mexican immigration to the United States has begun to decline—marking at least a pause, and possibly an end to the fourth wave. Declining inflows appear to reflect the impact of the Great Recession, improved educational and economic opportunities in Mexico, and ever-tougher border enforcement.
|
Figure 1. Mexican Immigrant Population in the United States, 1980-2013
|
|
Source: Data from U.S. Census Bureau 2006, 2010, and 2013 American Community Surveys (ACS), 2000 Decennial Census, and Campbell J. Gibson and Emily Lennon, "Historical Census Statistics on the Foreign-born Population of the United States: 1850-1990" (Working Paper No. 29, U.S. Census Bureau, Washington, DC, February 1999), www.census.gov/population/www/documentation/twps0029/twps0029.html. |
Click here for an interactive chart that highlights Mexican migration trends.
The vast majority of Mexican emigrants settle in the United States, with others heading to Canada (70,000), Spain (47,000), and Guatemala (17,000), according to mid-2013 estimates by the United Nations Population Division. Click here to view an interactive map showing where migrants from Mexico and other countries have settled worldwide.
Mexicans represent the largest unauthorized immigrant group in the United States. As of 2012, 6.7 million (59 percent) of the estimated 11.3 million unauthorized immigrants in the United States were from Mexico. The number of Mexican-born beneficiaries of the Deferred Action for Childhood Arrivals (DACA) program is also the largest of all origin groups. Between August 15, 2012 and June 30, 2014, U.S. Citizenship and Immigration Services (USCIS) had accepted 526,816 initial and renewal DACA applications from youth born in Mexico (77 percent of all applications accepted). As of March 31, more than 85 percent of accepted applications from Mexican nationals had been approved, granting temporary reprieve from deportation.
|
Definitions
|
||
|
Most Mexican immigrants who obtain lawful permanent residence in the United States (also known as receiving a “green card”) qualify as immediate relatives of U.S. citizens or as family-sponsored immigrants. Compared to the total foreign-born population, Mexican immigrants were more likely to be Limited English Proficient (LEP), have less education and lower income, experience a higher poverty rate, and lack health insurance.
Using data from the U.S. Census Bureau (the most recent 2013 American Community Survey [ACS] as well as pooled 2008-12 ACS data), the Department of Homeland Security’s Yearbook of Immigration Statistics, and the World Bank's annual remittance data, this Spotlight provides information on the Mexican immigrant population in the United States, focusing on its size, geographic distribution, and socioeconomic characteristics.
Click on the bullet points below for more information:
- Distribution by State and Key Cities
- English Proficiency
- Educational and Professional Attainment
- Income and Poverty
- Immigration Pathways and Naturalization
- Health Coverage
- Diaspora
- Remittances
Distribution by State and Key Cities
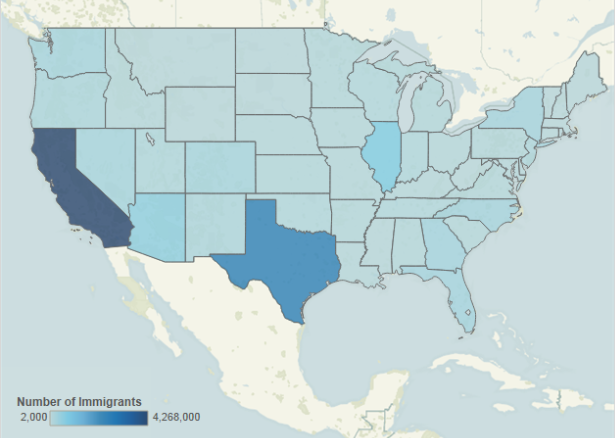
Most immigrants from Mexico settled in California (37 percent), Texas (21 percent), and Illinois (6 percent). The top four counties with Mexican immigrants were Los Angeles County in California, Harris County (Houston) in Texas, Cook County (Chicago) in Illinois, and Orange County in California. Together, the four counties accounted for about 23 percent of the total Mexican immigrant population in the United States.
|
Figure 2. Top Destination States for Mexican Immigrants in the United States, 2008-12
|
|
Source: Migration Policy Institute (MPI) tabulation of data from U.S. Census Bureau pooled 2008-12 ACS. |
Click herefor an interactive map that shows the geographic distribution of immigrants by state and county. Select Mexico from the dropdown menu to see which states and counties have the highest distributions of Mexican immigrants.
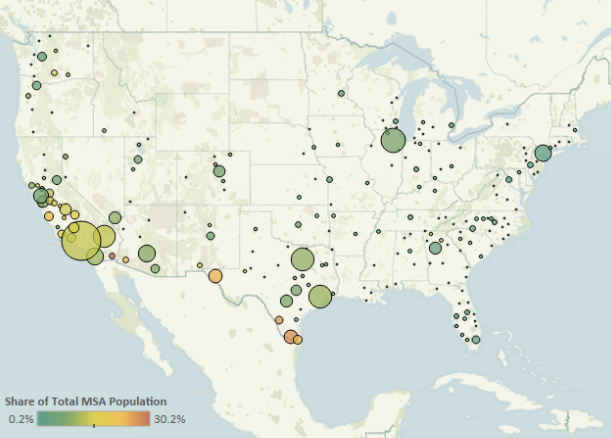
In the 2008-12 period, the U.S. cities with the greatest number of Mexican immigrants were the greater Los Angeles, Chicago, and Houston metropolitan areas. These three metropolitan areas accounted for about 26 percent of Mexican immigrants in the United States.
|
Figure 3. Top Destination Metropolitan Areas for Mexican Immigrants in the United States, 2008-12
|
|
Source: Migration Policy Institute (MPI) tabulation of data from U.S. Census Bureau pooled 2008-12 ACS. |
|
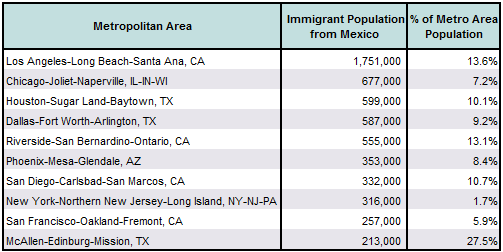
Table 1. Top Concentrations by Metropolitan Area for the Foreign Born from Mexico, 2008-12
|
|
Source: Migration Policy Institute (MPI) tabulation of data from U.S. Census Bureau pooled 2008-12 ACS. |
Click here for an interactive map that highlights the metropolitan areas with the highest concentrations of immigrants. Select Mexico from the dropdown menu to see which metropolitan areas have the highest concentrations of Mexican immigrants.
Mexican immigrants were less likely to be proficient in English and speak English at home than the overall U.S. foreign-born population. In 2013, about 69 percent of Mexican immigrants (ages 5 and over) reported limited English proficiency, compared to 50 percent of the total foreign-born population. Approximately 4 percent of Mexican immigrants spoke only English at home, versus 16 percent of all immigrants.
Note: Limited English proficiency refers to those who indicated on the ACS questionnaire that they spoke English less than “very well.”
Educational and Professional Attainment
Mexican immigrants tend to have much lower educational attainment compared to the overall foreign- and native-born populations. In 2013, 6 percent of Mexican immigrants (ages 25 and over) had a bachelor’s degree or higher, compared to 28 percent of the total U.S. foreign-born population and 30 percent of the native-born population.
The Mexican immigrant population was younger than the overall U.S. immigrant population but older than the native-born population. The median age of Mexican immigrants was 40 years, compared to 43 for the foreign-born population overall and 36 for the native-born population. In 2013, 87 percent of Mexican immigrants were of working age (18 to 64), 8 percent were ages 65 and over, and 6 percent were under 18. In comparison, 80 percent of all foreign born in the United States were of working age, 14 percent were 65 and over, and 6 percent were under 18. Meanwhile, 60 percent of the native-born population was of working age, 14 percent was 65 and over, and 26 percent was under 18.
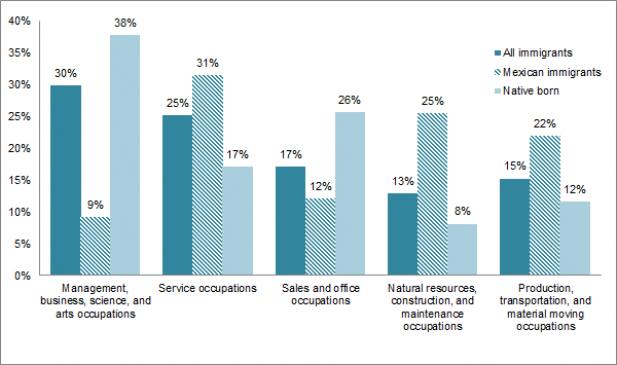
Mexican immigrants participate in the labor force at a slightly higher rate than the overall immigrant and native-born populations. In 2013, about 70 percent of Mexican immigrants (ages 16 and over) were in the civilian labor force, compared to 67 percent and 63 percent of the overall foreign-born and native-born populations respectively. Mexican immigrants were much more likely to be employed in service occupations (31 percent); natural resources, construction, and maintenance occupations (25 percent); and production, transportation, and material moving occupations (22 percent) compared to the total foreign- and native-born populations.
|
Figure 4. Employed Workers in the Civilian Labor Force (ages 16 and older) by Occupation and Origin, 2013
|
|
Source: MPI tabulation of data from the U.S. Census Bureau 2013 ACS. |
Mexican immigrants had much lower incomes compared to the total foreign- and native-born populations. In 2013, median household income among Mexican immigrants was $36,700, compared to $48,137 and $52,997 for the immigrant and native-born populations respectively.
The poverty rate among Mexican immigrants was also much higher than the other two groups. In 2013, 28 percent of Mexican immigrant families lived in poverty, compared to 18 percent and 10 percent for the total foreign-born and native-born populations respectively.
Immigration Pathways and Naturalization
In 2013, approximately 11.6 million Mexican immigrants resided in the United States, comprising about 28 percent of the total U.S. foreign-born population. Twenty-five percent of Mexican immigrants were naturalized U.S. citizens—nearly half the naturalized share among the overall foreign-born population (47 percent).
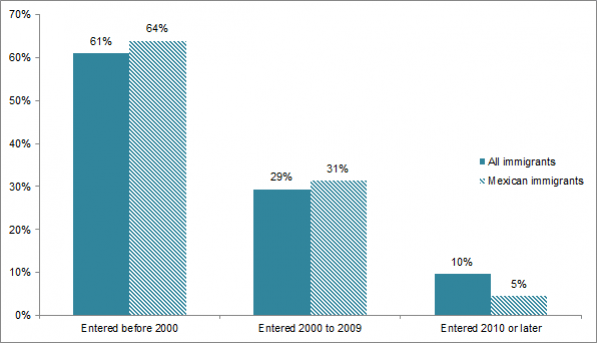
Most Mexican immigrants arrived prior to 2000 (64 percent), 31 percent between 2000 and 2009, and 5 percent in 2010 and after. Meanwhile, 61 percent of all immigrants to the United States arrived prior to 2000, 29 percent between 2000 and 2009, and 10 percent in 2010 and after.
|
Figure 5. Mexican Immigrants and All Immigrants in the United States by Period of Arrival, 2013
|
|
Source: MPI tabulation of data from the U.S. Census Bureau 2013 ACS. |
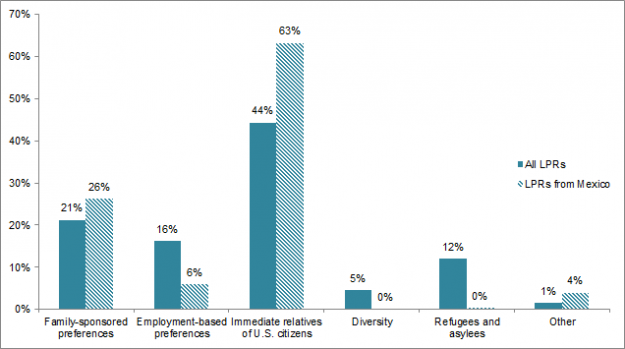
In 2013, the majority of Mexican immigrants who became lawful permanent residents (LPRs) in the United States were immediate relatives of U.S. citizens (63 percent) or held family-sponsored preference visas (26 percent). Mexican immigrants were much less likely to become LPRs via employment pathways (6 percent) compared to the overall LPR population (16 percent).
|
Figure 6. Immigration Pathways of Mexican Immigrants and All Immigrants in the United States, 2013
|
|
Notes: Family-sponsored: Includes adult children and siblings of U.S. citizens as well as spouses and children of green-card holders. Immediate relatives of U.S. citizens: Includes spouses, minor children, and parents of U.S. citizens. Diversity Visa Lottery: The Immigration Act of 1990 established the Diversity Visa Lottery to allow entry to immigrants from countries with low rates of immigration to the United States. The law states that 55,000 diversity visas are made available each fiscal year. Source: MPI tabulation of data from Department of Homeland Security (DHS), 2013 Yearbook of Immigration Statistics (Washington, DC: DHS Office of Immigration Statistics, 2014), www.dhs.gov/yearbook-immigration-statistics-2013-lawful-permanent-residents. |
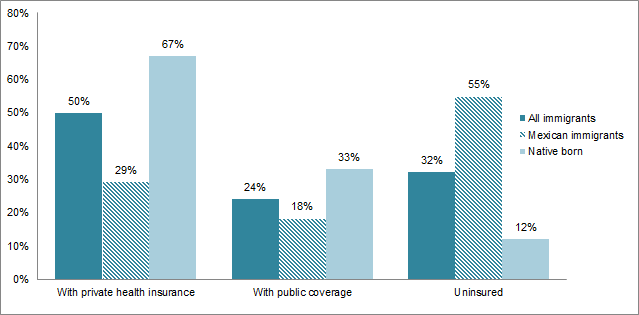
Mexican immigrants in 2013 were much more likely to be uninsured (55 percent) compared to the overall U.S. foreign-born population (32 percent) as well as the native-born population (12 percent). Mexican immigrants were less likely to have public or private health insurance compared to the foreign-born and native-born populations.
|
Figure 7. Health Coverage for Mexican Immigrants, All Immigrants, and the Native Born, 2013
|
|
Note: The sum of shares by type of insurance is likely to be greater than 100 because people may have more than one type of insurance. Source: MPI tabulation of data from the U.S. Census Bureau 2013 ACS. |
The Mexican diaspora population in the United States is comprised of approximately 34.8 million individuals who were either born in Mexico or reported Mexican ancestry or Hispanic origin, according to tabulations from the U.S. Census Bureau pooled 2008-12 ACS.
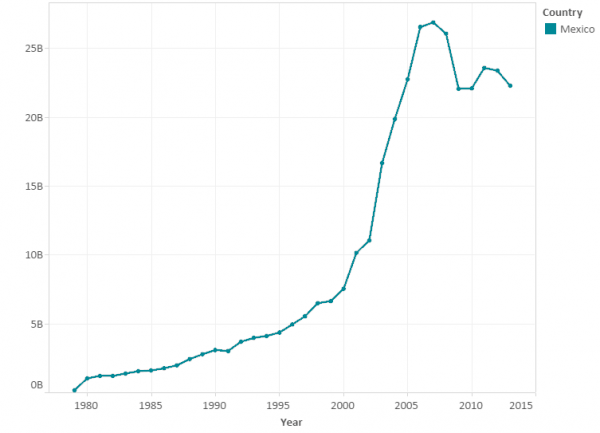
Total remittances sent to Mexico via formal channels equaled $22 billion in 2013, representing about 2 percent of the country’s gross domestic product (GDP), according to data from the World Bank. Remittances received by Mexicans have seen a 14-fold increase since 1985.
|
Figure 8. Annual Remittance Flows to Mexico, 1979-2013
|
|
Source: MPI tabulations of data from the World Bank Prospects Group, “Annual Remittances Data,” April 2014 update. |
Visit the Data Hub’s collection of interactive remittances tools, which track remittances by inflow and outflow, between countries, and over time.
Sources
Baker, Bryan and Nancy Rytina. 2013. Estimates of the Unauthorized Immigrant Population Residing in the United States: January 2012. Washington, DC: Department of Homeland Security, Office of Immigration Statistics. Available Online.
Batalova, Jeanne, Sarah Hooker, and Randy Capps with James D. Bachmeier. 2014. DACA at the Two-Year Mark: A National and State Profile of Youth Eligible and Applying for Deferred Action. Washington, DC: Migration Policy Institute. Available Online.
Department of Homeland Security (DHS), Office of Immigration Statistics. 2014. 2013 Yearbook of Immigration Statistics. Washington, DC: DHS Office of Immigration Statistics. Available Online.
Durand, Jorge, Douglas S. Massey, and Emilio A. Parrado. 1999. The New Era of Mexican Migration to the United States. Journal of American History. Available Online.
Gibson, Campbell J. and Emily Lennon. 1999. Historical Census Statistics on the Foreign-born Population of the United States: 1850-1990. Working Paper No. 29, U.S. Census Bureau, Washington, DC, February 1999. Available Online.
Massey, Douglas, Jorge Durand, and Nolan Malone. 2012. Beyond Smoke and Mirrors. New York: Russell Sage Foundation.
Massey, Douglas and Audrey Singer. 1995. New Estimates of Undocumented Mexican Migration and the Probability of Apprehension. Demography 32 (2): 203-13.
Rosenblum, Marc R. and Kate Brick. 2011. US Immigration Policy and Mexican/Central American Migration Flows: Then and Now. Washington, DC: Migration Policy Institute. Available Online.
U.S. Census Bureau. 2013. 2013 American Community Survey. American FactFinder. Available Online.
---. 2010. 1850-2000 Decennial Census and 2000-2012 ACS. Accessed from Steven Ruggles, J. Trent Alexander, Katie Genadek, Ronald Goeken, Matthew B. Schroeder, and Matthew Sobek. Integrated Public Use Microdata Series: Version 5.0 [Machine-readable database]. Minneapolis: University of Minnesota, 2010. Available Online.
World Bank Prospects Group. 2013. Annual Remittances Data, April 2014 update. Available Online.