

Origin and Community: Asian and Latin American Unauthorized Youth and U.S. Deportation Relief

Unauthorized youth line up to apply for DACA. (Photo credit: Peter Holderness/WBEZ)
This August marks the third anniversary of implementation of the Deferred Action for Childhood Arrivals (DACA) program, an Obama administration initiative that has provided temporary relief from deportation and access to work authorization to more than 660,000 unauthorized immigrants brought to the United States as children. To receive a grant of DACA, unauthorized youth must meet certain age, residency, education, and criminal history criteria.
With DACA in its third year, the first cohorts of beneficiaries of the two-year grant have been applying to renew their status. Renewal rates among diverse origin groups are varied.
Using U.S. Citizenship and Immigration Services (USCIS) public data and Migration Policy Institute (MPI) estimates of the population potentially eligible for DACA, this article compares initial and renewal applications filed by unauthorized youth from Latin America and Asia. Drawing on interviews with immigrant advocates and community organizers, the article also explores cultural factors and outreach strategies to reach potentially eligible DACA youth, and why the application rates differ by country of origin.
DACA Applications among Latin American and Asian Youth
The vast majority of unauthorized immigrants applying to the deferred action program come from Latin America, chiefly Mexico and Central America. A significant number also originate from Asian and Pacific Island countries. Approximately 979,000 young unauthorized immigrants from Latin America and the Asia Pacific met all criteria at the program’s launch in August 2012, out of a total cohort of 1.16 million immediately eligible individuals from all regions, according to MPI estimates. Between August 15, 2012 and March 31, 2015, approximately 707,000 individuals from Asia and Latin America submitted initial applications for DACA that were accepted for processing (see Table 1). DACA applications are accepted on a rolling basis; the number of those eligible will thus change as individuals age into program eligibility (applicants must be 15 or older) or take action to meet the educational requirements, such as enrolling in school or receiving a General Educational Development (GED) certificate. Overall, MPI estimated in August 2015 that there were 423,000 young unauthorized immigrants from all regions who were under age 15 and could later age into eligibility provided they also met educational criteria, and another 402,000 who appeared to meet all criteria at program launch but for education. This article focuses on the population that appeared to immediately meet all eligibility requirements at the program’s launch.
In 2012, there were more than ten times the number of Latin American individuals who potentially met all eligibility criteria for DACA than Asian individuals: 892,000 vs. 87,000. A significantly lower number of potentially eligible Asians applied for DACA (21 percent) than Latin Americans (77 percent).
Table 1. Potentially Eligible DACA Population and Initial Application Rates by Select Regions, 2015

Notes: Due to limited publicly available U.S. Citizenship and Immigration Services (USCIS) data, the regions include 12 Latin American and four Asian countries. The Immediately Eligible population includes unauthorized immigrants 15 years and older who met the age, year of arrival, continuous presence, and education requirements for the Deferred Action for Childhood Arrivals (DACA) program at its launch in August 2012. Applications Accepted includes the number of initial applications (so, not inlcuding renewal applications) accepted for processing by USCIS as of March 31, 2015. Totals may not add up due to rounding. Percentages are calculated on unrounded numbers and may not match those calculated based on the rounded numbers.
Sources: Migration Policy Institute (MPI) analysis of U.S. Census Bureau 2009-13 pooled American Community Survey (ACS) data, and data from the 2008 Survey of Income and Program Participants (SIPP) by Colin Hammar and James Bachmeier at Temple University and Jennifer Van Hook of The Pennsylvania State University, Population Research Institute; USCIS, "Number of I-821D, Consideration of Deferred Action for Childhood Arrivals by Fiscal Year, Quarter, Intake, Biometrics and Case Status: 2012-2015 (March 31)," available online.
The Influence of Origin and Culture on DACA Participation
Much of the conversation around DACA during the past three years has focused on participation rates. Many community-based organizations, legal service providers, and advocates have found that Asian Americans and Pacific Islanders (AAPIs) have considerably lower participation rates.
Sense of Shame
Stakeholders working in the AAPI and Latino DACA communities have identified several cultural differences that appear to influence DACA participation rates. Jose Diaz, the executive director of Florida Dream in southern Florida, said he has found that Asian populations are less likely to share information about their legal status due to a sense of shame associated with unauthorized status. Similarly, Myrna Orozco, the deputy director for DACA implementation at United We Dream in Houston, said legal status was a “taboo topic” in AAPI communities. She reported a “pushback from [AAPI] families when a youth wants to come out [as unauthorized].” Consequently, she said she has found it difficult to tap into the AAPI DACA-eligible community in Houston when recruiting applicants.
Indian immigrants face heavy stigmas, as going public as unauthorized may mean a loss of status in their community, according to Manju Kulkarni, executive director of the South Asian Network. Additionally, Kulkarni has said that some Indian youth may feel they are putting other unauthorized family members at risk by applying for DACA. Even though Indians are the fastest growing unauthorized population, according to the Department of Homeland Security, only a small subset of Indian youth has applied for DACA.
A similar trend of shame and stigma was also observed in California. Tiffany Panillo, a DACA legal advocate with Asian Americans Advancing Justice (AAAJ) in Los Angeles, observed a hesitancy to talk about DACA —and to apply—among AAPI families. Research by EunSook Lee, former executive director of the National Korean American Service and Education Consortium (NAKASEC), also found a similar hesitancy, as coming forward to seek deferred status tends to raise fear among AAPI families about heightened levels of risk of deportation. According to Ms. Panillo, this reluctance could stem from the fact that many AAPI families did not confide in their origin-country governments, so “asking them to trust this government is a hurdle.”
Lack of Trust and Knowledge
In general, trust in government has been declining in most societies in recent decades. Political trust has declined for both Latin American and Asian countries, according to a survey by political scientists Gabriela Catterberg and Alejandro Moreno. In Argentina, Chile, Mexico, and Peru, confidence in legislative institutions fell on average 26 percentage points between 1981 and 2001. In Asia, South Korea’s decline was even more extreme, falling 57 percent in the same timeframe, compared to a 7 percent decline for Japan. Though the levels of trust in government may vary between countries, political distrust has increased across both Latin American and Asian countries.
Beyond a growing lack of trust in institutions, a knowledge deficit also hampers DACA participation. Basic education is the first tool for motivating participation in DACA or other similar relief programs, and some suggest that AAPI-focused news organizations have not discussed DACA and the role that origin-country embassies and consulates serve in helping their nationals apply. Many DACA-eligible AAPI individuals may be unaware of the benefits of DACA and thus choose not to apply. For this reason, the Embassy of the Philippines in Washington, DC hosted a forum in June 2015 to discuss DACA and the program’s impact on the Filipino community. Similar to efforts by the Mexican Embassy, the Philippine Embassy has launched an awareness campaign and provided free or low-cost legal assistance to interested applicants.
Tiffany Panillo also stressed the importance of media coverage across all cultural groups. “We don’t get a lot of Asians who don’t apply after we tell them more about the program,” she said, adding that in Los Angeles, the Latino population is more comfortable with DACA because the program is more often and openly talked about in Spanish-language media outlets and in their communities.
Political Barriers
Some origin groups, such as Koreans, face potential political barriers to applying for DACA. South Korean constitutional law requires all males ages 19 to 35 to fulfill military service and restricts foreign travel for those over 25 who have not yet completed their service. As such, with some exceptions, South Korean consulate offices in the United States will not renew or extend passports for male applicants ages 18 to 24 beyond January 15 of the year they turn 25, complicating potential DACA applications and benefits, according to the Asian Pacific American Legal Resource Center. Korean DACA beneficiaries who may be evading military service—even unintentionally—face imprisonment if they return to Korea before the age of 43. Separation from family members abroad and the inability to visit their homeland may have thus discouraged Koreans from pursuing a grant of DACA.
Location
Advocates also identified location within the United States as a factor affecting DACA application rates. Although Houston has a significantly larger Latino population, Myrna Orozco said she believes the city is home to one of the largest populations of AAPI DACA-eligible individuals in Texas. (MPI estimates the total unauthorized immigrant population from Asia in Harris County, Texas to be 25,000.) Still, United We Dream has experienced a low turnout of AAPIs at outreach events: “They tend to go to organizations that are more concentrated on the AAPI community.” Consequently, the DREAMer-focused group has been working on building partnerships with more traditional AAPI organizations that have already established relationships with the Houston AAPI community.
The same trend has been observed in California where there are more Latino DACA-eligible youth in Los Angeles, Orange County, and the Inland Empire. AAAJ advertises its services to both Asian and Hispanic groups within the region. Mostly Latino individuals come to outreach events; however, when advertisements are targeted to a specific origin group, such as Koreans, there tends to be a significant turnout from that community. “Partnerships are key when working with hard-to-reach populations,” Ms. Panillo said, adding that trust is an incredibly important tool.
Disparities in DACA Renewals
Despite various types of outreach, overall DACA renewal rates were initially fairly low, with about one-third of beneficiaries submitting renewal requests in the first four months after USCIS opened the renewals process. This data is somewhat problematic to pin down as DACA permits and Employment Authorization Documents (EAD) are awarded on a rolling basis, meaning each individual’s benefits expire two years from the issue date, as opposed to on a single date for all recipients. USCIS encourages DACA beneficiaries to submit renewal applications between 120 to 150 days before their current authorization expires, to allow sufficient processing time. The consequences for those who do not renew within this timeframe are significant, ranging from expiration of the work permit to accrual of unlawful presence. Using the latest publicly available USCIS data, Table 2 displays the number of Asian and Latin American DACA beneficiaries who renewed their applications within the USCIS-suggested timeframe.
Even as AAPI individuals were slower to apply for DACA initially, they have renewed their applications on time more often (87 percent) than their Latino counterparts (83 percent). Renewal rates vary among the countries of origin comprising the Asian and Latin American populations. Of those from Asian countries, nearly 90 percent of South Koreans renewed their DACA grant on time, in comparison to about 75 percent of Pakistani individuals. For the Latin American population, 86 percent of DACA beneficiaries from El Salvador renewed on time, compared to about 70 percent of individuals from Jamaica.
Table 2. DACA Renewal Rates, by Select Countries of Origin, March 2015
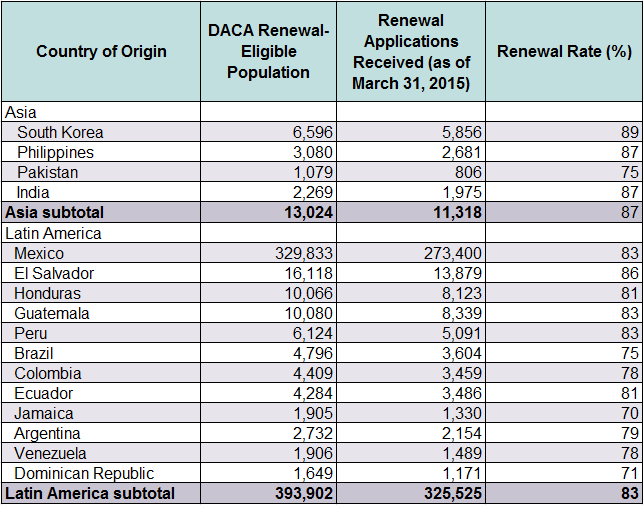
Notes: DACA Renewal-Eligible Population includes initial DACA applications approved by USCIS between August 15, 2012 and July 31, 2013. The two-year DACA permits and Employment Authorization Documents (EAD) issued in this period will have thus expired between August 15, 2014 and July 31, 2015. There may be additional cases pending not considered in these estimates, and could result in an overall increase in these estimates. Renewal Applications Accepted includes the number of DACA renewal applications accepted for processing by USCIS as of March 31, 2015. This timeframe was chosen based on the USCIS-suggested 120- to 150-day renewal window. For initial permits with an expiration date of July 31, 2015, the last day to submit a DACA renewal request on time was April 2, 2015. The estimates for accepted applications do not factor in any felonies, significant misdemeanors, three or more misdemeanors, departures from the Unites States since August 15, 2012 without advance parole, or discontinued residence in the United States since submitting the most recent request for DACA, which could otherwise disqualify applicants from DACA renewals. These estimates are meant to show participation in DACA, regardless of whether or not the renewal applications will be approved.
Sources: MPI analysis of USCIS data; USCIS, “Deferred Action for Childhood Arrivals Process (August, 2013),” available online; USCIS, "Number of I-821D (March 31)."
The Future of DACA
In November 2014, President Obama announced a series of executive actions on immigration, including expansion of the DACA program and a new deferred action program that could provide relief from deportation and work authorization for up to 3.7 million unauthorized immigrants who are parents of U.S. citizens or lawful permanent residents (LPRs) and have lived in the country at least five years. This program is known as the Deferred Action for Parents of Americans and Lawful Permanent Residents (DAPA) program.
DAPA and expanded DACA face a long, uncertain road to implementation with a legal challenge by 26 states currently winding through the courts. It is likely the lawsuit will end up at the Supreme Court, and may not see a ruling until close to the 2016 presidential election or perhaps beyond.
Although there is a substantially smaller number of DACA-eligible Asian and Pacific Islander individuals residing in the United States, and they initially applied for DACA at considerably lower rates, this group is filing for renewal at slightly higher rates than the exponentially larger Latino DACA population. Many theories about the role of culture in motivating participation in DACA derive from personal anecdotes or word of mouth among immigrant activists and service providers. Although these ideas offer an initial hypothesis, further research is needed to better understand differences in application rates of key potential DACA-applicant subgroups.
For more on the DACA population, use this MPI data tool, which offers estimates for the United States, 40 states, and 100 counties with the largest potential DACA populations. The data tool also offers detailed sociodemographic profiles of the DACA population for the United States, 32 states, and 39 counties, including top countries and regions of origin, age, gender, educational attainment, English proficiency, top languages spoken at home, employment, and income. Click here to access the DACA data tool.
Sources
Asian Pacific American Legal Resource Center. 2013. DACA and Conscription in South Korea. August 2, 2013. Available Online.
Catterberg, Gabriela and Alejandro Moreno. 2005. The Individual Bases of Political Trust: Trends in New and Established Democracies. International Journal of Public Opinion Research 18 (1): 1-39.
Chishti, Muzaffar, Faye Hipsman, and Bethany Eberle. 2015. As Implementation Nears, U.S. Deferred Action Programs Encounter Legal, Political Tests. Migration Information Source, February 11, 2015. Available Online.
Chishti, Muzaffar, Faye Hipsman, and Sarah Pierce. 2015. Quick Resolution of Challenge over Obama Administration Deportation Relief Programs is Ever Less Likely. Migration Information Source, June 25, 2015. Available Online.
Diaz, Jose. 2015. Telephone Interview. April 2015.
Embassy of the Philippines. 2013. PH Embassy Launches Campaign to Encourage Filipino Youths to Avail Themselves of US Immigration Breaks. News release, April 12, 2013. Available Online.
---. 2015. Invitation: Deferred Action for the Filipino Community. News release, May 5, 2015. Available Online.
Lee, EunSook. 2014. Increasing Asian American and Pacific Islander DACA Participation: Overview and Grantmaking Recommendations. New York: Unbound Philanthropy. Available Online.
Mathay, Angelo and Margie McHugh. 2015. DACA at the Three-Year Mark: High Pace of Renewals, But Processing Difficulties Evident. Washington, DC: Migration Policy Institute. Available Online.
Migration Policy Institute. Unauthorized Immigrant Population Profiles. Accessed July 17, 2015. Available Online.
Orozco, Myrna. 2015. Telephone interview. April 2015.
Panillo, Tiffany. 2015. Telephone interview. April 2015.
Posner, Eric. 2015. Faithfully Executed: Obama’s new immigration program is perfectly legal and should not be blocked. Slate, February 19, 2015. Available Online.
Sohrabji, Sunita. 2015. White House Asks for Stay on Injunction Barring Relief for Undocumented. India West, February 25, 2015. Available Online.
U.S. Census Bureau. N.d. State & County QuickFacts. Accessed April 16, 2015. Available Online.
U.S. Citizenship and Immigration Services (USCIS). 2013. Deferred Action for Childhood Arrivals Process (August 2013). Washington, DC: USCIS. Available Online.
---. 2015. Number of I-821D, Consideration of Deferred Action for Childhood Arrivals by Fiscal Year, Quarter, Intake, Biometrics and Case Status: 2012-2015 (March 31). Available Online.
---. N.d. Renew Your DACA. Accessed April 16, 2015. Available Online.