

Refugee Resettlement in Metropolitan America

Refugees participate in a class at the Mohawk Valley Resource Center for Refugees in Utica, New York (Audrey Singer).
The United States has a history of providing safe haven to those fleeing oppression and war. Of the 10 countries that carry out resettlement programs, the United States accepts more than double the number of refugees accepted by the other nine countries combined, resettling approximately 2.5 million people since 1975.
Though comprising only 10 percent of annual immigration to the United States, refugees are a distinct component of the foreign-born population in many U.S. metropolitan areas.
Prior descriptions of refugee settlement patterns have been based on widely available state-level data. This is the first report on U.S. metropolitan destinations, where the vast majority of refugees were resettled between 1983 and 2004.
This article examines where refugees come from — documenting significant region-specific flows tied to various overseas conflicts — and where they land, finding that refugee destinations are shifting away from typical immigrant gateways housing large foreign-born populations to newer, often smaller, places.
Linking refugee resettlement to metropolitan areas highlights differences across localities and addresses the implications for service provision and demographic change within receiving areas.
Methodology
Refugees in the United States, unlike asylum seekers who apply for protection after arriving on U.S. soil, are granted permission to immigrate while they are still abroad. This analysis does not include the settlement patterns of asylum seekers who settle once their applications are approved.
The primary data source for this study is a special tabulation of the Worldwide Refugee Application Processing System (WRAPS), obtained from the U.S. Office of Refugee Resettlement (ORR). These records include all refugees who were granted refugee status and admitted to the United States between fiscal years 1983 and 2004. They do not include various classes of entrants under ORR's purview, including Amerasians, and Cuban and Haitian entrants.
|
The data include year of entry, country of origin, and place resettled (city, county, and state) in the United States. All years refer to federal fiscal years (for example 1983 is October 1982 to September 1983), with the exception of 2004, which runs through June of that year. Although the U.S. refugee program predates this period, records that include metropolitan area data are only available for the 1983-2004 period.
Country of origin refers to the country from which the refugee originally fled. Thus, a Somali in a refugee camp in Kenya would be counted under "Somalia."
Over time, some national boundaries have changed, and new countries have formed. For the purposes of this analysis, the former Soviet republics are counted as "USSR" throughout the time period. The former USSR includes the following present-day nations: Azerbaijan, Armenia, Belarus, Estonia, Georgia, Latvia, Lithuania, Kazakhstan, Kyrgyzstan, Moldova, Russia, Tajikistan, Turkmenistan, Uzbekistan, and Ukraine.
Refugees from Bosnia and Herzegovina, Croatia, Macedonia, Serbia and Montenegro, Kosovo, and Slovenia are all included in "Yugoslavia." After 1993, when Eritrea became a separate nation, Eritrean refugees are counted separately from Ethiopians. In total, more than 125 countries are represented in the data.
In this dataset, "place resettled" refers to the location of the local voluntary agency responsible for the initial placement of the refugee. Therefore, the data are presented for the metropolitan area where refugees are first resettled, not necessarily where they reside at the present time.
Data on the place of resettlement (city, state) were aggregated to metropolitan areas, by overlaying the metropolitan area boundaries (as defined by the 1999 Office of Management and Budget Metropolitan Statistical Areas/Primary Metropolitan Statistical Areas ) on the point location of the cities using Geographic Information Systems (GIS). Some records were missing city data, in which case county data were used to determine the metropolitan area.
About 2 percent of refugees were resettled in nonmetropolitan areas, and less than 2 percent were not identifiable. The remaining 95 percent of refugees were resettled in the cities and suburbs of all but two of the 331 metropolitan areas in the United States. In total, 1,575,925 refugees were resettled in metropolitan areas during the period under study.
Refugee Origins
Figure 1 shows the major refugee entries to the United States during the 1983 to 2004 period by region of origin. These 20 years can be broken into three distinct periods, which we characterized by the origins of the refugees admitted to the United States.
Several origin countries dominate the Cold War period, beginning prior to the start of the Refugee Act in 1980 and extending to the dissolution of the Soviet Union in 1991. During this time, large numbers of refugees fleeing communism were welcomed; the largest source of refugees was the USSR (154,630). After the Soviet Union was dismantled, in late-1991, refugee admissions from this region continued but began to decline; by the mid-1990s they were half the number of their 60,000 peak in 1992.
During the long-running Vietnam War, several waves of refugees from Vietnam, Cambodia, and Laos were admitted to the United States. They are grouped together in the Southeast Asian category in Figure 1, and, between 1983 and 1991, the United States admitted between 35,000 to 52,000 each year, for a total of 367,174. Their entry into the United States also preceded the U.S. Refugee Act.
Two events punctuated the Balkans period between 1992 and 2000. Yugoslavia began to break up in 1992, and the United States commenced admitting refugees from its successor states, primarily Bosnia and Herzegovina, but also Serbia and Montenegro (including Kosovo), Croatia, Macedonia, and Slovenia.
In 1998, Kosovar Albanians rebelled against Serbian rule and many fled, eventually becoming refugees entering the United States. Altogether, 146,534 refugees were admitted from the Balkans.
|
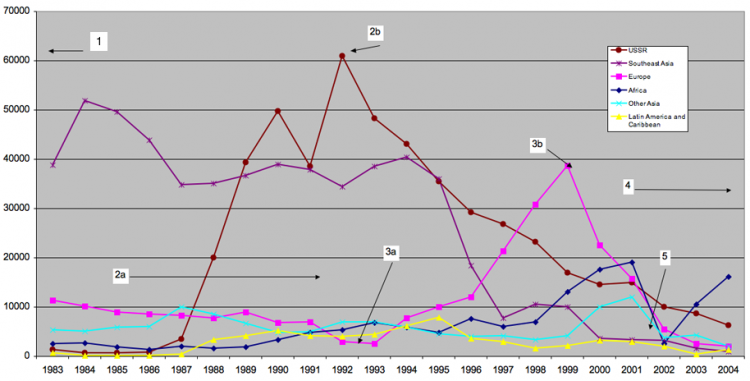
The third period, which we call the civil conflict period and define as the late 1990s to the present, includes refugees from more diverse origins. Due to political and civil clashes on the African continent, Somali, Sudanese, Liberian, and Ethiopian refugees make up the majority of admissions. But another important source is refugees from the category "other Asia," mainly Iran, Iraq, and Afghanistan.
This period includes the attacks of September 11, 2001, which temporarily halted the flow of all refugees into the United States. The number of refugee approvals was curtailed, and admissions, which were already on the decline, still remain below levels prior to the attacks. The ceiling for FY 2007 has been set at 70,000 for refugees from all regions, with 30,000 allotted to Africa.
Refugees have come from more than 125 countries during the period under study and number 1,655,406 in total. Flows are dominated by the nearly half a million refugees from the former Soviet Union and the nearly 400,000 Vietnamese (see Table 1).
Following these two groups, refugees from other countries register much lower numbers. The next two largest groups, the former Yugoslavia and Laos, total nearly 169,000 and 114,000, respectively. These countries are followed by Cambodia (61,000), Iran (52,000), Cuba (48,000), Somalia (35,000), Iraq (35,000), and Ethiopia (35,000).
Romania, Afghanistan, Poland, Sudan, and Liberia had between 20,000 and 35,000 refugee arrivals for the period. Fifteen countries — primarily from Africa and Eastern Europe — each sent between 1,000 and 7,500 refugees to the United States.
|
Settlement in Traditional Immigrant Gateways
The U.S. refugee program aims to disperse refugees throughout the country so as not to place a burden on specific localities or agencies. But the program works first to reunite refugees with relatives and others with ties to anchor them in their new communities and to ease the incorporation process.
Refugees have overwhelmingly been resettled in metropolitan areas with large foreign-born populations. Figure 2 shows the 30 metropolitan areas that have received the largest number of refugees. They represent 73 percent of the total flow of refugees — at the time of their initial settlement, not necessarily where they live now.
|
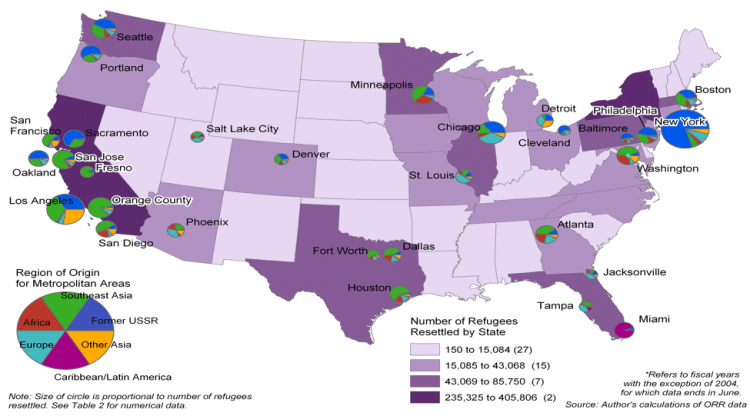
It is not surprising that the largest contemporary immigrant gateways, New York and Los Angeles, have also resettled the greatest number of refugees. However, the refugee source country composition is quite different in each.
Among the 186,522 refugees who were placed in New York during the 1983–2004 period, the vast majority were from the former Soviet Union. The 114,605 refugees settled in Los Angeles comprise a different distribution: Nearly one-third each are from Southeast Asia (lead by those from Vietnam), the former USSR, and "other Asia" (the majority coming from Iran). These refugees provide a striking contrast to the overall foreign-born population in greater Los Angeles, led by Mexican and Central American immigrants.
Following the two largest gateways is Chicago. While Chicago's refugees are weighted toward Europe, there is also a mixture of people who fled oppression in various parts of Asia and the Middle East.
Also notable on this map are the many metropolitan areas in California with large numbers of refugees coming from Southeast Asia. In contrast to New York, Northeastern cities from Boston to Washington, DC, are composed of a more diverse mix of refugee source countries. Washington stands out with one of the largest proportions of African refugees. Minneapolis shares that attribute, and also has a sizable Southeast Asian population.
The refugee population generally mirrors the immigrant population in terms of its geography of settlement, with some important exceptions. The top-three immigrant-receiving metro areas are also the most common places where refugees are resettled, totaling 23 percent of all refugees (see Table 2).
|
Below this rank, the refugee-receiving metro areas do not fall into the expected order based on their total foreign-born populations. The next two metropolitan areas on the refugee scale are Orange County, CA, and Seattle, each with approximately 50,000 refugees resettled during the period under study.
While Orange County is the sixth-ranked metro area in terms of total foreign born, it ranks a comparable fourth on the refugee scale. Contrast this with Seattle, ranked as receiving the fifth-largest number of refugees during the period but ranking only 23rd in the total number of foreign-born residents.
Washington, Boston, San Diego, and Houston host large foreign-born populations and rank high on the refugee list. By comparison, a number of metropolitan areas that took in between 33,000 and 43,000 refugees over the 20-year period "jump rank" when compared to their foreign-born ranking of metropolitan areas.
Five of these places (Seattle, San Jose, Minneapolis-St. Paul, Sacramento, and Portland, OR) have been identified as reemerging immigrant gateways. These are areas that last received large numbers of immigrants in the early part of the 20th century. The arrival of refugees partly explains the resurgence in the size of their foreign-born populations in the 1990s.
Many places receiving a sizeable number of refugees were not necessarily ranked near the top for foreign-born population. For instance, St. Louis was number 60 on the foreign-born population list but 21st on the refugee list, owing largely to the influx of Bosnian refugees. Similarly, Portland is the 12th-largest receiver of refugees but in 2000 was ranked only 31st among all metropolitan areas for its foreign-born population.
Settlement in Newer Immigrant Gateways and Nongateways
The leading refugee destination metro areas have shifted away from traditional immigrant gateways over the past two decades, and newer gateways are resettling proportionally more refugees.
Table 3 shows the sequencing of settlement within metropolitan areas grouped by the "decade" in which they arrived in the United States. The data are truncated in both the 1980s (due to data limitations) and the 2000s (since we are only midway through the decade). However, these decadal periods roughly correspond to the three periods of refugee flows outlined in the first finding above, i.e., the Cold War period, the Balkans period, and the civil conflict period.
The patterns observed in Table 3 show the waxing and waning of metropolitan areas as recipients of refugees over the past 20 years. New York and Los Angeles clearly dominated during the Cold War and Balkans periods of the 1980s and 1990s, followed by Chicago.
|
However, the 2000s portend a more dispersed trend. Large metropolitan areas, such as Seattle, Minneapolis-St. Paul, Atlanta, Sacramento, and Portland, are taking in an increasing number of refugees in the current period. About 20 percent of refugees resettled since 2000 have gone to one of these five areas. In the Cold War and Balkans periods, these five metropolitan areas garnered only 9 percent and 13 percent, respectively.
During the same time, the top-four receivers (Los Angeles, New York, Chicago, and Orange County) collectively dropped from resettling 30 percent of all refugees in the first and the second period, to only 14 percent during the current civil conflict period.
This is relevant for a host of integration issues, as the periods of refugee resettlement roughly correspond to the regional origins of the refugees themselves, their specialized needs, and the context of reception in the communities that host them.
Overall, however, New York and Los Angeles have received more refugees than any other place during the entire period, with 12 percent and 7 percent, respectively. Also, they are clearly dominant among all metropolitan areas in the 1980s and 1990s. Chicago's refugees make up only 4 percent of all refugees resettled in the United States for the entire period, but that metro area has maintained the same proportion of the total in each decade.
In the 1980s — at least according to the data available — Los Angeles' share of refugees at 13 percent exceeded New York's 9 percent. In the 1990s, New York resettled more than three times the number of refugees of any other metropolitan area (15 percent of the total), but by the 2000s, the proportion had dropped to 5 percent of the total (although this was still a larger share than any other metro area). Altogether, in the 1990s, one in seven refugees landed in the New York metropolitan area.
Below these top three metropolitan areas, there is substantial variation in the metropolitan share of incoming refugees by decade. For example, fourth-ranked Orange County —contiguous with Los Angeles — starts off the 1980s with 4.1 percent of all refugees, drops to 3.4 percent in the 1990s, finally decreasing to less than 1 percent of all refugees resettled in the current decade.
Seattle — fifth on the list overall — gains over time, with 2.6 percent of all refugees in the 1980s, 3.1 percent in the 1990s, and 4 percent in the 2000s. Other metropolitan areas that follow a similar pattern of resettling an increasing percentage of the total over time are Minneapolis-St. Paul, Atlanta, Sacramento, Portland (OR), Phoenix, and St. Louis.
Again, many of these metro areas registered rapid foreign-born growth in the 1990s according to U.S. Census Bureau data, contributing to an emergence or reemergence of some of these places as immigrant gateways. Among those decreasing their proportion of the total are San Jose, Boston, San Diego, and San Francisco, all fairly established immigrant gateways.
The changes in the number by decade are particularly meaningful when recalling the changes in origin patterns by decade. Whereas Orange County for many years resettled large numbers of Southeast Asian refugees, there are fewer refugees arriving in the current decade, the one marked by new arrivals from Africa. Portland by contrast, has seen an upswing in the 1990s and 2000s, as refugees from the Balkans and Africa have arrived.
Refugees dominate the overall foreign-born population in a number of medium-sized and small metropolitan areas such as Fargo, ND; Erie, PA; Sioux Falls, SD; and Binghamton, NY. These areas are not necessarily attracting other immigrants, yet they play a featured role in the national refugee resettlement process.
Utica, NY; Des Moines, IA; Springfield MA; Spokane, WA; Tacoma, WA; and Lincoln, NE, each resettled refugees in the 1990s with numbers on par with much larger areas like Milwaukee, WI; Nashville, TN; St. Louis, and Riverside-San Bernardino, CA. Furthermore, refugees have played an important role in helping to staunch population decline in many of these metropolitan areas.
Refugee Hubs
Refugees from similar origins often locate in particular metropolitan areas. As mentioned earlier, this is partly by design.
In addition, voluntary agencies often specialize in placing refugees from specific backgrounds, thus many areas experience a kind of chain migration with immigrants arriving to join their refugee kin. Even when there is no preexisting community, local areas receiving refugees during discrete periods of time tend to host specific groups.
Sometimes the placement of too many refugees in one area has overwhelmed local communities or stirred tension. Other areas feel unprepared for additional refugees, lacking either political or public backing, or the capacity to provide services.
Some places stand out as particular destinations for specific groups (see Table 4). More than half of all refugees from the former USSR, the largest group, were resettled in five metropolitan areas, with New York absorbing nearly one-third of the total and three West Coast metro areas and Chicago receiving another 22 percent.
|
Refugees from Iran and Cuba also were highly concentrated. Almost half of Iranian refugees were resettled in the Los Angeles metropolitan area, followed by smaller proportions going to New York and Washington on the East Coast and San Jose and Modesto on the West Coast. Those five metropolitan areas absorbed nearly two-thirds of all Iranian refugees.
Similarly, more than half of all Cubans were resettled in Miami, joining a large existing Cuban community, and fully 70 percent landed in just five metropolitan areas.
Refugees from other sending nations were more geographically dispersed in their initial settlement. The second-largest refugee group, from Vietnam, falls into this category. While more than 39,000, or nearly 11 percent, were resettled in Orange County, both Los Angeles and San Jose also received about 8 percent of the total, and Houston and Washington, DC received nearly 5 percent and 4 percent, respectively.
Laotian and Cambodian refugees were similarly dispersed; however, Laotian refugees were most likely to go to Fresno or Minneapolis-St Paul, and Los Angeles topped the list for Cambodians. These groups had virtually no communities in the United States prior to the late 1970s, so their distribution is a result of fewer ties to relatives in the United States at the time of arrival.
Five metropolitan areas together received approximately 27 percent of all refugees from the former Yugoslavia, with the Midwestern metros of Chicago and St. Louis accepting more than 23,000, or 15 percent of the total.
Notably, nearly one in five Iraqi refugees arrived in Detroit, and another 9 percent went to Chicago.
Among refugees from the African continent, those from Somalia stand out with almost 50 percent resettled in just five metropolitan areas: Minneapolis-St. Paul (14 percent), Washington, DC (10 percent), Atlanta and Chicago (9 percent each) and Seattle (4 percent).
Ethiopians were more spread out upon arrival but have since settled in many of the same places. Nearly 10 percent each of Ethiopian refugees were resettled in Washington and Minneapolis-St. Paul; San Diego, Atlanta, and Dallas received another 6 percent each.
Conclusion
More than 25 years after the U.S. Refugee Act was passed, more than 2 million refugees have been resettled across communities in the United States. Metropolitan areas, where refugees have their first brush with America, serve as the immediate context for their initial encounters with U.S. culture, lifestyle, institutions, and bureaucracies.
But metropolitan areas are not monolithic; they represent diverse settings where the social, cultural, and economic incorporation of refugees unfolds. In major gateways, such as New York, Los Angeles, and Chicago, where immigrants are plentiful and dispersed around the metropolitan area, refugees comprise a small proportion of the larger foreign-born mix.
These kinds of places have experience in incorporating large and steady streams of the foreign born, especially in schools and the labor force. Refugees may benefit from the broader immigration dynamic, and their integration in these contexts may be quite different from those areas with low levels of immigration.
In other metropolitan areas, including those with few recent immigrants, such as St. Louis and Baltimore, or smaller places like Utica, Des Moines, and Spokane, refugees have a potentially larger impact on local economies and neighborhoods.
Because refugees begin their new lives in the United States relying upon organizations to assist them with basic needs such as housing, workforce readiness, and English-language learning, they are often more visible in smaller metropolitan areas and can represent the public's primary encounter with immigration in these communities.
Unlike other immigrants, refugees have access to considerable federal, state, and local support to help them succeed economically and socially. Affordable housing, health care access, job training and placement, and language learning dominate the local service needs that need to be built and maintained.
Ultimately, metropolitan areas are the critical context for refugees as they settle into communities and become active members of their neighborhoods, schools, and workplaces.
This article is based on Audrey Singer and Jill H. Wilson, "From 'There' to 'Here': Refugee Resettlement in Metropolitan America," (The Brookings Institution 2006), available online. The research was funded by Living Cities: The National Community Development Initiative (www.livingcities.org).
Sources
Office of Refugee Resettlement. 2004. Report to the Congress FY 2004. Available online.
Newland, Kathleen. 1995. "Impact of U.S. Refugee Policies on U.S. Foreign Policy: A Case of the Tail Wagging the Dog?" in Teitelbaum, Michael S. and Myron Weiner (eds.) Threatened Peoples, Threatened Borders: World Migration and U.S. Policy. New York: The American Assembly.
Noll, Gregor and Joanne van Selm. 2003. "Rediscovering Resettlement." Washington DC: Migration Policy Institute.
Singer, Audrey. 2004. "The Rise of New Immigrant Gateways." Washington, DC: The Brookings Institution. Available online.