

South-South Migration and Remittances
By a rough estimate, in 2005, two of every five migrants on the globe — some 78 million out of 191 million migrants — were residing in a developing country. Most of these migrants are likely to have come from other developing countries.
However, the extent of migration between developing countries, called South-South migration, and the issues surrounding it remain poorly understood, largely because data on migration in developing countries are incomplete and unreliable.
Here we report preliminary results on the levels of South-South migration and try to estimate South-South remittance flows and their costs. The countries of the South are those the World Bank classifies as low- and middle-income countries; the countries of the North are the high-income countries. These definitions are narrower than those that the United Nations and other organizations use.
The Extent of South-South migration
According to the United Nations, the global stock of international migrants has more than doubled over the past 40 years. Although the stock, as a share of population, is estimated to have remained flat at around 1.5 percent, the number of migrants in the South may have increased by about 75 percent (see Figure 1).
The rise is due in part to a one-time jump in officially recorded migrants that followed the breakup of the Soviet Union. At that time, what had been internal migration within the Soviet Union was reclassified as international migration. The breakup also increased absolute levels of migration, as many people moved to the country with which they identified.
|
|
||
|

Including migrants from the former Soviet Union, migration to the South accounted for 41 percent of worldwide migration, estimated at 191 million in 2005. When the former Soviet Union is excluded, this share falls to 32 percent.
One would expect to find that a large share of the migrants in developing countries are from other developing countries, as workers in industrial countries typically move to developing countries only to take up short-term, specialized positions, or, in some cases, for retirement. Empirical estimation on the extent of migration between developing countries, however, requires data on bilateral migrant stocks (e.g., migrants from country A in country B and vice versa) that are not readily available.
The figures reported below are derived from an augmented and updated bilateral migration matrix originally created by the University of Sussex (for the Global Trade Analysis Project). This database uses national censuses, population registers, national statistical bureaus, and a number of secondary sources to compile bilateral migrant stocks for 162 countries.
We have updated the information on bilateral migrant stocks for 56 countries using the most recent census data. This exercise considerably improves the coverage of migrants in developing countries. Also, since the purpose is to estimate South-South migration (and not necessarily to estimate detailed bilateral data for every country), we allocated unidentified migrants to only two broad categories, "other South" and "other North," thus avoiding stringent assumptions.
Despite weaknesses that include differing definitions of "migrants," lags in reporting census data, and underreporting of irregular migration, the updated database is the most comprehensive source available for estimating South-South migration.
Examination of this database suggests that South-South migration may account for 47 percent of all migration originating in the South (see Table 1), or 74 million migrants (the true size is likely to be even greater than 74 million as these data do not fully capture irregular migration). The South's share drops to 38 percent if migrants in the former Soviet Union are excluded. The latest data also reveal that the number of North-North migrants is about 31 million (or 16 percent of global migration).
This estimated 47 percent share is comparable to, although slightly smaller than, the 50 percent share the World Bank estimated in 2005 using a previous version of the University of Sussex database. The United Nations Population Division (UNPD) also estimates that half of the migrants from developing countries migrate to other developing countries, again using the same database.
|
|
||
|

Only about two in five migrants from developing countries reside in the high-income countries of the Organization for Economic Cooperation and Development (OECD). Some 20 million (or 13 percent) are estimated to reside in high-income countries outside the OECD — among them Hong Kong (China), Saudi Arabia, Singapore, and the United Arab Emirates (see Table 1).
South-South migration is at least as great as South-North migration in three of the six developing regions. South-South migration is estimated to account for half of all outward migration from South Asia, 64 percent from Europe and Central Asia (although a portion of these people never crossed international borders but became "migrants" after the breakup of the Soviet Union and the formation of new countries), and 69 percent from Sub-Saharan Africa (see Figure 2 and Table 2).
|
|
||
|

|
|
||
|

In addition, South-South migration is overwhelmingly intraregional. The share of migration to other developing regions is likely negligible in all regions except in South Asia. Even in South Asia, intraregional migration is estimated to be more than three times more common than migration to countries in other developing regions (see Figure 2).
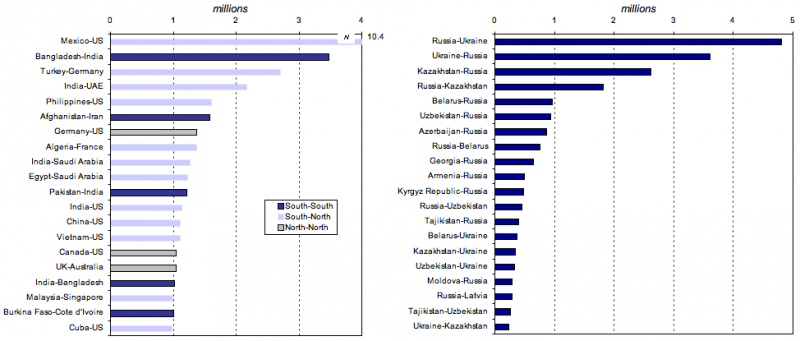
Although data on bilateral migration are incomplete for many countries, available data reveal that some of the largest migration corridors are in the South. After the Mexico-United States corridor, the next three largest are estimated to be Russia-Ukraine, Ukraine-Russia, and Bangladesh-India (see Figures 3a and 3b).
Many of these large migration corridors emerged due to the partitioning of countries. When such corridors are excluded, the largest of the remaining corridors are not all South-North — some are North-North, others South-South. India, Russia, and South Africa are well-known as receiving countries in the South. But, as shown in Figure 3a, migration is widespread. The many lesser-known receiving countries include Iran and Cote D'Ivoire.
|
Figure 3b. Top 20 Migration Corridors in the Former Soviet Union |
||
|
South-South Remittances
According to the latest available World Bank data, officially recorded remittance flows to developing countries reached $188 billion in 2005 and approached $200 billion in 2006. The true size of these flows, taking into account unrecorded flows through formal and informal channels, is believed to be at least 50 percent larger.
Like bilateral migration data, data on bilateral remittance flows are not readily available. To estimate South-South remittances, therefore, we devised three simple formulas to allocate to various source countries the recorded remittances each developing country received.
The first formula, a simplistic allocation scheme, assumes that a country's remittance receipts from various source countries are proportional to its migrant stocks in those countries. On this basis, South-South remittances would amount to $55.4 billion, or 29.5 percent of recorded remittances received by developing countries in 2005. This estimate of South-South remittances is smaller than that of South-South migration because some of the top remittance-recipient countries (e.g., Mexico) have a smaller share of their migrants in the South than in the North.
However, this allocation rule assumes that all migrants send the same amount of remittances irrespective of their income differences. Such an assumption clearly will overestimate remittances from the South, where per capita income levels are much lower than in the North.
The second formula uses migrants' income levels as weights (using as a proxy per capita income in purchasing power terms in the destination country multiplied by the number of migrants) to allocate remittance receipts to various country sources. In this case, the estimate for South-South remittances drops to $17.5 billion, or 9.3 percent of total remittances received by developing countries.
However, this formula overestimates North-South remittances at the expense of South-South remittances, because it implies that migrants send a fixed fraction of their income irrespective of their income level and with no consideration for the actual needs of their beneficiaries.
The third formula hypothesizes that the amount an average migrant sends increases with the migrant's income but at a decreasing rate. Ideally, the migrants' income should be taken from household survey data; but, in the absence of such data, we use per capita gross national income (GNI) as a proxy for the migrant's income abroad.
This assumption poses some difficulties in cases involving migration to a country where the per capita income is lower than in the origin country. In such cases, we assume that the minimum remittance is at least as much as the per capita income of the origin country. That formula yields an estimate for South-South remittances of about $34.3 billion, or 18.2 percent of total remittances developing countries received in 2005 (see Table 3).
|
|
||
|

The estimates based on this third formula are arguably closer to reality than the other two. In future work, a more general formulation that postulates remittance as a function of skills and poverty level, and differentiates between voluntary and nonvoluntary migration, may be more realistic.
South-South Remittance Costs
High remittance costs are a major drain on the incomes of poor migrants. High costs and lack of access to convenient remittance services encourage migrants to use informal channels. Reducing remittance costs, therefore, has emerged as a major concern for policymakers.
Since little is known about the cost of sending remittances from one developing country to another, we telephoned remittance service providers in selected South-South, South-North, and North-South remittance corridors; we asked for the fee for sending $200 and the foreign-exchange conversion charges at both ends. This research indicates that fees tend to be higher for South-South remittances than for North-South remittances (see Figure 4).
|
|
||
|

It is often impossible to send remittances from one developing country to another through formal channels because of restrictions on outward remittances in the source country. Some countries (Bangladesh, India, Lesotho, and Morocco, among others) require migrants to obtain authorization before the central bank will process international remittances. In many countries, inward remittances also have to be reported to the authorities.
Often, remittance fees vary significantly in the same bilateral corridor depending on the direction of the flow. For example, the cost of remitting $200 from Kuala Lumpur to Jakarta is about 6 percent, whereas that cost from Jakarta to Kuala Lumpur is more than 13 percent. Similarly, the cost of sending money from Kiev to Moscow is more than double the cost of remitting in the reverse direction (see Figure 4).
South-South remittance costs tend to be high because of lack of competition in the remittance market in both the sending and the receiving countries. Also, high foreign-exchange commissions generally have to be paid at both ends, as the sender must purchase U.S. dollars (or another readily convertible currency) and the beneficiary must be paid in the currency of his or her country. Usually the sender has very little information about the exchange rates the remittance company applies at either end of the transaction.
Reducing costs is as important a policy imperative for South-South remittances as for North-South remittances. The same strategies suggested for North-South remittances also pertain to South-South remittances: lifting exchange controls on small outward remittances, and fostering competition in the remittance market by encouraging banks, microfinance institutions, credit unions, and post office saving banks to offer remittance services and to share existing payment platforms and networks. Also, exclusive partnership arrangements between major money transfer operators and post office networks should be avoided.
Conclusion
Given the preliminary nature of this work, further research is planned to refine the estimates of migration stocks and remittance flows. Nevertheless, we have sufficient information to suggest some broad conclusions about the nature of South-South migration.
First, our current estimates indicate that 74 million, or nearly half, of the migrants from developing countries reside in other developing countries. However, this estimate is likely to be low, as the official data tend to undercount irregular migrants. Irregular migration is probably even more common in South-South than South-North migration because of tight restrictions on immigration in many developing countries, coupled with limited enforcement, the high cost of travel documents, and unclear immigration rules in the South.
Second, estimates of South-South remittances range from 9 to 30 percent of developing countries' remittance receipts, or between $18 billion and $55 billion in 2005, depending on the allocation rule chosen to estimate bilateral flows. The amounts would be higher if flows through informal channels were taken into account.
Third, the costs of South-South remittances (where such remittances are permitted) are even higher than those of North-South remittances, because of lack of competition in the remittance market, a lack of financial development in general, and high foreign-exchange commissions at both ends of the transaction.
Coming in October: Part II - The Determinants of South-South Migration and Its Socioeconomic Impacts
This two-part series is based on World Bank Working Paper No. 102, "South-South Migration and Remittances." For the full paper (in PDF format), click here.