

Spotlight on Naturalization Trends in Advance of the 2008 Elections
Source Spotlights are often updated as new data become available. Please click here to find the most recent version of this Spotlight.
Becoming a U.S. citizen has been long regarded as a significant indicator of immigrants' integration into U.S. civic and political life.
Beginning October 1, 2008, immigrants who wish and are eligible to become U.S. citizens will have to take a revised citizenship test. The new test was created to ensure that future citizens have a good understanding of U.S. history and civic values, as well as English language skills.
This Spotlight examines the foreign born age 18 and older who became U.S. citizens (i.e., naturalized) in 2006, the latest year for which data are available. It also highlights some of the trends surrounding naturalization since the 1970s.
The Spotlight draws on a number of sources: the 2006 American Community Survey, the Department of Homeland Security's Office of Immigration Statistics (OIS) Annual Flow Report, and online OIS tables on newly naturalized citizens.
Note: all references for annual data from DHS are for the government's fiscal year (October 1 through September 30); otherwise they refer to the calendar year.
Click on the bullet points below for more information:
Definitions | ||
|
- There were nearly 15.2 million naturalized citizens eligible to vote in the United States in 2006.
- Hispanics accounted for almost a third of all naturalized citizens.
- In California, 19 percent of citizens age 18 and older were foreign born.
- A July 2002 executive order made noncitizen members of the armed forces eligible for expedited U.S. citizenship.
- Asian and European immigrants have the highest naturalization rates while Mexican immigrants have one of the lowest.
- More than 700,000 lawful permanent residents became U.S. citizens in 2006.
- In 2006, U.S. Citizenship and Immigration Services denied 120,722 naturalization petitions.
- Between 1997 and 2006, over 6.3 million people became naturalized citizens, more than one-and-a-half times the 3.8 million who naturalized between 1987 and 1996.
- The increased number of naturalizations since 1994 is partly a result of the legalization of unauthorized immigrants under the 1986 Immigration Reform and Control Act (IRCA).
- In 2006, foreign born from Mexico, the Philippines, and India accounted for almost a quarter of all naturalizations.
- Almost half of those who naturalized in 2006 lived in three states: California, New York, and Florida.
- The state with the fewest naturalizations in 2006 was Wyoming.
- Of the 84,000 Mexican foreign born naturalized in 2006, the largest groups resided in California, Texas, and Illinois.
- The New York, Los Angeles, and Miami metropolitan areas were home to more than one-third of new U.S. citizens.
- In 2004, an estimated 8 million lawful permanent residents were eligible for naturalization.
- For immigrants who naturalized in 2006, the median time between date of legal immigration to the United States and date of naturalization was seven years.
There were nearly 15.2 million naturalized citizens eligible to vote in the United States in 2006.
According to 2006 ACS estimates, there were 15,164,752 naturalized citizens age 18 and older in the United States eligible to vote. They accounted for 7.3 percent of all persons eligible to vote (206,328,748).
Note: "Eligible to vote" does not mean that citizens are registered to vote or take part in local, state, or national elections. It only means they have U.S. citizenship and are of voting age.
Hispanics accounted for almost a third of all naturalized citizens.
Of the 15.1 million naturalized citizens age 18 and older, 31.2 percent (4,737,157) are of Hispanic or Latino origin. They accounted for 26.4 percent of all Hispanic citizens eligible to vote (17,975,043).
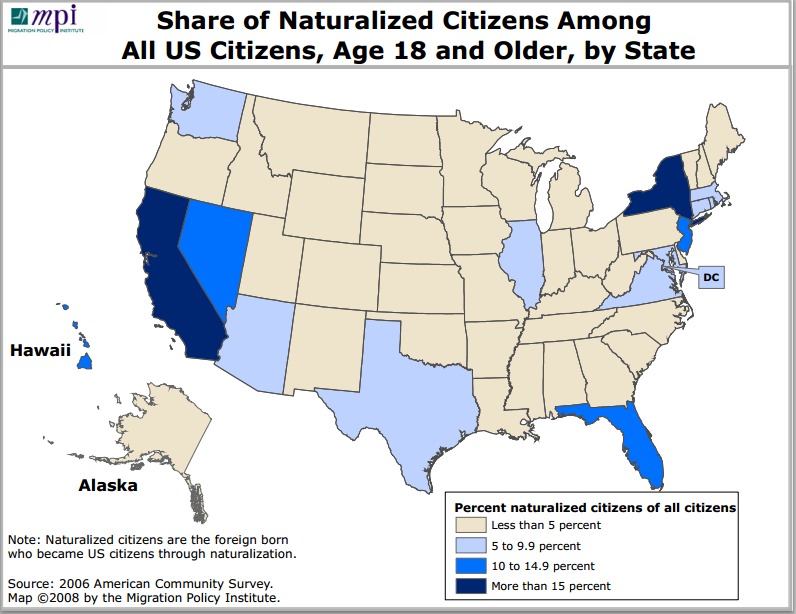
In California, 19 percent of citizens age 18 and older were foreign born.
In 2006, 19.0 percent (4,151,339) of citizens age 18 and older residing in California and 16.1 percent (2,082,559) in New York were naturalized citizens (see Map 1). In four more states, naturalized foreign born accounted for 10 or more percent of all citizens — New Jersey (14.2 percent or 822,883), Hawaii (12.8 percent or 116,205), Florida (12.1 percent or 1,501,771), and Nevada (10.5 percent or 166,924).
A July 2002 executive order made noncitizen members of the armed forces eligible for expedited U.S. citizenship.
Section 329 of the Immigration and Nationality Act authorizes the president to issue executive orders specifying periods of conflict during which foreign-born members of the U.S. military are eligible for immediate U.S. citizenship.
In a July 2002 executive order, President George W. Bush specified that such a period of hostilities began after September 11, 2001, and that foreign-born, noncitizen military personnel serving on or after that date were thus eligible for expedited citizenship. During times of peace, noncitizen armed forces members may obtain citizenship after a one-year waiting period.
For more information about the foreign born in the U.S. military, see the January 2007 Spotlight on The Foreign Born in the Armed Services.
Asian and European immigrants have the highest naturalization rates while Mexican immigrants have one of the lowest.
According to a DHS study of naturalization trends between 1973 and 2005, among Asian immigrants who became lawful permanent residents (LPRs) in the United States between 1990 and 1995, approximately 60 to 65 percent became naturalized U.S. citizens by 2005. Among European immigrants, 50 to 60 percent became citizens.
In contrast, among Mexican immigrants who became LPRs in the United States between 1990 and 1995, a smaller share — 20 to 30 percent — became naturalized U.S. citizens by 2005. Mexican immigrants have historically had lower naturalization rates than other immigrant groups for a variety of reasons, including limited English skills and low perceived value of having U.S. citizenship.
Note: The full report "Trends in Naturalization Rates" is available here.
More than 700,000 lawful permanent residents became U.S. citizens in 2006.
In 2006, U.S. Citizenship and Immigration Services (USCIS) naturalized 702,589 lawful permanent residents, 16.3 percent more people than were naturalized in 2005 (604,280). The 702,589 newly naturalized citizens represent about 2 percent of the total U.S. foreign-born population of 37.5 million according to 2006 ACS estimates.
In 2006, U.S. Citizenship and Immigration Services denied 120,722 naturalization petitions.
The 120,722 applicants whom USCIS denied citizenship received denials for one or more of the following reasons: applicant could not prove five years of permanent residence in the United States; applicant was determined to lack allegiance to the United States; applicant was determined to have bad moral character; or applicant failed the English language or American civics test.
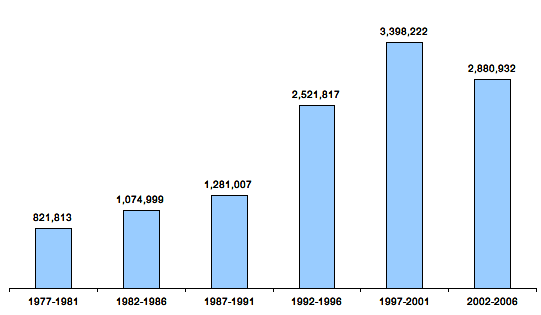
Between 1997 and 2006, over 6.3 million people became naturalized citizens, more than one-and-a-half times the 3.8 million who naturalized between 1987 and 1996.
The number of individuals naturalized between 1997 and 2006 (6,279,154) increased 1.7 times from the 1987-1996 period (3,802,824) (see Figure 1).
|
The increased number of naturalizations since 1994 is partly a result of the legalization of unauthorized immigrants under the 1986 Immigration Reform and Control Act (IRCA).
Under IRCA, 2.7 million unauthorized immigrants received lawful permanent resident status. This increased the pool of foreign born eligible for naturalization.
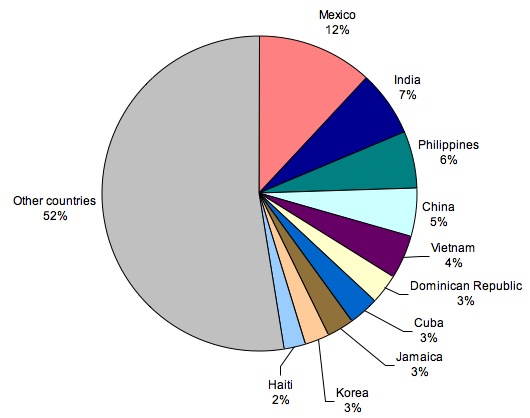
In 2006, foreign born from Mexico, the Philippines, and India accounted for almost a quarter of all naturalizations.
Of those naturalized in 2006, 12.0 percent were born in Mexico (83,979), 6.8 percent in India (47,542), and 5.8 percent in the Philippines (40,500) (see Figure 2).
According to ACS 2006, of the 37.5 million foreign born in the United States, 30.7 percent were from Mexico (11,541,404), 4.4 percent were from the Philippines (1,638,413), and 4.0 percent were from India (1,519,157).
|
Back to the top
Almost half of those who naturalized in 2006 lived in three states: California, New York, and Florida.
Of the 702,589 new citizens in 2006, 21.8 percent lived in California (152,836), 14.8 percent in New York (103,870), and 12.9 percent in Florida (90,846) (see Table 1).
|
The state with the fewest naturalizations in 2006 was Wyoming.
In Wyoming, 169 lawful permanent residents naturalized in 2006. The next-lowest numbers of naturalizations were in Montana (225), North Dakota (329), South Dakota (342), West Virginia (390), and Mississippi (495).
Of the 84,000 Mexican foreign born naturalized in 2006, the largest groups resided in California, Texas, and Illinois.
Almost half of the 83,979 Mexican foreign born naturalized in 2006 resided in California (45.5 percent or 38,210), while 15.2 percent were in Texas (12,796) and 7.9 percent were in Illinois (6,675).
The New York, Los Angeles, and Miami metropolitan areas were home to more than one-third of new U.S. citizens.
Approximately 19 percent of all those who naturalized in 2006 lived in the greater New York metropolitan area (132,326), 9.4 percent lived in the greater Los Angeles metropolitan area (65,813), and 9.1 percent lived in the greater Miami metropolitan area (63,623).
These metropolitan areas — together with the Chicago (4.1 percent or 29,047), Washington, DC (3.8 percent or 26,462), San Francisco (3.4 percent or 24,042), and Boston (2.6 percent or 18,585) metropolitan areas — were home to 51.2 percent of the individuals who became U.S. citizens in 2006.
In 2004, an estimated 8 million lawful permanent residents were eligible for naturalization.
According to the latest available OIS estimates, there were 8 million lawful permanent residents LPRs eligible to naturalize in 2004. They included 2.3 million (29.3 percent) LPRs in California, 1.1 million (13.6 percent) in New York, 800,000 (9.9 percent) in Texas, and 600,000 (7.8 percent) in Florida.
Note: The full report "Estimates of the Legal Permanent Resident Population and Population Eligible to Naturalize in 2004" is available here.
For immigrants who naturalized in 2006, the median time between date of legal immigration to the United States and date of naturalization was seven years.
Among persons who became U.S. citizens in 2006, the median number of years of residence between the date of legal immigration and the date of naturalization was seven years.
Between 2000 and 2005, the median number of years of residence prior to naturalization was eight years. This decrease may be due to faster application processing, as well as to changes in the demand for naturalization.
Note: The full report "Naturalizations in the United States 2006" is available here.