
U.S. Unemployment Trends by Nativity, Gender, Industry, & More, Before and During Pandemic
As the United States went into lockdown beginning in March 2020 to contain the spread of the coronavirus, tens of millions of workers lost their jobs within weeks, particularly in sectors that require face-to-face interaction. Employment rebounded, not always in linear ways across sectors.
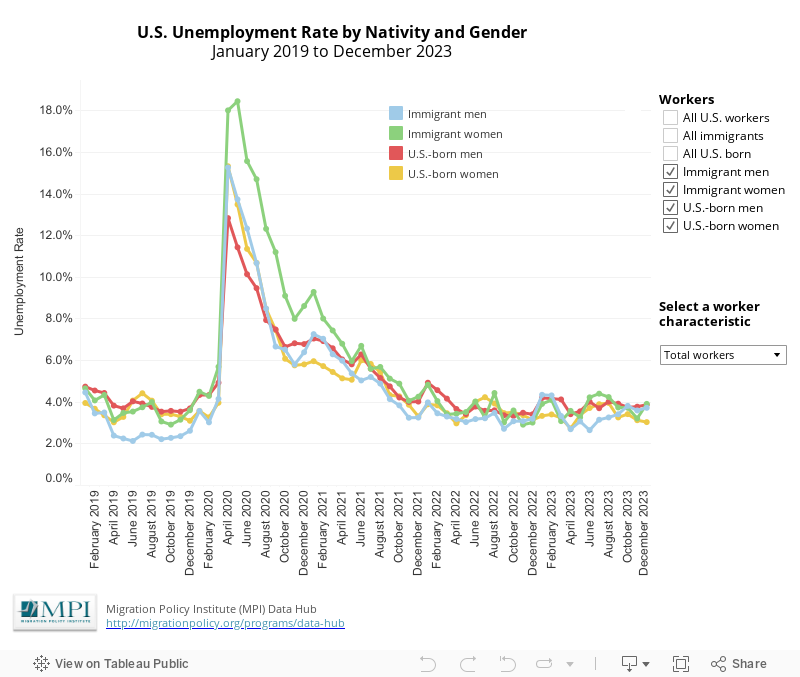
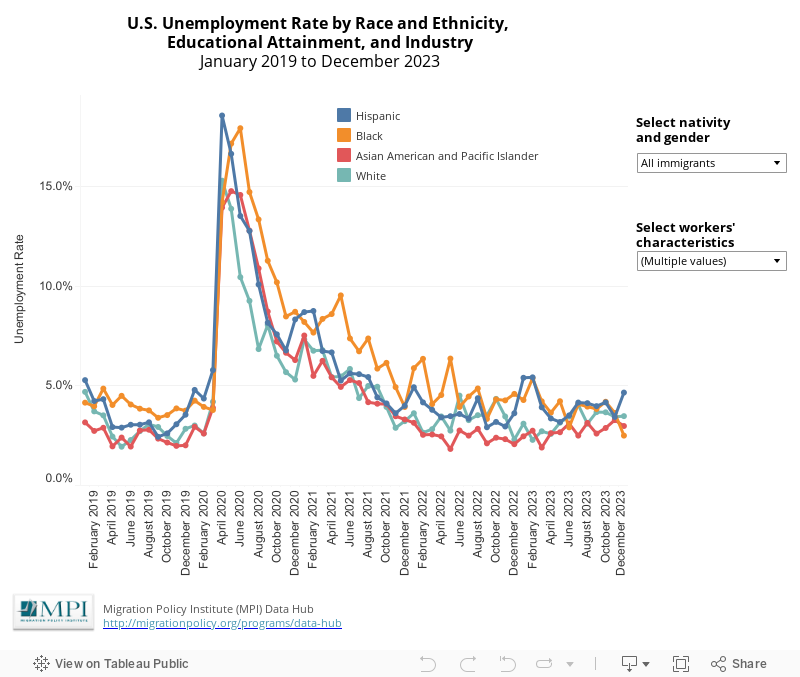
Use the two interactive data tools below to track trends in unemployment since January 2019 for U.S.-born and immigrant workers by gender, race/ethnicity, educational attainment, and industry. Although the two tools capture the same information, they display unemployment rates through different lenses. The first allows the user to compare unemployment rates by nativity and gender within racial/ethnic and educational attainment groups, and within industries of employment. (For example, compare the unemployment of Black immigrant men and Black native-born men within the professional services industry). The second tool allows comparison of unemployment rates by race/ethnicity, educational attainment, and industry for one nativity and gender group at a time: for instance, Latina immigrants and Asian American and Pacific Islander immigrant women, or immigrant men across various industries.
For notes and sources, please see below second data tool.
Definitions
-
Nativity: The term "immigrants" refers to people residing in the United States at the time of the population survey who were not U.S. citizens at birth. The immigrant population includes naturalized U.S. citizens, lawful permanent immigrants (or green-card holders), refugees and asylees, certain legal nonimmigrants (including those on student, work, or certain other temporary visas), and persons residing in the country without authorization. The term "U.S. born" refers to people residing in the United States who were U.S. citizens in one of three categories: people born in one of the 50 states or the District of Columbia; people born in U.S. territories such as Puerto Rico or Guam; or people who were born abroad to at least one U.S. citizen parent.
-
Race and Ethnicity: Latinos can be of any race, and all other listed racial/ethnic groups are non-Latino. Black refers to persons who reported their race as "Black alone" or "Black in combination with other race." Asian American and Pacific Islander (AAPI) refers to persons who reported their race as "AAPI alone" or "AAPI in combination with other race," except Black. White refers to persons who reported their race as "White." The remainder is a small group called "other races," which includes people who reported their race as “American Indian alone,” “American Indian and White,” or unspecified multiracial. Estimates for the “other races” group are not shown due to the small sample sizes.
-
Industries: The above tools show data for 12 major industry groups. “Health services” include nursing and residential care facilities; “financial activities” include finance, insurance, real estate, and rental and leasing; “leisure and hospitality” include arts, entertainment, recreation, restaurants, bars, hotels, and other accommodations; “professional and business services” include professional, scientific, management, administrative, and waste management services, as well as the information and communications industry.
Data-Related Notes
-
The unemployment rate is the number of unemployed people as a percentage of the civilian labor force, where the latter consists of employed and unemployed persons. Estimated unemployment rates by race/ethnicity and industry group are based on the civilian noninstitutional population ages 16 and older. Estimates by educational attainment are based on the civilian noninstitutional population ages 25 and older. Estimates by industry group include private wage and salary workers, self-employed workers, and unpaid family workers. Unemployment rates displayed in the tools are not seasonally adjusted.
-
There was likely substantial variation in unemployment among subsectors within the 12 major industry groups shown in the tools (for instance, food and beverage stores within retail trade), but the Current Population Survey (CPS) sample is insufficient to assess unemployment in these smaller categories.
-
Due to small sample sizes, data for the following major industry groups are not displayed: “mining, quarrying, and oil and gas extraction” and “other services” for all workers in all months; “construction,” “agriculture,” and “wholesale trade” for immigrant women in all months; “public administration” for immigrant men and immigrant women in all months; “finance” for immigrant women in 2019; and “health services” for immigrant men in 2019.
Source: Migration Policy Institute tabulation of data from the U.S. Census Bureau’s monthly Current Population Survey, 2019-2023.