

Middle Eastern and North African Immigrants in the United States

Click here for a larger version of map.
Political unrest and violent conflict have displaced millions in Syria and other parts of the Middle East and North Africa (MENA) since late 2010, generating significant international interest in immigrants and refugees from the region.
In the United States, the September 11, 2001 attacks and subsequent military intervention in Iraq in 2003 also drew heightened — and sometimes unwanted — attention to the highly diverse MENA immigrant populations in the country, many of whom are Muslim. Yet immigrants from the MENA region have a long history in the United States. As early as 1920, the country was home to at least 50,000 immigrants from the region, primarily from what was then Palestine and Syria, including present-day Lebanon. Their numbers have steadily grown over the past few decades, and in 2012, about 961,000 immigrants from the region resided in the United States, representing just above 2 percent of the nation’s 40.8 million immigrants.
Iraqis are the largest single-country immigrant population from this region, followed closely by Egyptians. The number of immigrants from Saudi Arabia and Yemen has also grown rapidly over the past decade. There was no noticeable increase in the number of Syrians entering the United States as refugees between 2011 and 2012 as the Syrian civil war intensified, most likely due to the lag in time between application and approval for resettlement. However, there was a marked upturn in Syrians granted asylum (365 in 2012, up from 60 in 2011). In 2012, a larger share of Syrian immigrants (70 percent) were naturalized U.S. citizens compared to MENA immigrants overall (58 percent) and the overall foreign-born population (45 percent).
Compared to other immigrant groups, the foreign born from the MENA region are better educated and tend to have higher levels of English proficiency, but have comparatively lower rates of labor force participation. California, New York, and Michigan are home to the largest populations of MENA immigrants (for more information on immigrants by state, please see the ACS/Census Data tool in the MPI Data Hub).
This article focuses on the foreign born from the MENA region residing in the United States, examining the population's size, geographic distribution, and socioeconomic characteristics. It draws on data from the U.S. Census Bureau's 2011 and 2012 American Community Surveys (ACS) and the 1990 and 2000 Decennial Censuses.
Click on the bullet points below for more information:
Size, Distribution, and Growth
|
Definitions
|
||
|
- There were about 961,000 foreign born from the MENA region residing in the United States in 2012.
- Iraqi, Egyptian, and Lebanese immigrants accounted for nearly half of MENA immigrants in 2012.
- For roughly the past decade, the fastest-growing immigrant groups from the MENA region have been Sudanese, Saudis, and Yemenis.
- In 2012, more than half of all immigrants from the MENA region resided in five states: California, New York, Michigan, Texas, and New Jersey.
- One in six immigrants in Michigan were from the MENA region.
MENA Diaspora in the United States
Demographic and Socioeconomic Overview
|
Methodology
|
||
|
- Forty-five percent of the foreign born from the MENA region in the United States arrived in 2000 or later.
- Immigrant men from the region outnumbered women in 2011.
- More than 80 percent of MENA immigrants in 2011 were adults of working age.
- Forty-five percent of foreign born from the MENA region in the United States arrived in 2000 or later.
- Forty-three percent of MENA immigrants in 2011 were Limited English Proficient (LEP) compared to 51 percent of all immigrants.
- Three-quarters of LEP MENA immigrants spoke Arabic.
- Forty-two percent of foreign-born adults from the MENA region held a bachelor’s degree or higher.
- Immigrant men and women from the MENA region were less likely to participate in the civilian labor force than were foreign-born men and women overall.
- More than 22 percent of employed MENA men worked in sales.
- More than one-quarter of immigrants from the MENA region lived in poverty in 2011.
Modes of Entry and Naturalization
- In 2012, more than 53,000 MENA immigrants were granted U.S. lawful permanent residency (LPR status, also known as obtaining a green card).
- Nationals from MENA countries accounted for 14 percent of persons granted asylum in 2012.
- More than 28,000 MENA immigrants became U.S. citizens through naturalization in 2012.
- Immigrants from the MENA region were more likely than other immigrant groups to be naturalized U.S. citizens.
Size, Distribution, and Growth
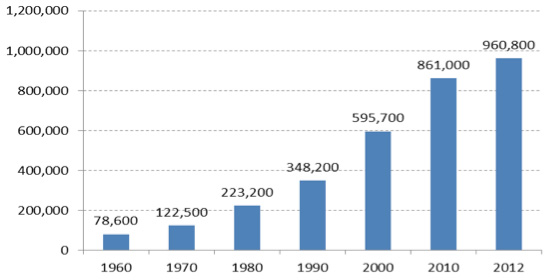
There were about 961,000 foreign born from the MENA region residing in the United States in 2012.
There were 960,800 foreign born from the MENA region residing in the United States in 2012, accounting for slightly more than 2 percent of the country's 40.8 million immigrants.
The number of MENA immigrants residing in the country has grown significantly over the past few decades (see Table 1 and Figure 1), increasing more quickly than the overall immigrant population (176 percent versus 106 percent, respectively, between 1990 and 2012). However, the MENA immigrant population grew more slowly than certain other immigrant groups; for example, the number of immigrants from South Central Asia grew by 289 percent.
|
|
||||||||||||||||||||||||||||||||||||
|
||||||||||||||||||||||||||||||||||||
|
|
||
|
Iraqi, Egyptian, and Lebanese immigrants accounted for nearly half of MENA immigrants in 2012.
The foreign born from Iraq were the largest single-country immigrant group from the MENA region with 177,000 immigrants (or 18 percent of all immigrants from the region), followed by those from Egypt (172,800, or 18 percent), Lebanon (121,700, or 13 percent), Syria, (74,900, or 8 percent), Saudi Arabia (69,200, or 7 percent), and Morocco (65,200, or 7 percent).
For roughly the past decade, the fastest-growing immigrant groups from the MENA region have been Sudanese, Saudis, and Yemenis.
Between 2000 and 2012, the fastest-growing immigrant groups from the MENA region were Sudanese (149 percent increase from 18,600 to 46,300), Saudis (149 percent increase from 27,800 to 69,200), and Yemenis (110 percent increase from 19,600 to 41,200).
By contrast, the foreign born from Jordan (26 percent), Lebanon (21 percent), and Kuwait (15 percent) had the slowest rates of growth.
Note: This ranking is based only on origin countries for which Census Bureau data are available (see Methodology box).
In 2012, more than half of all immigrants from the MENA region resided in five states: California, New York, Michigan, Texas, and New Jersey.
California had the largest number of MENA immigrants in 2012 with 189,800 (20 percent of the total), New York (97,600, or 10 percent), followed by Michigan (95,200, or 10 percent), Texas (65,600, or 7 percent), and New Jersey (62,200, or 6 percent).
|
Quick Facts on Syrian Immigrants in the United States, 2011-12
|
||
|
One in six immigrants in Michigan was from the MENA region.
Whereas immigrants from the MENA region accounted for 2 percent of the foreign born nationwide in 2012, 16 percent of immigrants in Michigan were born in the MENA region. About 5 percent of the foreign born in Virginia, Ohio, and Tennessee were also from the MENA region. In contrast, these immigrants accounted for less than 2 percent of all immigrants in California, even though the largest number of MENA immigrants resides in that state.
MENA Diaspora in the United States
There were close to 2 million members of the MENA diaspora (encompassing the foreign born as well as U.S. born of this ancestry) residing in the United States in 2011.
Of the 1.96 million members of the MENA diaspora residing in the United States in 2011, 43 percent were born in the MENA region and 51 percent were native-born U.S. citizens. The remaining 6 percent were born primarily in other parts of Asia, followed by Latin America, Europe, Canada, and sub-Saharan Africa (in descending order).
Note: There is no universally-recognized definition of the term "diaspora." Most often, the term includes individuals who self-identify as having ancestral ties to a specific country of origin. The MENA diaspora in the United States includes all individuals who were born in a MENA country or who selected at least one of the following responses on the two ACS questions about ancestry: “Algerian,” “Arab,” “Arabic,” “Assyrian,” “Bahraini,” “Chaldean,” “Egyptian,” “Iraqi,” “Jordanian,” “Kuwaiti,” “Lebanese,” “Libyan,” “Middle Eastern,” “Moroccan,” “North African,” “Omani,” “Other Arab,” “Qatari,” “Saudi Arabian,” “South Yemeni,” “Syrian,” “Tunisian,” “United Arab Emirates,” or “Yemeni.”
In addition to the responses above, “Palestinian,” “West Bank,” and “Gazan” accounted for another 75,400 diaspora members.
Demographic and Socioeconomic Overview
Note: The following bullet points are based on 2011 IPUMS data.
Forty-five percent of foreign born from the MENA region in the United States arrived in 2000 or later.
In 2011, 45 percent of MENA foreign born had entered the country in 2000 or later, with 25 percent having arrived between 1990 and 1999, 15 percent between 1980 and 1989, and the remaining 16 percent prior to 1980.
By contrast, 36 percent of all immigrants entered the country in 2000 or later, with 27 percent arriving between 1990 and 1999, 18 percent between 1980 and 1989, and the remaining 19 percent prior to 1980.
Immigrant men from the region outnumbered women in 2011.
Fifty-five percent of MENA immigrants residing in the United States in 2011 were men. Among all immigrants, the male-to-female ratio is more even, with men representing 49 percent and women accounting for 51 percent.
The predominance of men among the foreign born from the MENA region was greatest among those from Algeria and Kuwait (61 percent each), Saudi Arabia (60 percent), Morocco, and Sudan (58 percent each). The ratio of men to women was balanced among immigrants from Lebanon (50 percent male) and Iraq (51 percent male).
More than 80 percent of MENA immigrants in 2011 were adults of working age.
Of all MENA immigrants residing in the United States in 2011, 7 percent were minors (under the age of 18), 81 percent were adults of working age (between ages 18 and 64), and 11 percent were seniors (ages 65 and older).
Of the total foreign-born population in the United States, 5 percent were minors, 82 percent were of working age, and 13 percent were seniors.
Forty-three percent of MENA immigrants in 2011 were Limited English Proficient (LEP) compared to 51 percent of all immigrants.
About 43 percent of MENA immigrants ages 5 and older reported speaking English less than "very well," thus classifying them as Limited English Proficient (LEP). The share of MENA immigrants who are LEP is lower than that among all foreign born ages 5 and older (51 percent).
A relatively small share (11 percent) of MENA immigrants age 5 and older reported speaking English only, while 46 percent reported speaking English "very well."
Certain immigrant groups from the MENA countries were more likely than others to be LEP. Among the foreign born ages 5 and older, 57 percent of Iraqis and 58 percent of Yemenis were LEP. In contrast, the foreign born from Egypt (34 percent), Lebanon (32 percent), and Kuwait (22 percent) were least likely to be LEP.
Note: The term "Limited English Proficient" refers to any person age 5 and older who reported speaking English "not at all," "not well," or "well" on their survey questionnaire. Individuals who reported speaking only English or speaking English "very well" are considered proficient in English.
Three-quarters of LEP MENA immigrants spoke Arabic.
Among the more than 350,000 LEP immigrants ages 5 and older from MENA countries, 79 percent indicated that they spoke Arabic. Other common languages include Armenian (5 percent), French (4 percent), and the grouped category of Syriac, Aramaic, and Chaldean (7 percent).
Forty-two percent of foreign-born adults from the MENA region held a bachelor’s degree or higher.
Overall, MENA immigrants (ages 25 and older) are better educated than both immigrant adults overall and native-born adults.
In 2011, 42 percent of MENA adults ages 25 and older had a bachelor's degree or higher, compared to 27 percent among foreign-born adults and 29 percent of native-born adults. An additional 7 percent had an associate's degree, compared to 6 percent among all immigrant adults and 8 percent of all native-born adults.
On the other end of the education continuum, 18 percent of foreign-born adults from the MENA region had no high school diploma or the equivalent general education diploma (GED) — significantly lower than the share of all foreign-born adults (31 percent) but higher than among native-born adults (11 percent). The remaining 33 percent of MENA immigrant adults reported their highest level of education as a high school diploma, GED, or some college, compared to 36 percent of all foreign-born adults and 52 percent of native-born adults.
Foreign-born adults from Saudi Arabia (69 percent), Egypt (64 percent), Kuwait (54 percent), and Algeria (48 percent) were more likely to hold a bachelor's degree or higher. Immigrants from Iraq and Yemen were among the least educated, with only 27 percent and 10 percent holding a bachelor's degree or higher, respectively.
Immigrant men and women from the MENA region were less likely to participate in the civilian labor force than were foreign-born men and women overall.
In 2011, foreign-born men ages 16 and older from the MENA region were less likely to participate in the civilian labor force (72 percent) than were all foreign-born men (78 percent). Foreign-born women from MENA countries were also less likely to participate in the labor force (42 percent) than were all immigrant women (57 percent).
Among men, Algerians (91 percent) and Sudanese (87 percent) had the highest labor force participation rates, while Iraqis (65 percent) and Saudis (23 percent) had the lowest labor force participation.
Sudanese and Moroccan immigrant women also had the highest labor force participation rates (62 percent and 50 percent, respectively), while Jordan (32 percent), Saudi (29 percent), and Yemeni women (9 percent) had the lowest labor force participation.
More than 22 percent of employed MENA men worked in sales.
The top three occupations that employed the close to 277,000 MENA-born men ages 16 and older were sales (22 percent); management, business, finance (15 percent); and service and personal care (13 percent).
Compared to working immigrant men overall, MENA immigrant men were nearly three times more likely to work in sales but half as likely to be employed in construction, extraction, and transportation.
|
|
||||||||||||||||||||||||||||||||||||||||||||||||||||||||||||||||||||||||||||||||||||||||||||||||
|
||||||||||||||||||||||||||||||||||||||||||||||||||||||||||||||||||||||||||||||||||||||||||||||||
Among the 123,000 MENA-born female workers (ages 16 and older), 17 percent reported working in administrative support; 17 percent in service and personal care; and 15 percent in education, training, media, and entertainment-related occupations.
MENA-born female workers were twice as likely to employed in education, training, and media and entertainment occupations than working immigrant women overall (15 percent versus 7 percent), but they were less likely to report working in service and personal-care occupations (17 percent versus 27 percent).
More than one-quarter of immigrants from the MENA region lived in poverty in 2011.
In 2011, about 27 percent of immigrants from MENA countries lived in poverty, compared to 20 percent of all immigrants and 15 percent of all native born. Immigrants from Sudan (44 percent), Yemen (41 percent), and Iraq (38 percent) were most likely to live in poverty while immigrants from Morocco (21 percent), Lebanon (18 percent), Algeria (15 percent), and Kuwait (12 percent) were least likely to live in poverty.
Note: Individuals residing in families with a total annual income of less than the federal poverty line are described as living in poverty. Whether an individual falls below the official poverty line depends not only on total family income, but also on the size of the family, the number of children, and the age of the head of household. The ACS reports total income over the 12 months preceding the interview date.
Modes of Entry and Legal Status
Note: This section is based on DHS data, unless stated otherwise. DHS data refer to the U.S. government's fiscal year, October 1 through September 30. Thus, "2012" refers to October 1, 2011 through September 30, 2012.
In 2012, more than 53,000 MENA immigrants were granted U.S. lawful permanent residency (LPR status, also known as obtaining a green card).
In 2012, 53,762 immigrants from the MENA region obtained green cards, accounting for 5 percent of the 1 million immigrants granted LPR status that year. The foreign born from the MENA region gained LPR status mostly through family reunification. About 44 percent obtained green cards through family relationships, 35 percent as refugees or asylees, 16 percent through other routes, including diversity visas, and 5 percent through employment.
About 34 percent of all MENA immigrants granted LPR status in 2012 qualified as the immediate family member (spouse, unmarried child under age 21, or parent) of a U.S. citizen, compared to 46 percent of all immigrants. Thirty-five percent of all MENA immigrants received green cards as refugees or asylees, compared to 15 percent of all immigrants.
Read more about immigrants who became LPRs in 2011 in Green Card Holders and Legal Immigration to the United States.
Nationals from MENA countries accounted for 14 percent of persons granted asylum in 2012.
In 2012, 4,136 nationals from MENA countries (14 percent of 29,484 total) were granted asylum. From 2003 to 2012, nationals from MENA countries accounted for 7 percent (16,563) of the total 253,470 individuals granted asylum during that period. Large numbers of refugees have arrived from Iraq since 2008, with 12,163 refugees coming to the United States in 2012 alone (21 percent of all refugee admissions for 2012).
In response to the crisis and deteriorating conditions in Syria since March 2011, an increasing number of Syrian nationals are being granted asylum. In 2012, a total of 365 Syrians received asylum, compared to a total of 309 for the 2003-11 period (with an average 34 individuals receiving asylum each year). For 2012, there was no comparable increase in Syrian refugee admissions.
Read more about Refugees and Asylees in the United States and The Faltering U.S. Refugee Protection System.
More than 28,000 MENA immigrants became U.S. citizens through naturalization in 2012.
In 2012, 28,196 MENA immigrants were naturalized in the United States, representing about 4 percent of the 757,434 new U.S. citizens that year.
Immigrants from the MENA region were more likely than other immigrant groups to be naturalized U.S. citizens.
Among the foreign born from the MENA region, 58 percent were naturalized U.S. citizens, compared to 45 percent among the overall foreign-born population.
Immigrants from Lebanon (78 percent), Syria (70 percent), and Jordan (65 percent) were most likely among all immigrants from the MENA region to be naturalized U.S. citizens, while the foreign born from Algeria (50 percent), Iraq (47 percent), and Saudi Arabia (16 percent) were least likely to be naturalized U.S. citizens.
For more information about ACS data and methodology, click here.
Sources
Gibson, Campbell and Emily Lennon. Historical Census Statistics on the Foreign-Born Population of the United States: 1850 to 1990. U.S. Census Bureau, Working Paper No. 29. U.S. Government Printing Office, Washington, DC, 1999. Available online.
Ruggles, J., Steven, Trent Alexander, Katie Genadek, Ronald Goeken, Matthew B. Schroeder, and Matthew Sobek. 2010. Integrated Public Use Microdata Series: Version 5.0 [Machine-readable database]. Minneapolis: University of Minnesota. Available online.