

College-Educated Immigrants in the United States
Contrary to a widely held view, immigrants in the United States have an expansive range of education levels, with about one in three immigrants having obtained a college degree.
According to the U.S. Census Bureau's 2011 American Community Survey (ACS), immigrants accounted for 16 percent of the 58.8 million college-educated persons. However, their numbers were much higher among workers in certain occupations: Immigrants represent nearly 28 percent of physicians, more than 31 percent of computer programmers, and over 47 percent of medical scientists.
This spotlight provides a brief demographic and socioeconomic profile of college-educated natives and immigrants (age 25 and older) in 2011 and those who were engaged in the U.S. civilian labor force. Unless noted otherwise, this article draws on 2011 ACS data.
Click on the bullet points below for more information:
- One in six college-educated adults was born abroad.
- The college-educated immigrant population grew faster than their native counterparts in the 1990s and 2000s.
- Women slightly outnumbered men among the foreign-born, college-educated population.
- College-educated immigrants were younger than their native counterparts.
- Almost three-quarters of foreign-born, college-educated adults were Asian and white.
- About 17 percent of college-educated immigrants were of Latino origin.
- The foreign born were more likely to hold a doctorate or professional degree than the native born.
- Close to 28 percent of college-educated immigrants were limited English proficient.
- Of the 9.4 million college-educated foreign born, one-third arrived in the last 11 years.
- Over half of all college-educated immigrants came from Asia, with India, the Philippines, and China being the top three origin countries.
- Close to 8 percent of college-educated immigrants lived in families below the poverty line.
- College-educated immigrants were more likely to be unemployed than the native born.
- About one in ten college-educated adults was self-employed.
- The length of stay affected the earnings of the college-educated immigrants.
- Foreign-born, college-educated workers were more likely to be in high-tech, science, or engineering occupations.
- California, New York, Florida, and Texas accounted for half of the 7.2 million immigrants in college-educated labor force.
- More than 1.6 million college-educated immigrants were underutilized in the U.S. labor market in 2011.
Demographic profile
|
Definitions
|
||
|
One in six college-educated adults was born abroad.
In 2011, of the 58.8 million adults with a bachelor’s degree and higher, 9.4 million or 16 percent were immigrants (see Table 1).
The college-educated immigrant population grew faster than their native counterparts in the 1990s and 2000s.
The population of college-educated immigrants grew by 89 percent between 1990 and 2000 (from 3.1 million to 5.9 million) and by 61 percent between 2000 and 2011 (from 5.9 million to 9.4 million). In contrast, the native college-educated population grew by 32 percent and 28 percent, respectively.
Given the faster rate of growth, it is not surprising that the foreign-born share of the college-educated population also increased over the last two decades: from 10 percent in 1990 to 13 percent in 2000, and to 16 percent in 2011.
|
Table 1. Demographic, Social, and Poverty Characteristics by Nativity: Civilian College-Educated Adults, Age 25 and Older, 2011
|
||||||||||||||||||||||||||||||||||||||||||||||||||||||||||||||||||||||||||||||||||||||||||||||||||||||||||||||||||||||||||||||||||||||||||||||||||||||||||||||||||||||||||||||||||||||||||||||||||||||||||||||||||||||||||||||||||||||||
|
||||||||||||||||||||||||||||||||||||||||||||||||||||||||||||||||||||||||||||||||||||||||||||||||||||||||||||||||||||||||||||||||||||||||||||||||||||||||||||||||||||||||||||||||||||||||||||||||||||||||||||||||||||||||||||||||||||||||
Women slightly outnumbered men among the foreign-born, college-educated population.
Slightly over half (51 percent) of all 9.4 million college-educated immigrants were women. Women accounted for about 52 percent of the 49.3 million native-born, college-educated persons.
College-educated immigrants were younger than their native-born counterparts.
Thirty-eight percent of college-educated immigrants were younger than 40 years old, compared to 32 percent of those born in the United States. Those who were older than 50 years old account for 37 percent of the foreign-born, college-educated population, compared to the 47 percent of the native-born population.
Race, ethnicity, and country of birth
|
Demographic Groups Defined
|
||
|
Almost three-quarters of foreign-born, college-educated adults were Asian and white.
Foreign-born Asians made up 46 percent and foreign-born whites made up 28 percent of the college-educated population. In contrast, an overwhelming majority of the native-born, college-educated population was white (85 percent) while racial-ethnic minorities were underrepresented.
About 17 percent of college-educated immigrants were of Latino origin.
Latinos represented 17 percent of college-educated immigrants while accounting for about 4 percent of U.S.-born college graduates.
The foreign born were more likely to hold a doctorate or professional degree than the native born.
Among the college-educated foreign born, 15 percent held professional or doctorate degrees, compared to 10 percent among the college-educated native born. About one-quarter of each group had a master’s degree.
Close to 28 percent of college-educated immigrants were limited English proficient.
Of the 9.4 million college-educated foreign born in 2011, 28 percent reported speaking English less than "very well."
(Note: The term limited English proficient refers to any person who reported speaking English "not at all," "not well," or "well" on the ACS questionnaire. Individuals who reported speaking only English or speaking English "very well" are considered proficient in English.)
Of the 9.4 million college-educated foreign born, one-third arrived in the past 11 years.
The Immigration Act of 1990 and other immigration legislation in the past two decades facilitated increased immigration of college-educated immigrants. One in three immigrants arrived between 2000 and 2011.
About 41 percent of the 9.4 million college-educated immigrants were non-U.S. citizens.
Over half of all college-educated immigrants came from Asia, with India, Philippines, and China being the top three origin countries.
In 2011, 51 percent of the 9.4 million foreign-born, college-educated adults came from Asian countries. Twenty-two percent were from Latin America and the Caribbean, while 18 percent were born in Europe. The top three countries of origin for college-educated immigrants were India (13 percent), Philippines (8 percent), and China (including Hong Kong, about 8 percent) (see Table 1).
Poverty
Close to 8 percent of all college-educated immigrants lived in families below the poverty line.
Approximately 8 percent of college-educated immigrants lived in families with an income below the official poverty threshold. In comparison, only 4 percent of their native-born counterparts lived in poverty. Another 11 percent of college-educated immigrants reported having family income falling between 100 percent and 200 percent of the poverty threshold, compared to 7 percent of their native counterparts.
Labor Force Characteristics
College-educated immigrants were more likely to be unemployed than the native born.
Of the 7.2 million college-educated immigrants engaged in the U.S. civilian labor force in 2011, about 6 percent reported being unemployed, compared to a slightly lower rate (4 percent) among the native born (see Table 2).
About one in ten college-educated adults was self-employed.
The rates of self-employment were very similar between immigrant and native college-educated adults: About 11 percent of both groups reported being self-employed in 2011.
The length of stay affected the earnings of college-educated immigrants.
On average, native and immigrant college-educated workers (who worked at least 50 weeks in 2010) reported having similar earnings — about $79,000. However, the college-educated foreign born who had been in the United States for more than a decade reported higher earnings (close to $85,000) than their native counterparts.
Foreign-born, college-educated workers were more likely to be in high-tech, science, or engineering occupations.
Of 6.8 million employed immigrants, 19 percent of college-educated immigrants were employed in computer-related occupations, engineering, and sciences (versus 10 percent among the natives). Similarly, college-educated foreign born were more likely than the native born to be physicians and surgeons (4 percent versus 2 percent). In contrast, natives were more likely to be in management and business operations (27 percent versus 23 percent) and in education-related occupations (19 percent versus 12 percent).
|
Table 2. Labor Market Characteristics by Birth: Civilian College-Educated Labor Force, Age 25 and Older, 2011
|
|||||||||||||||||||||||||||||||||||||||||||||||||||||||||||||||||||||||||||||||||||||||||||||||||||||||||||||||||||||||||||||||||||||||||||||||||||||||||||||||||||||||||||||||||
|
|||||||||||||||||||||||||||||||||||||||||||||||||||||||||||||||||||||||||||||||||||||||||||||||||||||||||||||||||||||||||||||||||||||||||||||||||||||||||||||||||||||||||||||||||
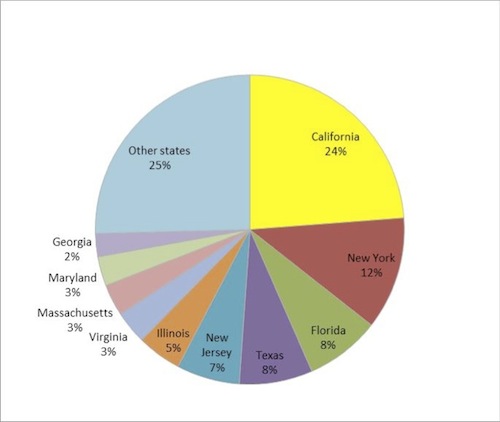
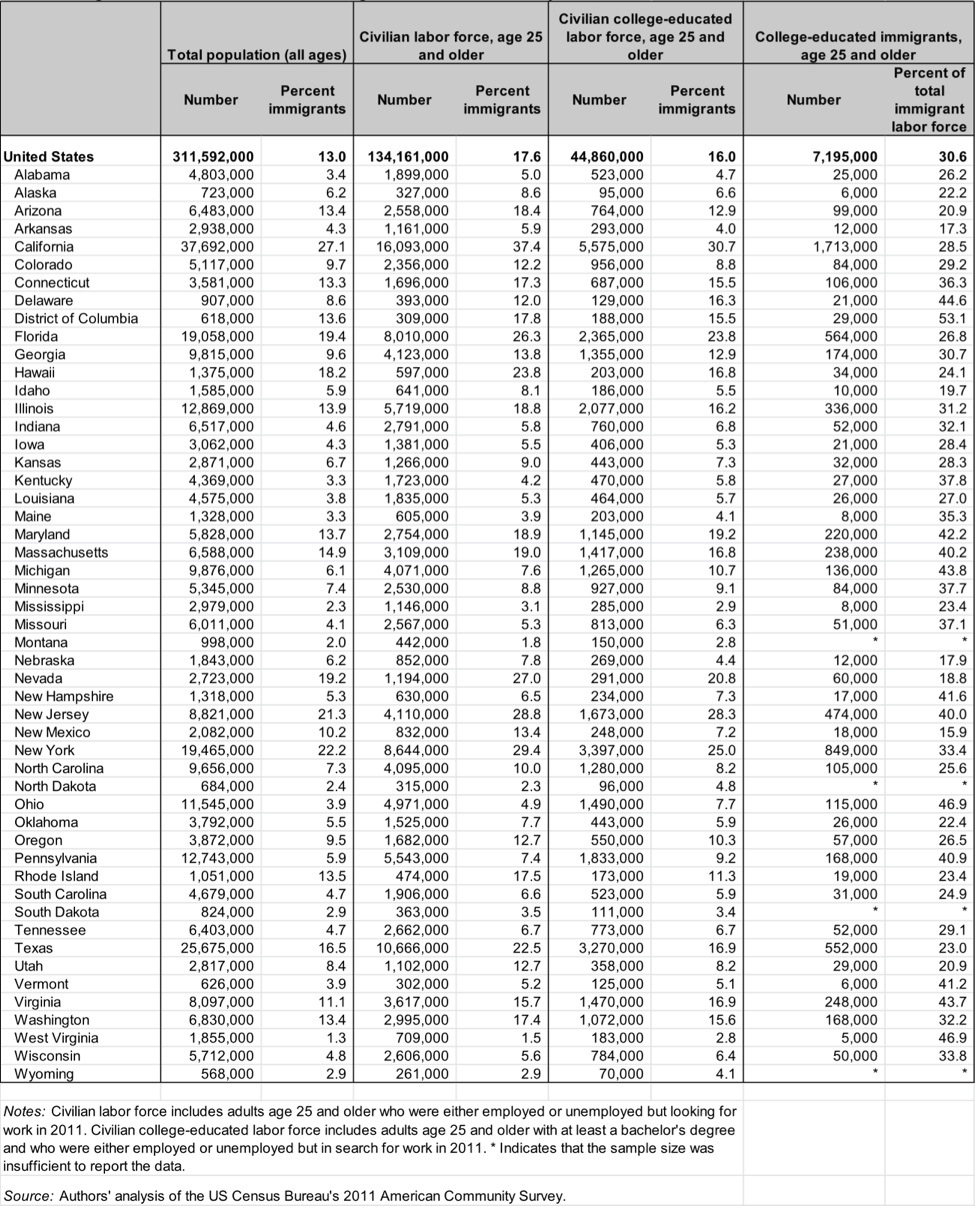
California, New York, Florida, and Texas accounted for half of the 7.2 million college-educated immigrants in the labor force.
California had the largest number of college-educated immigrants (1.7 million, or 24 percent); followed by New York (849,000, or 12 percent); Florida (564,000, or 8 percent); and Texas (552,000, or 8 percent). These four states accounted for 51 percent of the 7.2 million college-educated immigrants in the labor force. The next six states — New Jersey (7 percent), Illinois (5 percent), Virginia, Massachusetts, and Maryland (3 percent each), and Georgia (2 percent) — accounted for another 23 percent of the nation's college-educated immigrant labor forces (see Figure 1 and detailed Table 3).
|
Figure 1. State Share of the College-Educated Immigrants in Civilian Labor Force, 2011
|
||
|
|
Table 3. Immigrant Adults in Civilian Total and College-Educated Labor Force by State, 2011
|
||
|
More than 1.6 million college-educated immigrants were underutilized in the U.S. labor market in 2011.
More than 1.6 million of college-educated immigrants were either unemployed or working in unskilled jobs such as dishwashers, security guards, or taxi drivers in 2011 (see Table 4). This situation represents a waste of human capital affecting nearly 23 percent of skilled immigrants (compared to 17 percent of skilled natives) (see Uneven Progress: The Employment Pathways of Skilled Immigrants in the United States for more information).
|
Table 4. Number and Share of College-Educated Adults (Age 25 and Older) Who Were Either Unemployed or Employed in Low-Skilled Jobs, 2011
|
||||||||||||||||||||||||||||||||
|
References
Steven Ruggles, Matthew Sobek, Trent Alexander, Catherine A. Fitch, Ronald Goeken, Patricia Kelly Hall, Miriam King, and Chad Ronnander. 2012. Integrated Public Use Microdata Series: Version 4.0 [Machine-readable database]. Minneapolis, MN: Minnesota Population Center.
American Community Survey. 2011. Survey Methodology Main. Available online.