Frequently Requested Statistics on Immigrants and Immigration in the United States
Source Spotlights are often updated as new data become available. Please click here to find the most recent version of this Spotlight.
Editor's Note: The sections titled "How many unauthorized immigrants are in the United States?" and "Where are unauthorized migrants from?" have been updated to reflect new estimates released by the Department of Homeland Security days after the initial publication of this piece.
Immigration has a profound impact on the United States, which throughout its history has been a destination for migrants from across the globe. Immigration touches on myriad facets of American life – ranging from the economic and political to the cultural.
As such, it is important that facts about immigrants and contemporary immigration flows to the United States are made easily available to the public. This Spotlight seeks to do so, providing some of the most frequently used current and historical facts and figures in easily accessible fashion. For example:
Which countries are the main sources for immigration to the United States? How many immigrants come each year? How many are already here? How many became U.S. citizens last year? How many children live in immigrant families? How large are illegal immigration flows? Do immigrants have health insurance? How many immigrants live in poverty? How many are eligible to vote?
This Spotlight brings together resources from the Migration Policy Institute (MPI); the U.S. Census Bureau's 2010 American Community Survey, 2010 Current Population Survey, and 2000 decennial census; the U.S. Departments of Homeland Security and State; the Pew Hispanic Center; and Mexico's National Population Council (CONAPO) and National Institute of Statistics and Geography (INEGI).
Click on the bullet points below for more information on each topic:
- Current and Historical Numbers and Shares
- Demographic, Educational, and Linguistic Characteristics
- Mexican Immigrants
- Health Insurance Coverage
- Workforce Characteristics
- Geographic Distribution
- Children with Immigrant Parents
- Annual Flows
- Illegal Immigration
- Immigration Control and Enforcement
- Naturalization Trends
- Backlogs
Current and Historical Numbers and Shares
- According to the most recently available data, how many immigrants are in the United States today?
- What are the historical numbers and shares of immigrants in the United States?
- What are the top source countries with the largest share of immigrants compared with those 50 years ago?
According to the most recently available data, how many immigrants are in the United States today?
According to the Census Bureau's 2010 American Community Survey (ACS), the U.S. immigrant population stood at almost 40 million, or 13 percent of the total U.S. population of 309.3 million.
The data suggest that, between 2009 and 2010, the foreign-born population increased more than 1.4 million, or by nearly 4 percent (compared to 1.5 percent between 2008 and 2009). This increase is significant, and seems to reflect a continuing rebound after immigration slowed substantially during the recession. However, to some extent the increase can be attributed to how the data were compiled.
Because ACS measures its population figures against the most recently available decennial census numbers, the 2010 ACS estimates are weighted to the 2010 decennial census, whereas the 2009 estimates (and earlier years) were based on the 2000 Census. Further complicating the picture, completion rates for the 2010 ACS likely increased as a result of the Census Bureau's sustained public relations efforts to boost participation in the 2010 Census. For instance, marketing campaigns were launched in 28 languages to educate and reach out to minority and ethnic groups about the importance (and confidentiality) of the census, presumably bolstering the count of the U.S. population in both the 2010 Census and the ACS survey.
An analysis by the Pew Hispanic Center concludes that the actual growth in the foreign-born population from 2009 to 2010 was a markedly lower 616,000, or less than 2 percent.
- For background on the American Community Survey, see the Census Bureau.
- To access the Pew Hispanic Center's report on the growth of the immigrant population, click here.
|
Definitions
|
||
|
What are the historical numbers and shares of immigrants in the United States?
Data on the nativity of the U.S. population were first collected in the 1850 decennial census. That year, there were 2.2 million foreign born in the United States, almost 10 percent of the total population.
Between 1860 and 1920, immigrants as a percentage of the total population fluctuated between 13 and 15 percent, peaking at nearly 15 percent in 1890 mainly due to European immigration. By 1930, immigrants' share of the U.S. population had dropped to less than 12 percent (14.2 million individuals).
The share of foreign born in the U.S. population continued to decline between the 1930s and 1970s, reaching a record low of approximately 5 percent in 1970 (9.6 million individuals). However, since 1970, the percentage has increased rapidly, mainly due to large-scale immigration from Latin America and Asia.
The foreign born represented 6 percent (14.1 million individuals) of the total U.S. population in 1980. By 1990, their share had risen to 8 percent (19.8 million individuals), and by the 2000 census they made up 11 percent (31.1 million individuals) of the total U.S. population. As of 2010, immigrants comprised 13 percent (40 million) of the total U.S. population.
- See the figure Size of the Foreign-Born Population and Foreign Born as a Percentage of the Total Population (1850 to 2010) in the MPI Data Hub.
What are the top source countries with the largest share of immigrants compared with those 50 years ago?
As of 2010, Mexican-born immigrants accounted for approximately 29 percent of the nearly 40 million foreign born residing in the United States, making them the largest immigrant group in the country by far.
China (including Hong Kong but not Taiwan) accounted for 5 percent of all foreign born, followed by India and the Philippines, each comprising approximately 4 percent of the immigrant population. These four countries — together with Vietnam, El Salvador, Cuba, and Korea (at about 3 percent each), as well as the Dominican Republic and Guatemala (each about 2 percent) — made up almost 60 percent of all foreign born residing in the United States in 2010.
The predominance of immigrants from Central American and Asian countries in the early 21st century starkly contrasts with the trend seen in 1960 when immigrants were more likely to be from European countries. Italian-born immigrants made up 13 percent of all foreign born in 1960, followed by those born in Germany and Canada (accounting for about 10 percent each). Unlike in 2010, no single country accounted for more than 15 percent of the total immigrant population in 1960.
- To view the top ten source countries of immigrants to the United States by decade from 1960 to 2010, visit the U.S. Historical Trends tool.
- Read our Spotlights on Mexican, Chinese, Indian, Filipino, and Vietnamese immigrants (Note: these Spotlights are based on ACS 2009 data).
|
Definitions
|
||
|
Demographic, Educational, and Linguistic Characteristics
- What share of all immigrants residing in the United States are women?
- What is the age distribution of the immigrant population?
- How many immigrants have come to the United States since 2000?
- How many immigrants are naturalized U.S. citizens?
- What is the racial composition of immigrants?
- How many immigrants are of Hispanic origin?
- How many Hispanics are immigrants?
- Which languages does the U.S. population speak?
- What is the size of the limited English proficient population?
- What percentage of the foreign born are limited English proficient?
- What percentage of the adult foreign-born population is college educated?
What share of all immigrants residing in the United States are women?
In 2010, approximately 51 percent of the immigrant population was female. The share of women fluctuated slightly in the past three decades. Women accounted for 53 percent of the 14.1 million immigrants in 1980, 51 percent of the 19.7 million immigrants in 1990, and 50 percent of the 31.1 million immigrants in 2000.
What is the age distribution of the immigrant population?
In 2010, less than 1 percent of the foreign-born population in the United States were under the age of 5; 6 percent were 5 to 17; 9 percent were 18 to 24; 72 percent were 25 to 64; and 12 percent were 65 or older. Among the native-born population in the United States, 7 percent were under the age of 5; 19 percent were between 5 and 17; 10 percent were 18 to 24; 50 percent were 25 to 64; and 13 percent were 65 or older.
Overall, the immigrant population in 2010 was older than the U.S.-born population: The median age of immigrants was 41.4 years, compared to 35.9 years among the U.S. born.
- See the age-sex pyramids of the total, native-born, and immigrant populations here.
How many immigrants have come to the United States since 2000?
Of the 40 million foreign born in the United States in 2010, 38 percent entered the country prior to 1990, 27 percent entered between 1990 and 1999, and almost 35 percent entered in 2000 or later.
How many immigrants are naturalized U.S. citizens?
Just over two in five (or almost 17.5 million) immigrants in the United States in 2010 were naturalized U.S. citizens. The remaining 56 percent of immigrants (or 22.5 million) included lawful permanent residents, unauthorized immigrants, and legal residents on temporary visas, such as students and temporary workers.
Of the 17.5 million naturalized citizens in 2010, 44 percent have naturalized since 2000, 27 percent naturalized between 1990 and 1999, 14 percent naturalized between 1980 and 1989, and 15 percent naturalized prior to 1980.
What is the racial composition of immigrants?
Of the foreign born in the United States in 2010, 48 percent reported their race as white alone, 8 percent as black or African American alone, 25 percent as Asian alone, and 16 percent as some other race; more than 2 percent reported having two or more races.
Note: The percentages might not add up to 100 due to rounding.
How many immigrants are of Hispanic origin?
In 2010, 47 percent of the 40 million foreign-born population (about 18.8 million) reported having Hispanic or Latino origins.
How many Hispanics are immigrants?
The majority of Hispanics in the United States are native-born U.S. citizens. Of the 50.7 million people in 2010 who identified themselves as having Hispanic or Latino ancestry, only 37 percent (18.8 million) were immigrants.
Which languages does the U.S. population speak?
In 2010, approximately 79 percent of the U.S. population* ages 5 and older stated that they speak only English at home. One in five people (59.5 million) reported speaking a language other than English. Spanish was by far the most common language (62 percent), followed by "Chinese" (including Mandarin and Cantonese, almost 5 percent), Tagalog (almost 3 percent), Vietnamese (2 percent), French (including Cajun and Patois, 2 percent), Korean (almost 2 percent), German (almost 2 percent), Arabic (1 percent), and Russian (1 percent).
Note: *Refers to the 289.2 million people ages 5 and older who resided in the United States at the time of the survey.
What is the size of the Limited English Proficient (LEP) population?
In 2010, there were 25.2 million Limited English Proficient (LEP) individuals over the age of 5 in the United States, accounting for 9 percent of the 289.2 million people nationally in that age group. Spanish-speaking LEP individuals accounted for 66 percent (or 16.5 million) of the total LEP population in the United States in 2010. The next two languages most commonly spoken by LEP individuals were "Chinese" (1.5 million, or 6 percent) and Vietnamese (836,000, or 3 percent).
Note: The term "Limited English Proficient" refers to any person age 5 and older who reported speaking English "not at all," "not well," or "well" on their survey questionnaire. Individuals who reported speaking only English or speaking English "very well" are considered proficient in English. "Chinese" may include Mandarin and Cantonese.
- Read more about the LEP population, its growth, and linguistic diversity in the nation in Limited English Proficient Individuals in the United States: Number, Share, Growth, and Linguistic Diversity.
What percentage of the foreign born are Limited English Proficient?
In 2010, nearly 52 percent (or 20.5 million) of the 39.7 million foreign-born persons age 5 and older were LEP; practically the same as the share of 51 percent of the 30.7 million foreign-born persons ages 5 and older who were LEP in 2000.
Note: The term "Limited English Proficient" refers to any person age 5 and older who reported speaking English "not at all," "not well," or "well" on their survey questionnaire. Individuals who reported speaking only English or speaking English "very well" are considered proficient in English.
What percentage of the adult foreign-born population is college educated?
In 2010, there were 33.6 million immigrants ages 25 and older. Of those, 27 percent had a bachelor's degree or higher, while nearly 32 percent lacked a high school diploma. Among the 170.7 million native-born adults ages 25 and older, more than 28 percent had a bachelor's degree or higher and 11 percent did not have a high school diploma.
- Visit our 2010 ACS/Census Data Tool for more information on the characteristics of the foreign born in each of the 50 states and the District of Columbia as well as nationally.
- The 2010 data on the foreign and native born are from the American FactFinder of the Census Bureau.
- How many Mexican immigrants are in the United States?
- In which U.S. states do the Mexican born live?
- How many Mexican-born workers are in the U.S. labor force?
- How has the emigration rate from Mexico changed over time?
- Which areas/regions of Mexico send the most migrants to the United States?
How many Mexican immigrants are in the United States?
Nearly 11.7 million foreign born from Mexico reside in the United States, according to the 2010 American Community Survey. Mexican immigrants accounted for 29 percent of all immigrants in the United States in 2010.
In which U.S. states do the Mexican born live?
Mexican immigrants are primarily concentrated in the West and Southwest regions of the United States, and more than half of all Mexican immigrants live in California or Texas (58 percent). In 2010, the top five states with the largest proportion of Mexican immigrants were California (37 percent), Texas (21 percent), Illinois (6 percent), Arizona (4 percent), and Georgia (2 percent).
- View a map of the Mexican born by state in 2010, including the metropolitan areas with at least 150,000 Mexican immigrants, on the MPI Data Hub. (Please note: Due to compatibility issues, you may need to download the map to your computer in order for it to load properly).
The foreign born from Mexico accounted for over half of the immigrant population in New Mexico (73 percent), Arizona (60 percent), Texas (60 percent), and Idaho (55 percent). By contrast, Mexican-born individuals accounted for 2 percent or less of the immigrant population in the following three states: Hawaii (2 percent), Massachusetts (2 percent), and Maine (1 percent).
How many Mexican-born workers are in the U.S. labor force?
Approximately 70 percent of the 11 million immigrants from Mexico ages 16 and older were in the civilian labor force in 2010, compared to 68 percent of the total foreign-born population ages 16 and older (37.7 million immigrants) and 63 percent of the 206.1 million native born ages 16 and older.
How has the emigration rate from Mexico changed over time?
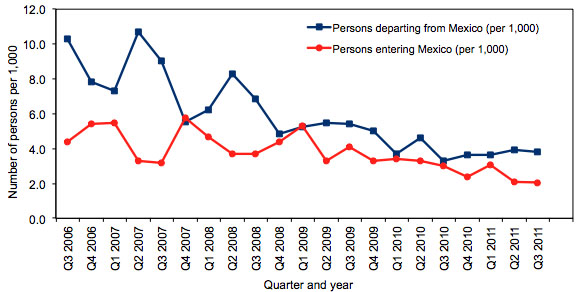
According to Mexico's National Survey of Occupations and Employment (ENOE), the emigration rate from Mexico appears to have slowed recently, from 6.9 migrants per 1,000 residents of Mexico in the fall of 2008 to 5.4 per 1,000 in fall 2009 to 3.3 per 1,000 in fall 2010. In the fall of 2011, the emigration rate from Mexico increased slightly to 3.8 per 1,000 Mexico residents (see Figure 1).
The immigration rate to Mexico (i.e., the number of people who move to Mexico from abroad, who are overwhelmingly return migrants) has entered a moderate decline, moving from 3.7 per 1,000 in the fall of 2008 to 2.1 per 1,000 three years later in the fall of 2011.
Note: ENOE asks Mexican households to enumerate any members of the household are who living abroad at the time of the interview. Accordingly, it does not capture the emigration of entire families where no member of the household remains in Mexico.
|
Figure 1. Emigration and Return Migration Rate of Mexican Residents, 2006 to 2011
|
||
|
Which areas/regions of Mexico sent the most migrants to the United States in 2010?
According to the Survey of Migration on the Northern Border of Mexico* (Encuesta de Migración en la Frontera Norte de México, or EMIF), the flow of Mexicans to the United States in 2010 slowed substantially. In 2010, an estimated 492,000 Mexicans crossed the country's northern border en route to the United States, a 43 percent drop compared to the estimated 856,000 in who migrated to the United States in 2007.
In 2010, traditional sending states such as Michoacán (nearly 16 percent of the 492,000 Mexicans who went to the United States), Guanajuato (11 percent), and Jalisco (10 percent) accounted for the largest numbers of Mexican migrants who headed toward the United States (as a reference, see an overall map of Mexican states here. This is a shift from recent years when larger shares of migrants came from new sending states in southern and eastern Mexico. The most significant drops were recorded in the states of Chiapas and Veracruz. Between 2007 and 2010, migrants from Chiapas declined from 12 percent to 7 percent of the total outflow from Mexico. Similarly, migrants from Veracruz declined from nearly 8 percent to 3 percent of the total outflow over the same period.
One explanation for this shift may be that Mexicans from traditional sending states are more likely to have legal status in the United States while those from newer states in the country's south and east are more likely to cross illegally.
Note: *EMIF is an annual sample survey of migration flows along Mexico's northern border region conducted by the Ministries of Foreign Affairs (SRE) and Labor and Social Affairs (STPS), the National Migration Institute (INM), the National Population Council (CONAPO), and the University of the Northern Border (COLEF) in Tijuana. It excludes Mexicans entering the United States by air, migrants under the age of 15, and non-Mexican nationals crossing the Southwest border. The category "Mexican migrants headed toward the United States" is restricted to those migrants who are traveling to the United States or a Mexican border city, are age 15 and older, were not born in the United States, and do not have an immediate return itinerary.
- Read more (in Spanish) about the characteristics of Mexicans migrating to the United States from EMIF.
|
Definitions
|
||
|
- How many immigrants in the United States have health insurance?
- How many immigrants in various legal statuses have health insurance?
How many immigrants in the United States have health insurance?
According to the 2010 American Community Survey, more than one in three immigrants (34 percent) was uninsured. In contrast, only 13 percent of the native-born population had no health insurance. Approximately 49 percent of the 39.6 million civilian noninstitutionalized immigrants residing in the United States had private health insurance (compared to 68 percent of the U.S. born), and 22 percent had public health insurance coverage (compared to 31 percent of the U.S. born).
How many immigrants in various legal statuses have health insurance?
According to Migration Policy Institute (MPI) estimates, immigrants accounted for 29 percent of the 46.6 million working-age adults and children under 18 with no health insurance in 2008. Of these 13.4 million uninsured immigrants, about half (6.8 million) were unauthorized immigrants, almost a third (4.2 million) were lawful permanent residents, and another 17 percent (2.3 million) were naturalized citizens.
Unauthorized working-age adults (ages 18 to 64) were about three times more likely to be uninsured (59 percent) than either naturalized citizens (20 percent) or native-born U.S. citizens (16 percent).
- For more health coverage statistics and immigrant-related discussion of the health-care reform proposals see the MPI report Immigrants and Health Care Reform: What's Really at Stake?
- What is the foreign-born share of the total U.S. civilian labor force?
- What kinds of jobs do employed immigrants hold?
What is the foreign- born share of the total U.S. civilian labor force?
Immigrants accounted for 16 percent (25.5 million) of the 155.8 million workers engaged in the U.S. civilian labor force in 2010. Between 1970 and 2010, the percentage of foreign-born workers in the U.S. civilian labor force tripled, from 5 percent to 16 percent. Over the same period, the percent of foreign born in the total population grew from almost 5 percent to nearly 13 percent.
- For more information on national shares of immigrants in the civilian labor force over time, see Immigrants as a Percentage of the Total Population and of the Civilian Labor Force.
What kinds of jobs do employed immigrants hold?
Of the 22.9 million civilian employed foreign born ages 16 and older in 2010, 29 percent worked in management, professional, and related occupations; 25 percent worked in service occupations; 18 percent worked in sales and office occupations; 16 percent worked in production, transportation, and material moving occupations; and 13 percent worked in natural resources, construction, and maintenance occupations.
Among the 116 million civilian employed native born ages 16 and older, 37 percent worked in management, professional, and related occupations; 17 percent worked in service occupations; 26 percent worked in sales and office occupations; 11 percent worked in production, transportation, and material moving occupations; and 8 percent worked in natural resources, construction, and maintenance occupations.
Note: The percentages might not add up to 100 due to rounding.
- For more information on national and state-level trends regarding foreign-born workers, see the "Workforce" data sheet of the ACS/Census data tool.
- The 2010 data on the foreign and native born are from the American FactFinder of the Census Bureau.
- What were the top five states in terms of the number of immigrants, share of immigrants in the total state population, absolute growth, and percent growth between 1990 and 2000 and between 2000 and 2010?
- What were the top ten U.S. counties in terms of number of immigrants, share of immigrants in the total county population, absolute growth, and percent growth between 2000 and 2010?
What were the top five states in terms of the number of immigrants, share of immigrants in the total state population, absolute growth, and percent growth between 1990 and 2000 and between 2000 and 2010?
In 2010, the top five U.S. states by the number of immigrants were California (10.1 million), New York (4.3 million), Texas (4.1 million), Florida (3.7 million), and New Jersey (1.8 million).
When classified by the share of immigrants in the total state population, the top five states in 2010 were California (27 percent), New York (22 percent), New Jersey (21 percent), Florida (19 percent), and Nevada (19 percent).
Between 1990 and 2000, the five states with the largest absolute growth of the immigrant population were California (2.4 million), Texas (1.4 million), New York (1.1 million), Florida (1 million), and Illinois (577,000).
Between 2000 and 2010, the five states with the largest absolute growth of the immigrant population were California (1.3 million), Texas (1.2 million), Florida (987,000), New York (429,000), and New Jersey (368,000).
Between 1990 and 2000, the five states with the largest percent growth* of the immigrant population were North Carolina (about 274 percent), Georgia (233 percent), Nevada (202 percent), Arkansas (196 percent), and Utah (about 171 percent).
However, between 2000 and 2010, the five states with the largest percent growth* of the immigrant population were Alabama (92 percent), South Carolina (88 percent), Tennessee (82 percent), Arkansas (79 percent), and Kentucky (75 percent).
Note: *In some states, the starting population of the foreign born was rather small. Thus, relatively small absolute increases in the immigrant population in these states have translated into high percent growth.
- For more information on the foreign born by state, see the MPI Data Hub's State Ranking tables.
What were the top ten U.S. counties in terms of number of immigrants, share of immigrants in the total county population, absolute growth, and percent growth between 2000 and 2010?
In 2010, the top ten counties by the number of immigrants were Los Angeles County, CA (3,490,000); Miami-Dade County, FL (1,302,000); Cook County, IL (1,093,000); Queens County, NY (1,066,000); Harris County, TX (1,044,000); Kings County, NY (948,000); Orange County, CA (919,000); San Diego County, CA (728,000); Santa Clara County, CA (663,000); and Maricopa County, AZ (570,000).
When classified by the share of immigrants in the total county population, the top ten counties in 2010 were Miami-Dade County, FL (52 percent); Queens County, NY (48 percent); Hudson County, NJ (42 percent); Kings County, NY (38 percent); Santa Clara County, CA (37 percent); San Francisco County, CA (36 percent); Los Angeles County, CA (36 percent); San Mateo County, CA (35 percent); Bronx County, NY (34 percent); and Imperial County, CA (32 percent).
Between 2000 and 2010, the ten counties with the largest absolute growth of immigrants were Harris County, TX (287,000); Riverside County, CA (199,000); Clark County, NV (176,000); Miami-Dade County, FL (154,000); Broward County, FL (148,000); Maricopa County, AZ (129,000); King County, WA (126,000); San Diego County, CA (122,000); San Bernardino County, CA (121,000); and Palm Beach County, FL (110,000).
Between 2000 and 2010, the ten counties with the largest absolute decline of immigrants were Arlington County, VA (-4,000); Bristol County, MA (-3,500); Niagara County, NY (-1,700); LaSalle County, IL (-1,300); Chelan County, WA (-1,300); Jones County, MI (-1,100); Aroostook County, ME (-1,000); Ashtabula County, OH (-1,000); Pennington County, SD (-1,000); and St. Clair County, MI (-850).
Between 2000 and 2010, the ten counties with the largest percent growth* of the immigrant population were St. Clair County, AL (433 percent); Forsyth County, GA (335 percent); Christian County, MO (310 percent); Hendricks County, IN (294 percent); Paulding County, GA (274 percent); Delaware County, OH (271 percent); Scott County, MN (269 percent); Loudoun County, VA (265 percent); Henry County, GA (261 percent); and Livingston Parish, LA (252 percent).
Note: The above county-level data are from the 2010 one-year estimates of the American Community Survey, which, for confidentiality and sampling reasons, reports information only for 806 out of 3,143 U.S. counties. It is likely that the county rankings would be different if information on all counties were available. *In some counties, the starting population of the foreign born was rather small. Thus, relatively small absolute increases in the immigrant population in these counties have translated into high percent growth.
|
Definitions
|
||
|
Children with Immigrant Parents
- How many children in the United States have immigrant parents?
- How has the number of children with immigrant parents changed?
- What are the top five states in terms of the number of children with immigrant parents?
- What are the top five states when looking at the share of children with immigrant parents in the state's total child population?
- What are the top five states in terms of the absolute growth of the number of children with immigrant parents?
- What are the top five states in terms of the percent growth of the number of children with immigrant parents between 1990 and 2000 and between 2000 and 2010?
How many children in the United States have immigrant parents?
In 2010, nearly 17 million children ages 17 and under lived at home with at least one immigrant parent. They accounted for 24 percent of the 70.6 million children ages 17 and under in the United States.
The 14.6 million second-generation children — those who were born in the United States to at least one foreign-born parent — accounted for 86 percent of all children with immigrant parents. The remaining 14 percent (2.4 million) were children born outside the United States to foreign-born parents.
- For more information on children with immigrant parents, including both first- and second-generation children, by state, see the MPI Data Hub's Children with Immigrant Parents table.
- Read more about second-generation immigrant children in this special issue from the Migration Information Source.
How has the number of children with immigrant parents changed?
Between 1990 and 2000, the number of children ages 17 and under with immigrant parents grew 60 percent from 8.2 million to 13.1 million. Between 2000 and 2010, the number grew 30 percent from 13.1 million to almost 17 million.
Between 1990 and 2000, the number of first-generation immigrant children grew by 43 percent (from 1.9 million to 2.7 million). In contrast, the number of first-generation immigrant children declined 12 percent between 2000 and 2010, from 2.7 million to 2.4 million.
The number of second-generation immigrant children has grown steadily since 1990. Between 1990 and 2000, the number of second-generation immigrant children grew 65 percent from 6.3 million to 10.4 million. Between 2000 and 2010, the number of second-generation immigrant children grew by 40 percent from 10.4 million to 14.6 million.
In 1990, children with immigrant parents were 13 percent of all children, compared to 19 percent in 2000 and 24 percent in 2010. The share of second-generation children among all children with immigrant parents has grown from 77 percent in 1990 to 80 percent in 2000 and to 86 percent in 2010.
What are the top five states in terms of the number of children with immigrant parents?
In 2010, the top five U.S. states by the total number of children with immigrant parents were California (4.4 million), Texas (2.2 million), New York (1.4 million), Florida (1.2 million), and Illinois (775,000). These five states accounted for 59 percent of all children with immigrant parents residing in the nation in 2010.
What are the top five states when looking at the share of children with immigrant parents in the state's total child population?
In terms of the share of children with immigrant parents, the top five states in 2010 were California (50 percent of all children in the state), Nevada (37 percent), New York (34 percent), New Jersey (34 percent), and Texas (nearly 34 percent).
What are the top five states in terms of the absolute growth of the number of children with immigrant parents?
Between 1990 and 2000, the five states with the largest absolute growth of the total number of children with immigrant parents were California (1.3 million), Texas (643,000), Florida (384,000), New York (366,000), and Illinois (231,000).
Between 2000 and 2010, the five states with the largest absolute growth of the total number of children with immigrant parents were Texas (667,000), California (326,000), Florida (262,700), Georgia (231,000), and North Carolina (197,000).
What are the top five states in terms of the percent growth of the number of children with immigrant parents between 1990 and 2000 and between 2000 and 2010?
Between 1990 and 2000, the five states with the largest percent growth of the total population of children with immigrant parents were Nevada (about 233 percent), North Carolina (about 224 percent), Georgia (about 194 percent), Nebraska (174 percent), and Arkansas (170 percent).
Between 2000 and 2010, the five states with the largest percent growth of the total population of children with immigrant parents were Tennessee (about 122 percent), North Carolina (about 118 percent), Alabama (111 percent), Arkansas (about 108 percent), and South Carolina (about 108 percent).
- How many foreigners (in all categories) obtained U.S. lawful permanent residence in 2010?
- In which categories did permanent immigrants enter in 2010?
- Which countries did permanent immigrants come from in 2010?
- How many people applied for permanent immigration to the United States through the green-card lottery in 2010?
- What was the total number of nonimmigrant admissions to the United States in 2010?
- How did nonimmigrant admissions break down by visa category in 2010?
- How many visas did the Department of State issue in 2010?
- How many foreign born came as refugees in 2010, and where were they from?
- How many foreign born came as asylees in 2010, and where were they from?
How many foreigners (in all categories) obtained U.S. lawful permanent residence in 2010?
In 2010, 1,042,625 foreign nationals became lawful permanent residents (LPRs), also known as green-card holders, according to the Department of Homeland Security's Yearbook of Immigration Statistics 2010. The total number represents almost an 8 percent decrease from 2009 (1,130,818), but an approximately 24 percent increase from 2000 (841,002).
New arrivals comprised approximately 46 percent (or 476,049) of those granted lawful permanent residence in 2010. The majority of new LPRs (566,576, or 54 percent) were status adjusters – immigrants who were already living in the United States in any year before 2010, but whose green-card applications were approved during 2010. Most status adjusters were formerly one of the following: refugees, asylees, temporary workers, foreign students, family members of U.S. citizens or green-card holders, or unauthorized immigrants.
- See the Department of Homeland Security's Yearbook of Immigration Statistics 2010
- See the chart Legal Immigration to the United States: Fiscal Years 1820 to 2010.
In which categories did permanent immigrants enter in 2010?
Of the roughly 1 million new lawful permanent residents in 2010, 46 percent were an immediate relative of a U.S. citizen, 21 percent came through a family-sponsored preference, and 14 percent entered through an employment-based preference. Another 13 percent adjusted from a refugee or asylee status, and almost 5 percent were diversity-lottery winners.
- Read about immigration preferences here.
Which countries did permanent immigrants come from in 2010?
The top five countries of birth for new LPRs in 2010 were Mexico (13 percent), China (7 percent), India (7 percent), the Philippines (6 percent), and the Dominican Republic (5 percent). Approximately 391,000 new lawful permanent residents were from one of the top five countries of birth, accounting for almost 38 percent of all persons who received lawful permanent resident status in 2010.
Persons born in the next five countries — Cuba (3 percent), Vietnam (almost 3 percent), Haiti (2 percent), Colombia (2 percent), and Korea (South and North) (2 percent) — made up almost 13 percent of all lawful permanent residents, so that the top ten countries of birth made up half of the total.
- Read more about lawful permanent residents in 2010 in the Spotlight on Green Card Holders and Legal Immigration to the United States.
How many people applied for permanent immigration to the United States through the green-card lottery in 2010?
The Immigration Act of 1990 established the Diversity Visa Lottery (also known as the green-card lottery) to allow entry to immigrants from countries with low rates of immigration to the United States. The act states that no more than 55,000 diversity visas are made available each fiscal year. Of the 55,000 visas, 5,000 have to be used for applicants under the Nicaraguan and Central America Relief Act of 1997, thus reducing the available number to 50,000.
Before receiving permission to immigrate to the United States, lottery winners must provide proof of a high school education or its equivalent or show two years of work experience within the past five years in an occupation that requires at least two years of training or experience. They also have to pass a medical exam.
According to the U.S. Department of State, applicants registered for the DV-2012 program were selected at random from 14.8 million qualified entries (not including applicants' spouses and children) received between October 5 and November 3, 2010.
The number of qualified entries totaled 5.6 million in the DV-2007 lottery, 6.5 million in the 2008 lottery, 9.1 million in the 2009 lottery, 9.5 million in the 2010 lottery, and 12 million in the 2011 lottery. (The Department of State does not release the total number of applications received, only the number of qualified entries.)
While the number of qualified entries from a given country of origin fluctuates from year to year, one country clearly stood out: The number of entries received from Bangladesh increased from 18 percent (or 1 million) of the total 5.6 million entries in the DV-2007 lottery to 52 percent (or 7.7 million) of the total 14.8 million entries in the DV-2012. However, for DV-2013, Bangladesh will join 18 other countries whose nationals have been deemed ineligible to apply since each sent a total of more than 50,000 immigrants to the United States in the past five years. Meanwhile, Poland and South Sudan have become eligible for the DV-2013 lottery.
- Check out the full list of qualified entries by country for DV-2007 to DV-2012 here.
What was the total number of nonimmigrant admissions to the United States in 2010?
The total number of nonimmigrant admissions for 2010 was approximately 160 million. However, an estimated 113.5 million admissions were exempt from completing the I-94 arrival/departure form at the port of entry. (The I-94 exempted admissions are from two groups: Canadians who travel to the United States for business or pleasure, and Mexicans who possess a nonresident Border Crossing Card [i.e., laser visa]).
Temporary admissions of I-94 nonimmigrants to the United States nearly tripled from 17.6 million in 1990 to 46.5 million (not including the admission of exempt Mexicans and Canadians) in 2010. Total temporary admissions of I-94 nonimmigrants also increased from 36.2 million to 46.5 million from 2009 to 2010, which is an overall increase of 28 percent. However, the uptake in large part has to do with the addition of technology systems that now record some land admissions (along both borders) that were previously excluded from the I-94 data collection.
Note: Nonimmigrant admissions represent the number of arrivals, not the number of individuals admitted to the United States. The Department of Homeland Security only reports characteristics of nonimmigrants that have to complete an I-94 arrival/departure form.
How did nonimmigrant admissions break down by visa category in 2010?
As in the past, temporary visitors (tourists and business travelers). accounted for an overwhelming majority of all arrivals. In 2010, they represented 87 percent (40.3 million) of all admissions to the United States. Of those, 35.1 million were tourist admissions and 5.2 million were business-traveler admissions.
Temporary workers and trainees, including H-1B "specialty occupation" workers, registered nurses, temporary agricultural workers, North American Free Trade Agreement (NAFTA) professional workers, treaty traders, and intracompany transferees, among others, accounted for 2.8 million arrivals (6 percent of total admissions); this figure includes spouses and children of all temporary workers and trainees.
Students who came to the United States to study at academic or vocational institutes, with their family members, made up about 4 percent (more than 1.6 million) of the total arrivals.
- Read more about temporary admissions in 2010 in Temporary Admissions of Nonimmigrants to the United States.
How many visas did the Department of State issue in 2010?
The U.S. Department of State reports the number of visas issued to foreign nationals who wish to come to the United States for the purpose of traveling, conducting business, working, studying, and for other reasons.
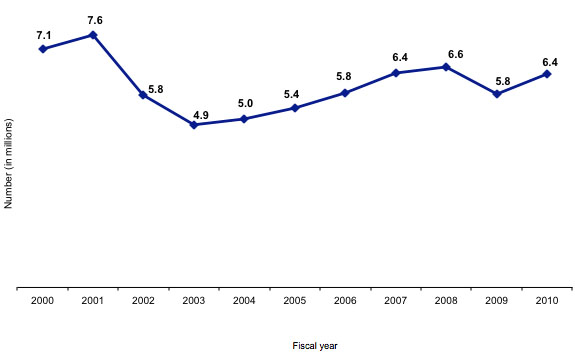
In 2010, the Department of State issued 6,422,751 nonimmigrant visas, which is an 11 percent increase from the 5,804,182 issued in 2009. The 2010 figure is lower than the decade's peak of 7,588,778 visas in 2001, but higher than the decade's bottom of 4,881,632 visas issued in 2003 (see Figure 2).
|
Figure 2. Nonimmigrant Visas Issued by Fiscal Year (in millions), 2000-2010
|
||
|
The vast majority (72 percent) of nonimmigrant visas issued in 2010 were temporary business and tourist visas (B-1, B-2, BCC, and BCV visas). The next largest visa class (F-1, F-2, and F-3) was for academic students and exchange visitors and their family members, comprising more than 6 percent of all nonimmigrant visas issued, followed by the J-1 and J-2 visa categories for exchange visitors and their spouses and children (almost 6 percent).
The distribution of the 6.4 million visas issued to foreign nationals in 2010 by region shows that majority of temporary visas were issued to nationals from Asia (36 percent) and North America (24 percent, including Central America and the Caribbean), followed by South America (20 percent), Europe (14 percent), Africa (5 percent), and Oceania (1 percent).
|
Notes on Refugees and Asylees
|
||
|
Note: The number of visas issued does not necessarily match the number of foreign nationals who came to the United States in the same year because some nonimmigrant visas may not be used.
- For more information, see the Department of State publication Report of the Visa Office 2010.
How many foreign born came as refugees in 2010, and where were they from?
In 2010, 73,293 refugees were admitted to the United States, marking a roughly 2 percent decrease from 2009 (74,602). Iraq, Burma, and Bhutan were the primary countries of nationality for refugees admitted to the United States in both 2009 and 2010, representing nearly 64 percent (47,072) of all refugees admitted in 2010.
Each year, the President and Congress set the annual refugee admissions ceiling and regional allocations. In 2010, the ceiling was kept at 80,000, and the Near East/South Asia regions received almost half of the total regional allocations (38,000) in response to the refugee crises in Iraq and Burma. Altogether, nationals of the top ten countries made up 92 percent of all refugee arrivals in 2010. In addition to the top three, these countries include Somalia, Cuba, Iran, the Democratic Republic of Congo, Eritrea, Vietnam, and Ethiopia.
How many foreign born came as asylees in 2010, and where were they from?
The number of foreign born who were granted asylum in 2010 was 21,113 (11,244 affirmatively and 9,869 defensively). This represents a 4 percent decrease from the corresponding number in 2009 (22,090).
The leading countries of nationality for asylees in 2010 were the People's Republic of China (6,683), Ethiopia (1,093), and Haiti (832). The three countries accounted for about 41 percent of all people grantsed asylum in 2010, with China accounting for almost 32 percent of all asylees and Ethiopia and Haiti comprising 9 percent together. Asylees from Venezuela (660), Nepal (640), Colombia (591), Russia (548), Egypt (536), Iran (485), and Guatemala (465) accounted for another 19 percent. Together, nationals of these ten countries made up almost 60 percent of all individuals who received asylum status in 2010.
- Read the Spotlight on Refugees and Asylees in the United States
- How many unauthorized immigrants are in the United States?
- Where are unauthorized migrants from?
- How many children have unauthorized immigrant parents?
- How has illegal immigration responded to the economic crisis in the United States?
- How many apprehensions were there in 2010?
- How many people were deported in 2010?
How many unauthorized immigrants are in the United States?
According to the Department of Homeland Security's Office of Immigration Statistics (OIS), an estimated 11.5 million unauthorized immigrants resided in the United States as of January 2011. The estimates, released in March 2012, suggest that the unauthorized population is virtually unchanged compared to the revised 2010 estimate of 11.6 million. The largest shares of the 11.5 million unauthorized immigrants resided in California (25 percent), Texas (16 percent), and Florida (6 percent). Arizona and Georgia — two states that recently passed immigration enforcement laws — are home to 3 percent and 4 percent of the nation’s unauthorized immigrants, respectively. Between 2000 and 2011, Georgia’s unauthorized population nearly doubled (from 220,000 to 440,000 or by 95 percent), while the population in Arizona increased by 9 percent during the same period (from 330,000 to 360,000). These figures can be compared to 36 percent growth between 2000 and 2011 at the national level.
The Pew Hispanic Center (PHC) has also produced estimates of the size and characteristics of the unauthorized immigrant population. According to PHC, there were 11.2 million unauthorized immigrants in the United States as of March 2010, accounting for nearly 28 percent of the total foreign-born population, about 4 percent of the entire U.S. population, and approximately 5 percent (or 8 million) of U.S. workers.
Note: The data sources and estimating methodologies used by OIS and PHC to describe the unauthorized population are different. Hence the estimates are not fully comparable, and we urge our readers not to mix them. The two organizations cover somewhat different topics. For instance, OIS has estimates on the unauthorized population by period of entry, origin, state of residence, age, and sex. In addition to covering trends over time, PHC's fact sheet on unauthorized immigrants includes national and state-level estimates of the unauthorized labor force, as well as data on children with unauthorized parents.
Where are unauthorized migrants from?
According to OIS estimates, about 8.9 million unauthorized immigrants were born in North America (which includes Mexico, Central America, the Caribbean, and Canada). About 1.3 million were from Asia, 0.8 million from South America, 0.3 million from Europe, and 0.2 million from the remaining parts of the world. Mexico (59 percent), El Salvador (6 percent), and Guatemala (5 percent) were the top three countries of birth of the unauthorized immigrant population.
- See Table 3 in the OIS report for the top ten countries of birth of the unauthorized in the United States.
How many children have unauthorized immigrant parents?
About 5.5 million children in 2010 had at least one parent who was an unauthorized immigrant, according to the Pew Hispanic Center. Of this group, about 82 percent (4.5 million) were U.S. citizens by birth and 18 percent (1 million) were unauthorized immigrants themselves. The number of children with unauthorized immigrant parents has more than doubled since 2000, when there were just 3.6 million such children. However, over the same period, the number of unauthorized immigrant children declined from 1.5 to 1.1 million, while the number of U.S.-born children with unauthorized immigrant parents grew from 2.1 to 4.5 million.
- Read the Pew Hispanic Center's most recent fact sheet on unauthorized immigrants.
How has illegal immigration responded to the economic crisis in the United States?
Research by the Migration Policy Institute and others in the United States and other countries indicates that, along with temporary migrant workers, flows of unauthorized immigrants are most closely linked to the economy and thus the ones most likely to fall in poor economic times.
Data from the Pew Hispanic Center show that the annual flow of unauthorized immigrants from Mexico has declined from about 500,000 per year between March 2000 and March 2005 to about 325,000 per year between March 2005 and March 2007 and to about 150,000 per year between March 2007 and March 2009. The population remained virtually unchanged between 2009 and 2010.
The unauthorized immigrant population from Mexico appears to have declined, although the change is not statistically meaningful. This finding is reinforced by U.S. Border Patrol apprehension data and Mexican government surveys. However, the change in the unauthorized immigrant population from other regions of Latin America (excluding Mexico) did definitively decline in 2009, from 2.5 to 2.2 million people. The unauthorized immigrant population from other regions of the world beyond Latin America has remained stable, between 2 million and 2.3 million, for much of the last decade.
- For more information on how various immigration streams responded to the financial downturn in the United States and around the world, read MPI's 2010 report Migration and Immigrants Two Years after the Financial Collapse: Where Do We Stand?
- Read more about Mexican immigrants during the recession in this Pew Hispanic Center report.
How many apprehensions were there in 2010?
There were over half a million apprehensions in 2010 (516,992). Approximately 90 percent of all apprehensions are reported by the Border Patrol, and 97 percent of Border Patrol apprehensions occurred along the Southwest border.
Between 2000 and 2005, the number of border apprehensions fluctuated — decreasing between 2000 and 2003, then increasing in 2004 and 2005. Since 2005, however, the number has steadily decreased from 1,291,142 to 516,992 in 2010.
The 2010 figure is the lowest since 1972, when 505,949 unauthorized immigrants were apprehended. The leading countries of nationality of those apprehended were Mexico, Guatemala, El Salvador, and Honduras. Nationals from these four countries comprised 94 percent of all apprehensions, with Mexican nationals comprising the overwhelming majority of apprehensions (83 percent).
Note: Apprehensions are events, not individuals. In other words, the same individual can be apprehended more than once.
How many people were deported in 2010?
Foreign-born individuals who have to leave the United States are categorized as either "removals" or "returns." Both removals and returns result in the departure of a foreign-born individual from the United States. Combined removals and returns in 2010 totaled 863,647 -- the lowest within the last two decades. They were 12 percent lower than in 2009 (981,329) and 54 percent lower than the decade's highest number of 1,864,343 in 2000
In 2010, returns accounted for 55 percent of the 863,647 total removals and returns, while removals comprised 45 percent of the total. Returns in 2010 made up a smaller share of the combined removals and returns than they have since 1941, when returns accounted for 47 percent (6,531) of total removals and returns
Notes: Removals are the compulsory and confirmed movement of an inadmissible or deportable unauthorized immigrant out of the United States based on an order of removal. An unauthorized immigrant who is removed has administrative or criminal consequences placed on subsequent reentry owing to the fact of the removal. Returns are the confirmed movement of an inadmissible or deportable unauthorized immigrant out of the United States not based on an order of removal. Most of the voluntary departures are of Mexican nationals who have been apprehended by the U.S. Border Patrol and are returned to Mexico.
The government fiscal year runs from October 1 to September 30. All figures for immigration control and enforcement given here are for the government fiscal year.
- Read the Spotlight on Immigration Enforcement in the United States.
Immigration Control and Enforcement
- How much does the government spend on immigration control and enforcement?
- How many Border Patrol agents are there?
How much does the government spend on immigration control and enforcement?
Funding for the Border Patrol, which was part of the Immigration and Naturalization Service until the agency was subsumed into the new Department of Homeland Security in 2003, increased 519 percent between 1986 and 2002, from $268 million to $1.6 billion. The Border Patrol is responsible for enforcing 8,000 miles of U.S. land and water boundaries between legal points of entry (designated points where immigration officials can regulate entry).
Following the creation of the Department of Homeland Security (DHS), the Border Patrol became part of U.S. Customs and Border Protection (CBP), an agency within DHS.
CBP's responsibilities include regulating and facilitating international trade, collecting import duties, enforcing U.S. trade laws, and protecting U.S. agricultural and economic interests from pests and diseases.
According to DHS annual budgets from various years, the total CBP budget (gross discretionary and mandatory, fees, and trust funds) was $5.9 billion in fiscal year (FY) 2003. The agency's budget increased 32 percent to $7.7 billion in FY 2007 and then by another 52 percent to $11.7 billion in FY 2012. The president requested nearly $12 billion for the FY 2013 budget. CBP has the highest budget of all DHS agencies.
U.S. Immigration and Customs Enforcement (ICE) is the investigative branch of DHS and is responsible for enforcing immigration laws. In FY 2003, the total ICE budget was $3.3 billion. The budget rose 44 percent to $4.7 billion by FY2007 and another 25 percent to $5.9 billion by FY 2012. The president requested a budget decrease for ICE in FY2013, reducing the total to slightly more than $5.6 billion.
- For information on border-enforcement spending within DHS and by immigration agency, read MPI's DHS and Immigration: Taking Stock and Correcting Course.
How many Border Patrol agents are there?
The number of Border Patrol agents has more than doubled since 2004, from approximately 10,000 to over 21,000 in 2012. The 2012 budget includes funding for 21,370 Border Patrol agents and 21,186 CBP officers who work at ports of entry across the nation. The 2013 budget requested by the president maintains funding for an equal number of Border Patrol agents and officers that were provided for in 2012.
- Read the Department of Homeland Security's 2013 Budget in Brief.
- How many foreign born are naturalized citizens?
- How many immigrants naturalized in 2010?
- How many foreigners became U.S. citizens through military naturalization in 2010?
- What are the countries of origin of newly naturalized citizens?
- Where do newly naturalized citizens live in the United States?
How many foreign born are naturalized citizens?
Of the 40 million foreign born residing in the United States in 2010, 17.5 million (44 percent) were naturalized citizens according to the 2010 American Community Survey estimates.
How many immigrants naturalized in 2010?
According to data from the Department of Homeland Security (DHS), U.S. Citizenship and Immigration Services naturalized 619,913 lawful permanent residents in 2010. The number of immigrants naturalized decreased by almost 17 percent between 2009 and 2010.
From a historical perspective, the number of naturalizations has increased dramatically in recent decades. On average, 141,000 lawful permanent residents naturalized each year between 1970 and 1979, 205,000 on average per year in the 1980s, 498,000 per year on average in the 1990s, and 682,000 per year on average during the 2000s.
The number of naturalizations reached an all-time high in 2008 (1,046,539) before falling by almost 29 percent in 2009. The sharp increase in naturalizations of about 58.5 percent between 2007 and 2008 (from 660,477 to 1,046,539) is a result of the promotion of naturalization during the 2008 presidential elections and impending increases in the fees assessed for applicants, which worked to encourage a surge in applications for naturalizations during that time period.
- For more background information on naturalization trends, see the Spotlight on Naturalization Trends.
How many foreigners became U.S. citizens through military naturalization in 2010?
In 2010, 9,122 foreign-born military personal naturalized as U.S. citizens on U.S. soil, overseas, or aboard Navy ships. This was the largest number of military personnel naturalized in any single year since 1972, when the U.S. military was engaged in the Vietnam War.
What are the countries of origin of newly naturalized citizens?
Of those who naturalized in 2010, 11 percent were born in Mexico (67,062), almost 10 percent in India (61,142), and almost 6 percent in the Philippines (35,465). Immigrants from these three countries, together with those from China (33,969), Vietnam (19,313), Colombia (18,417), the Dominican Republic (15,451), Cuba (14,050), Haiti (12,291), and Jamaica (12,070), comprised the top ten countries of birth for newly naturalized citizens in 2010 and accounted for approximately 47 percent of all naturalizations that year.
Where do newly naturalized citizens live in the United States?
In 2010, half of all newly naturalized citizens lived in one of four states. California is the state with the largest number of newly naturalized citizens, comprising almost 21 percent (129,354), of the total newly naturalized. Eleven percent (67,972) of the newly naturalized resided in New York in 2010, approximately 11 percent lived in Florida (67,484), and 8 percent resided in Texas. (49,699).
Almost 15 percent of those who naturalized in 2010 lived in the greater New York metropolitan area (91,257), 8 percent in the greater Los Angeles metropolitan area (51,977), and almost 7 percent in the greater Miami metropolitan area (42,220). These areas, together with Chicago (4 percent), the greater Washington, DC metropolitan area (4 percent), San Francisco (3 percent), Houston (3 percent), Boston (almost 3 percent), Dallas (almost 3 percent), and Atlanta (almost 3 percent), were home to more than 50 percent of new U.S. citizens in 2010.
- How many naturalization applications are still pending a decision
- How many visa applications for permanent immigration (green cards) are backlogged?
How many naturalization applications are still pending a decision?
The number of naturalization applications pending a decision was 290,000 as of the end of 2010, a 40 percent decrease compared to the 480,000 pending at the end of 2008.
How many visa applications for permanent immigration (green cards) are backlogged?
Two types of backlogs impact issuance of green cards. The first is due to visa availability. The government caps world-wide employment-based permanent visas for foreign workers and their families, for example, at 140,000 per year. Also, no country can receive more than 7 percent of the total annual number of family-sponsored and employment-based visas (approximately 25,600 visas).
The second type of backlog is due to processing delays of applicants' documents, which is related to the government's lack of financial and human resources as well as increased scrutiny.
Once the Department of State grants a visa to an immigrant, U.S. Citizenship and Immigration Services and the Federal Bureau of Investigation conduct background checks.
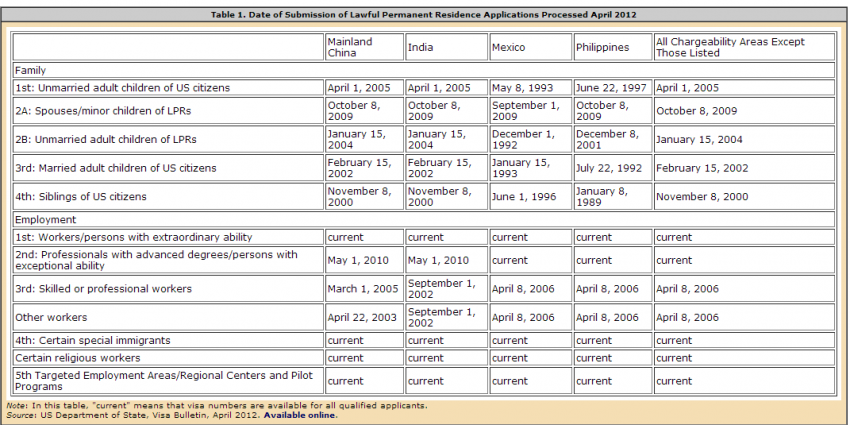
As of March 2012, U.S. Citizenship and Immigration Services was processing some family-related visas applications filed as far back as January 1989, and it was still processing some employment-related visa applications from September 2002.
A U.S. citizen wishing to sponsor an unmarried adult child from Mexico, for instance, has to wait about 19 years before the application will be processed, and a U.S. citizen wishing to sponsor a sibling from the Philippines has to wait 23 years (see Table 1). However, recent years have witnessed dramatic reductions in the backlogs for certain categories of immigrants, particularly the immediate family members (spouses and children) of lawful permanent residents.