

Haitian Immigrants in the United States

Mysterypill/Flickr
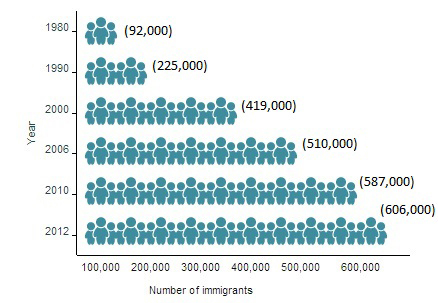
Immigrants from Haiti represent a small but growing share of the total foreign-born population in the United States, tripling in number between 1990 and 2012. Haitian migration to the United States was very small several decades ago, with the population estimated at approximately 5,000 in 1960. Haitians began arriving in the United States in larger numbers after Haiti descended into chaos following the collapse of the Duvalier dictatorship in the late 1980s. The Haitian immigrant population stood at 606,000 in 2012, up from 200,000 in 1990; Haitians now constitute 1.5 percent of the total U.S. foreign-born population.
|
Figure 1. Haitian Immigrant Population in the United States, 1980-2012
|
|
Source: Data from U.S. Census Bureau 2006, 2010, and 2012 American Community Surveys (ACS), and 1980, 1990, and 2000 Decennial Census. |
The Haitian immigrant population in the United States is the fourth largest immigrant group from the Caribbean after immigrants from Cuba, the Dominican Republic, and Jamaica. Click here to view how the number of immigrants from Haiti and other countries has changed over time.
The vast majority of Haitian immigrants are in the United States, with populations also in France (77,000), Canada (74,000), and the Bahamas (40,000). Click here to see where immigrants from Haiti have settled internationally.
|
Definitions
|
|
|
Following the devastating earthquake in Haiti on January 12, 2010, which claimed many tens of thousands of lives (estimates vary from 46,000 to 316,000) and displaced more than 1.5 million people initially, Haiti was added by the U.S. government to the list of Temporary Protected Status (TPS) designated countries. TPS beneficiaries are temporarily granted relief from deportation and given work authorization until their TPS designation expires. For Haiti, TPS has been extended through January 22, 2016. To date, TPS has been offered to about 58,000 qualifying Haitian immigrants living in the United States. The population growth detected in the 2011 and 2012 American Community Surveys (ACS) taken by the U.S. Census Bureau would suggest that concerns that the earthquake would prompt mass emigration from the devastated country have not materialized.
Employing the most recent data available from the U.S. Census Bureau’s ACS and the U.S. Department of Homeland Security, this spotlight provides information on immigrants from Haiti, examining the size of the population, geographic distribution, and socioeconomic characteristics. The article also uses World Bank data to highlight remittances trends.
Click on the bullet points below for more information:
- Distribution by State and Key Cities
- English Proficiency
- Educational and Professional Attainment
- Income and Poverty
- Immigration Pathways and Naturalization
- Health Coverage
- Diaspora
- Remittances
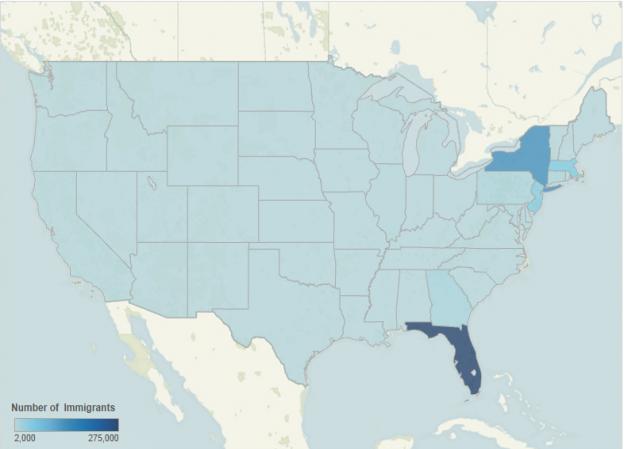
The foreign born from Haiti residing in the United States were most concentrated in Florida and New York. These two states were home to more than 70 percent of Haitian immigrants in the 2008-12 period.
|
Figure 2. Top Destination States for Haitian Immigrants in the United States, 2008-12
|
|
Note: Pooled 2008-12 ACS data were used to get statistically valid estimates at the state and metropolitan statistical area levels, for smaller-population geographies. |
Visit the MPI Data Hub Population Distribution for Regions and Countries of Birth by State and Country Map to view the states and counties in which immigrants from Haiti reside. Select Haiti from the dropdown menu.
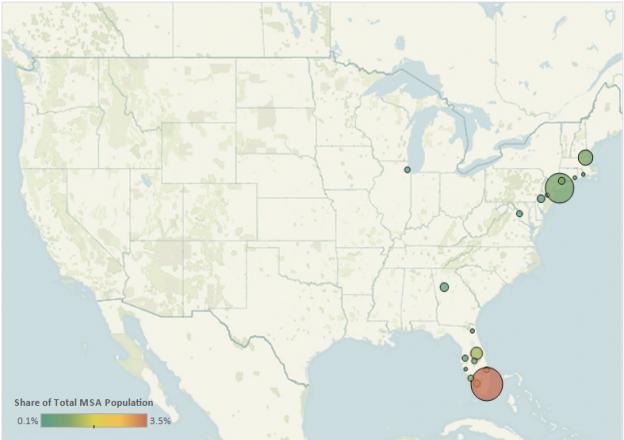
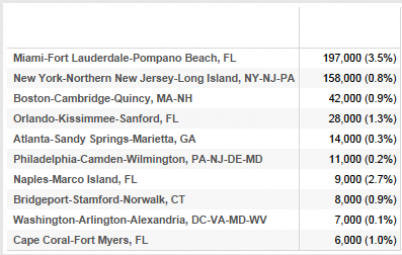
The major metropolitan areas where Haitian immigrants resided include the greater Miami, New York, Boston, Orlando, and Atlanta areas. These five metro areas accounted for nearly three-quarters of the total immigrant population from Haiti residing in the United States.
|
Figure 3. Top Destination Metropolitan Areas for Haitian Immigrants in the United States, 2008-12
|
|
Source: MPI tabulation of data from U.S. Census Bureau pooled 2008-12 ACS. |
|
Top Haitian Concentrations by Metropolitan Area
|
|
Source: MPI tabulation of data from the U.S. Census Bureau pooled 2008-12 ACS. |
Click here to view the interactive map showing population distribution for regions and countries of birth by metropolitan statistical area. Select Haiti from the dropdown menu.
In 2012, the share of population (ages 5 and older) that was Limited English Proficient (LEP) was higher for immigrants from Haiti than those from the Caribbean overall (54 percent versus 43 percent). The LEP share for the total foreign-born population was 50 percent.
(Note: The term Limited English Proficient refers to any person age 5 and older who reported speaking English “not at all,” “not well,” or “well” on their survey questionnaire. Individuals who reported speaking only English or speaking English “very well” are considered proficient in English).
Educational and Professional Attainment
In 2012, approximately 18 percent of Haitian immigrants in the United States ages 25 and over had a bachelor's degree or higher. This proportion is nearly equivalent for the Caribbean immigrant population overall (19 percent) although lower than the corresponding share for the total foreign-born population (28 percent).
About 79 percent of Haitian immigrants were of working age (18-64) while close to 14 percent were ages 65 and older in 2012. The median age for Haitian immigrants was 45 years; slightly older than the overall foreign-born population (43 years).
Data from the Institute of International Education show that 934 students from Haiti were enrolled in U.S. universities in the 2012/13 academic year, a 5 percent increase from the 2011/12 academic year. This share represents approximately 8 percent of the total student population from the Caribbean (11,100).
|
Figure 4. Employed Immigrant Workers in the Civilian Labor Force (Ages 16 and Older) by Occupation and Origin, 2012
|
|
Source: MPI tabulation of data from the U.S. Census Bureau 2012 ACS. |
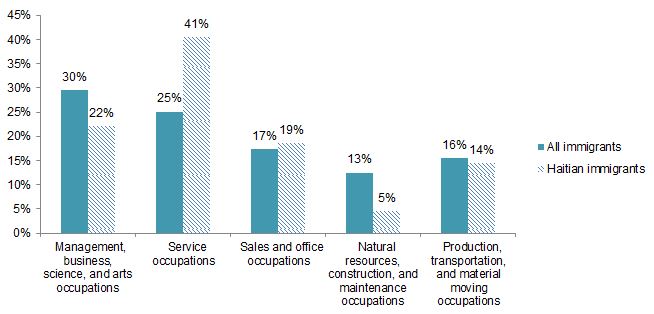
More than 40 percent of immigrant adults (ages 16 and older) from Haiti were employed in service occupations, compared to 25 percent of all immigrant adults.
The overall labor force participation rate of Haitian immigrants (16 and older) was only somewhat higher than that of all immigrants (71 percent versus 68 percent). However, Haitian immigrant women were much more likely to be engaged in the civilian labor force than all immigrant women (67 percent versus 56 percent).
Haitian immigrants were as likely to live in poverty (i.e., with incomes below 100 percent of the federal poverty level) as immigrants from the Caribbean (about 21 percent each). The share in poverty was slightly lower for the overall foreign-born population (19 percent).
Immigration Pathways and Naturalization
In 2012, approximately 606,000 Haitian immigrants resided in the United States. Of them, 50 percent were naturalized citizens, which was higher than the 46 share naturalized among all immigrants.
|
Figure 5. Haitian Immigrants in the United States by Period of Arrival, 2012
|
|
Source: MPI tabulation of data from the U.S. Census Bureau 2012 ACS. |
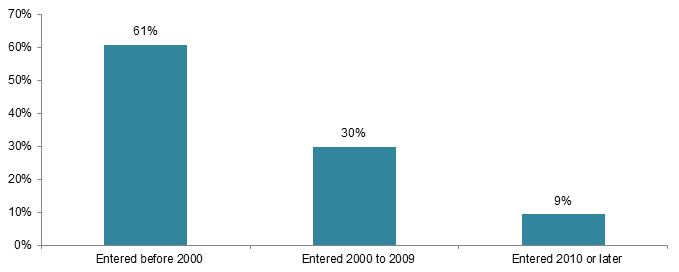
The majority of Haitian immigrants arrived in the United States before 2000 (61 percent), 30 percent between 2000 and 2009, and fewer than one-tenth since 2010.
DHS data show that on January 1, 2012, 260,000 of the 13.3 million lawful permanent residents (LPRs) residing in the United States (or about 2 percent) were from Haiti; 160,000 of these green-card holders from Haiti were eligible to become U.S. citizens but had not done so as of that date.
Most Haitians who received LPR status in 2012 were immediate relatives of U.S. citizens or other family-sponsored immigrants.
|
Figure 6. Immigration Pathways of Haitian Immigrants in the United States, 2012
|
|
Notes: Family-sponsored: Includes adult children and siblings of U.S. citizens as well as spouses and children of green-card holders. Immediate relatives of U.S. citizens: Includes spouses, minor children, and parents of U.S. citizens. The Diversity Visa Lottery: The Immigration Act of 1990 established the Diversity Visa Lottery to allow entry to immigrants from countries with low rates of immigration to the United States. The law states that 55,000 diversity visas are made available each fiscal year. |
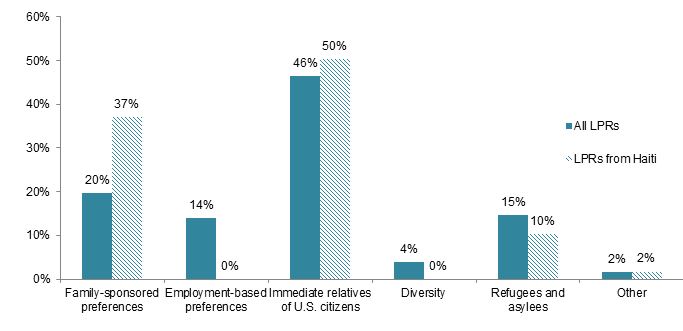
Of the 23,000 Haitians who received their green cards in 2012, the majority were much more likely to immigrate to the United States as spouses, minor children, or parents of U.S. citizens (50 percent) or other family-sponsored immigrants (37 percent) than the U.S. foreign-born population overall (46 percent and 20 percent, respectively). In contrast, virtually no Haitians received LPR status through employment-based pathway or by winning the Diversity Visa Lottery, while 14 percent and 4 percent respectively of all immigrants gaining LPR status in 2012 entered via those pathways.
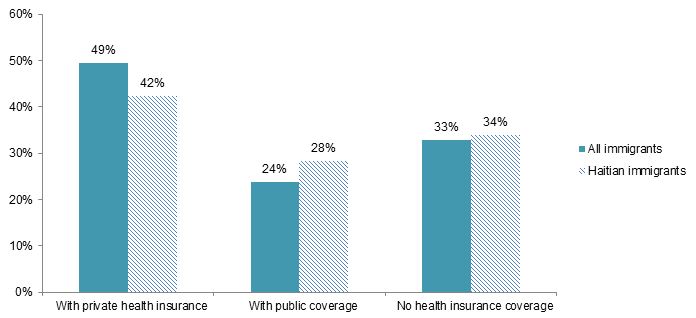
The foreign-born population from Haiti was almost as likely to be insured as the overall immigrant population. Haitian immigrants were less likely to have private health insurance coverage, but more likely to have public health insurance coverage than the total foreign-born population in the United States.
|
Figure 7. Haitian Immigrants in the United States by Type of Health Coverage, 2012
|
|
Note: The sum of shares by type of insurance is likely to be greater than 100 because people may have more than one type of insurance. |
The Haitian diaspora in the United States is comprised of approximately 954,000 individuals who were either born in Haiti or report Haitian ancestry, according to tabulation of data from the Census Bureau’s pooled 2008-12 ACS.
According to World Bank data, total remittances sent to Haiti via formal channels equaled $1.6 billion in 2012, representing 21 percent of the country's gross domestic product (GDP). The amount of remittances received by Haiti increased tenfold since the late 1980s.
|
Figure 8. Annual Remittance Flows to Haiti, 1970-2012
|
|
Source: MPI tabulations of data from the World Bank Prospects Group, “Annual Remittance Data,” October 2013 update. |
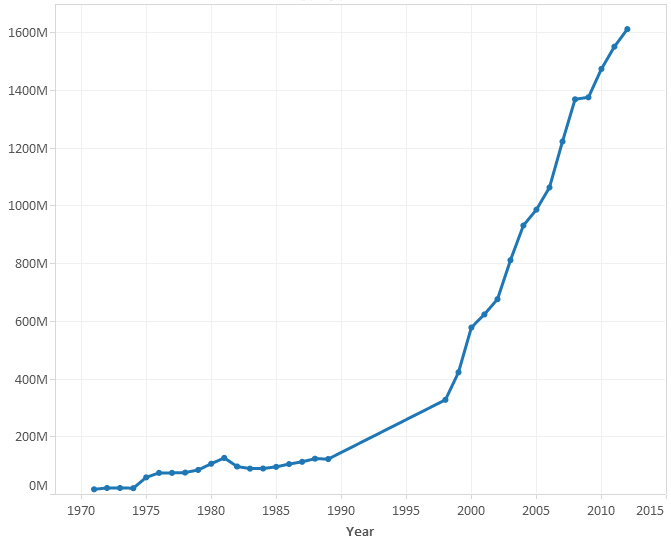
The Haitian diaspora in the United States transferred about $1.1 billion in remittances to Haiti in 2012.
Visit the Data Hub’s collection of interactive remittances tools, which track remittances by inflow and outflow, between countries, and over time.
Sources
Federal Register. 2014. Extension of the Designation of Haiti for Temporary Protected Status. 79 Federal Register 11808-11814, March 3, 2014. Available Online.
Institute of International Education. 2014. International Students: All Places of Origin, 2011/12 - 2012/13. Available Online.
Department of Homeland Security, Office of Immigration Statistics. Various years. Yearbook of Immigration Statistics. Available Online.
---. Various years. Annual Flow Reports. Available Online.
U.S. Citizenship and Immigration Services (USCIS). 2013. Estimates of the Legal Permanent Resident Population in 2012. Available Online.
World Bank Prospects Group. 2013. Migration and Remittances Data, October 2013 update. Available Online.
---. Bilateral Remittances Matrix, May 2013 version. Available Online.