

Central American Immigrants in the United States

Nicaraguan children in school holding their country's flag. (Photo: Peace Corps)
Haga clic aquí para leer este artículo en español.
Over the decades, several million Central America migrants have sought opportunity, refuge, and stability in the United States, driven by a mix of factors including battered economies, violence, corrupt governments, and the desire to reunite with relatives who emigrated earlier or to find a family-sustaining job. While media attention in recent years has focused on the arrival of unaccompanied minors and families, primarily from El Salvador, Guatemala, and Honduras, the lion’s share of the 3.8 million Central American immigrants in the United States as of 2019 have been in the country for at least a decade.
Displacement and economic instability caused by regional civil wars, in which the U.S. government had involvement, led many Central Americans to migrate in the 1980s. The wars ended, but economic instability remained—as did migration. The Central American immigrant population in the United States more than tripled between 1980 and 1990.
Hurricane Mitch in 1998 and two earthquakes in 2001 were among the factors further driving migration from El Salvador, Guatemala, Honduras, and Nicaragua. Similar factors have remained at work in recent years. In November 2020, Hurricanes Eta and Iota devasted the region, affecting as many as 11 million people throughout Central America. Drought also has plagued parts of El Salvador, Guatemala, and Honduras in what is known as the “Dry Corridor.” Further, government corruption, gang activity, and high homicide rates continue to affect parts of the region, driving emigration.
The total Central American-born population in the United States has grown more than tenfold since 1980, and by 24 percent since 2010. The 3.8 million Central American immigrants present in 2019 accounted for 8 percent of the U.S. foreign-born population of 44.9 million (see Figure 1).
Figure 1. Central American Immigrant Population in the United States, 1980-2019
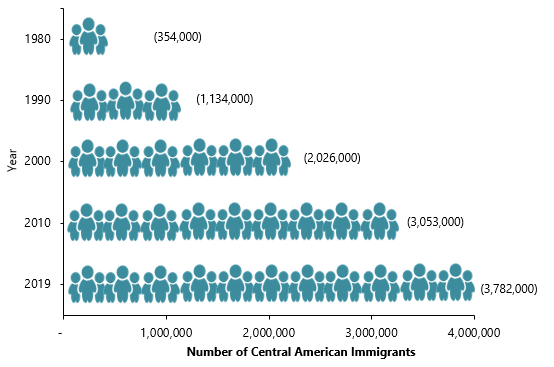
Sources: Data from U.S. Census Bureau 2010 and 2019 American Community Surveys (ACS), and Campbell J. Gibson and Kay Jung, "Historical Census Statistics on the Foreign-Born Population of the United States: 1850-2000" (Working Paper no. 81, U.S. Census Bureau, Washington, DC, February 2006), available online.
Immigration from El Salvador, Guatemala, and Honduras has contributed the most to the growth of Central American immigrant population since 1980. Roughly 86 percent of Central Americans in the United States in 2019 were born in these three countries (see Table 1).
Table 1. Country of Origin for Central American Immigrants in the United States, 2019
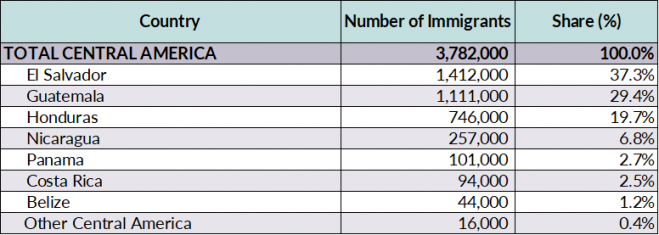
Source: MPI tabulation of data from the U.S. Census Bureau 2019 ACS.
About one-third of Central American immigrants are naturalized U.S. citizens, and the majority of those who received lawful permanent resident (LPR) status (also known as getting a green card) in 2019 did so through family reunification channels. Central American immigrants generally have lower educational outcomes than the overall immigrant population or the U.S. born, and two-thirds report having limited English proficiency. However, they have higher labor force participation than either the overall foreign-born or U.S.-born populations.
The United States is the leading destination for Central American migrants overall, according to the United Nations Population Division’s 2020 estimates, and the top destination for migrants from all Central American countries except Nicaraguans, whose top destination was Costa Rica. Roughly 15 percent (741,000) of all Central American migrants settled in other Latin American countries, with Mexico being a common destination. Outside Latin America, Spain and Canada have large presences of migrants from Central America (3 percent and 2 percent, respectively).
Click here to view an interactive map showing where migrants from Central America and elsewhere have settled worldwide.
Using data from the U.S. Census Bureau (the most recent 2019 American Community Survey [ACS] as well as pooled 2015-19 ACS data), the Department of Homeland Security’s Yearbook of Immigration Statistics, and the World Bank, this Spotlight provides information on the Central American immigrant population in the United States, focusing on its size, geographic distribution, and socioeconomic characteristics.
Click on the bullet points below for more information:
- Distribution by State and Key Cities
- English Proficiency
- Age, Education, and Employment
- Income and Poverty
- Immigration Pathways and Naturalization
- Unauthorized Immigrant Population
- Health Coverage
- Diaspora
- Remittances
Distribution by State and Key Cities
Most Central American immigrants live in states along the coasts and the southern border, with more than half of the population in California (25 percent), Texas (13 percent), Florida (11 percent), and New York (8 percent). The top five counties for Central Americans were Los Angeles County in California, Harris County in Texas, Miami-Dade County in Florida, Dallas County in Texas, and Prince George’s County in Maryland. Together these five counties were home to 30 percent of Central American immigrants in the United States.
Figure 2. Top Destination States for Central American Immigrants in the United States, 2015-19
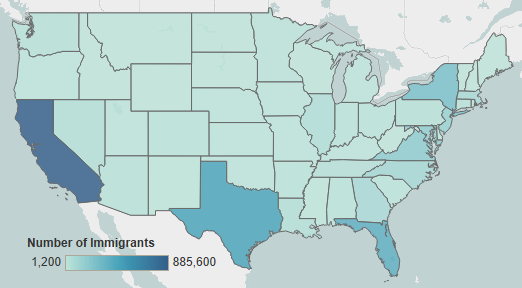
Notes: Pooled 2015-19 ACS data were used to get statistically valid estimates at the state level for smaller-population geographies. Not shown are the populations in Alaska and Hawaii, which are small in size; for details, visit the Migration Policy Institute (MPI) Data Hub for an interactive map showing geographic distribution of immigrants by state and county, available online.
Source: MPI tabulation of data from U.S. Census Bureau pooled 2015-19 ACS.
Click here for an interactive map that highlights the states and counties with the highest concentrations of immigrants from Central America and other countries.
The Central American immigrant population has a large spread, but the highest metro concentrations are in the greater Los Angeles (16 percent), New York (11 percent), Washington, DC (9 percent), Miami, and Houston (each 7 percent) metropolitan areas.
Figure 3. Top Metropolitan Destinations for Central American Immigrants in the United States, 2015-19
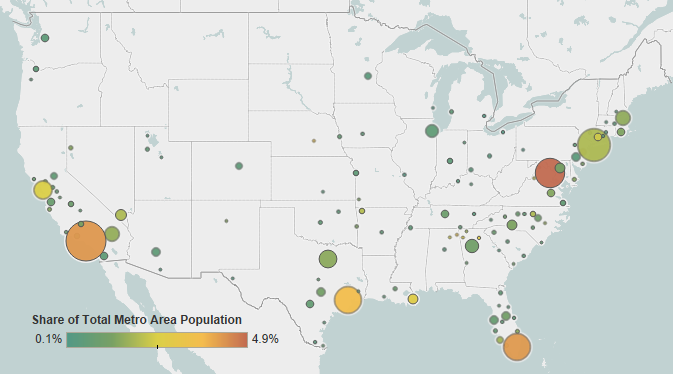
Note: Pooled 2015-19 ACS data were used to get statistically valid estimates at the metropolitan statistical-area level for smaller-population geographies.
Source: MPI tabulation of data from U.S. Census Bureau pooled 2015-19 ACS.
Click here for an interactive map that highlights the metro areas with the highest concentrations of immigrants from Central America and other countries.
Table 2. Top Concentrations of Central American Immigrants by U.S. Metropolitan Area, 2015-19
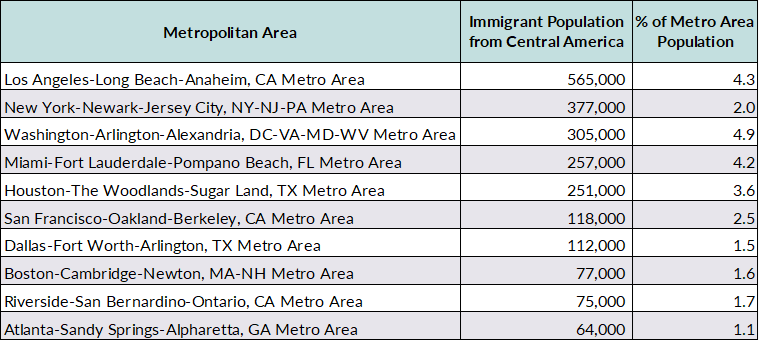
Source: MPI tabulation of data from the U.S. Census Bureau pooled 2015-19 ACS.
Nearly all Central American immigrants speak a language other than English. A greater share of the population has limited English proficiency (66 percent) compared to all foreign born (46 percent). Guatemalans (70 percent), Hondurans (70 percent), and Salvadorans (69 percent) were more likely to be Limited English Proficient (LEP) than other Central Americans.
Just 7 percent of Central American immigrants reported speaking only English at home compared to 16 percent of the total foreign-born population. Panamanians stood out: 20 percent reported speaking only English at home.
Note: LEP refers to those who indicated on the ACS questionnaire that they spoke English less than “very well.”
Age, Education, and Employment
Of immigrants from Central America, 81 percent were of working age (the 18-64 age range), higher than the share of all immigrants (78 percent) or U.S. natives (59 percent). Fewer Central American immigrants were minors (9 percent) or aged 65 and older (9 percent) than the U.S. born. The median age for Central Americans was 40 years old, between that of all immigrants (46 years) and natives (37 years). The median ages for immigrants from Guatemala and Honduras were 37 and 36, respectively, while the region’s highest was among the foreign born from Panama, at 55.
Figure 4. Age Distribution of the U.S. Population by Origin, 2019
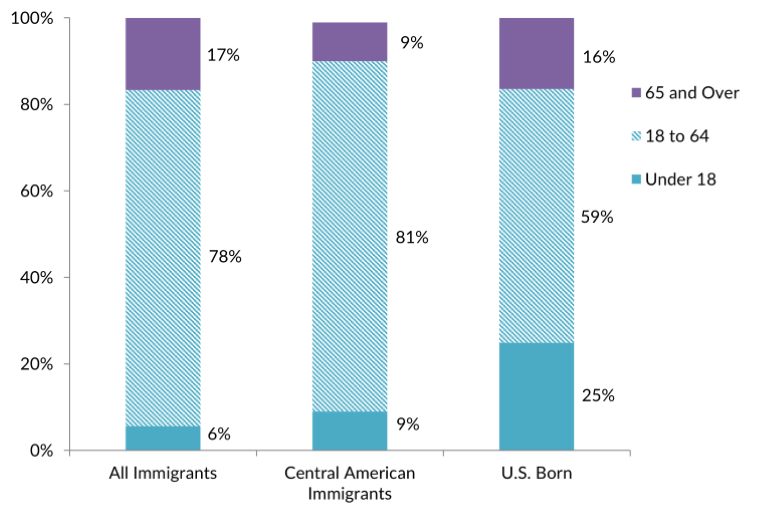
Note: Percentages may not add up to 100 as they are rounded to the nearest whole number.
Source: MPI tabulation of data from the U.S. Census Bureau 2019 ACS.
Roughly 47 percent of Central Americans ages 25 and older had less than a high school diploma, versus 26 percent of the total foreign born and 8 percent of U.S.-born adults. More than half of Guatemalan immigrants (56 percent) lacked a high school education, the lowest educational attainment for Central American immigrants, followed by 50 percent of Salvadoran adults. About 11 percent of immigrants from Central America had a bachelor’s degree or higher, below the rates of the total immigrant and total U.S.-born adult populations (33 percent each). Panamanians were the most educated among immigrants from the region, with 31 percent being college graduates.
At 72 percent, Central American immigrants have higher labor force participation than both the total foreign-born (67 percent) and U.S.-born (62 percent) populations. For immigrants from the region, Salvadorans and Guatemalans had the highest labor force participation rates, at 74 percent each.
Most Central American immigrants were in service (31 percent); natural resources, construction, and maintenance (25 percent); or production, transportation, and material moving (19 percent) occupations. In contrast, the top occupational group for all immigrant workers was management, business, science, and arts (35 percent), followed by service occupations (23 percent).
Figure 5. Employed Workers in the Civilian Labor Force (ages 16 and older) by Occupation and Origin, 2019
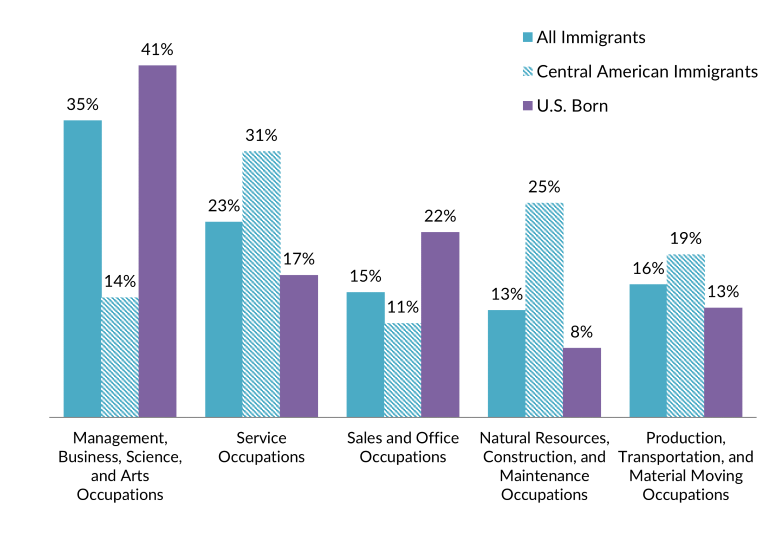
Note: Percentages may not add up to 100 as they are rounded to the nearest whole number.
Source: MPI tabulation of data from the U.S. Census Bureau 2019 ACS.
About one-third of Salvadoran, Guatemalan, and Honduran workers worked in service occupations. Panamanian and Costa Rican immigrants more closely resembled the U.S. born, with 41 percent and 38 percent respectively employed in management, business, science, and arts occupations.
The median household income for Central Americans in 2019 was $51,000, lower than that of all immigrants ($64,000) and the U.S. born ($66,000). Costa Ricans ($61,000) and Nicaraguans ($58,000) earned the highest median incomes of all Central American immigrants, followed by Panamanians ($57,000), Salvadorans ($56,000), Guatemalans ($47,000), and Hondurans ($46,000).
In 2019, 19 percent of Central American individuals lived in poverty, versus 14 percent of all immigrants and 12 percent of natives. Poverty rates were the highest among Hondurans (25 percent) and Guatemalans (23 percent).
Immigration Pathways and Naturalization
About 34 percent of Central Americans were naturalized U.S. citizens as of 2019, compared to 52 percent of all immigrants. Panamanians (72 percent), Nicaraguans (61 percent), and Costa Ricans (59 percent) were more likely to be naturalized citizens, while Hondurans (23 percent), Guatemalans (28 percent), and Salvadorans (34 percent) were less likely.
Central American immigrants tend to have slightly fewer years of residence in the United States than the overall immigrant population. Forty-four percent of Central Americans entered the United States before 2000, compared to 51 percent of all immigrants. Twenty-eight percent of Central Americans entered between 2000 and 2009, and 29 percent entered the United States in 2010 or later. Most Panamanians (72 percent), Nicaraguans (66 percent), and Costa Ricans (56 percent) arrived before 2000, whereas about two-thirds of Hondurans (69 percent) and Guatemalans (64 percent) arrived in 2000 or later.
Figure 6. Central Americans and All Immigrants in the United States by Period of Arrival, 2019

Note: Numbers are rounded to the nearest whole number and may not add to 100.
Source: MPI tabulation of data from the U.S. Census Bureau 2019 ACS.
The highest proportion of the 65,000 immigrants from Central America who became lawful permanent residents in fiscal year (FY) 2019 did so through family reunification channels (76 percent), followed by those who were refugees and asylees (10 percent). Costa Ricans and Hondurans (10 percent each) were more likely than other Central Americans to become LPRs through employment sponsorship, while Guatemalans (15 percent) were most likely to obtain green cards after gaining asylum or being resettled as a refugee.
Figure 7. Immigration Pathways of Central Americans and All Lawful Permanent Residents in the United States, FY 2019
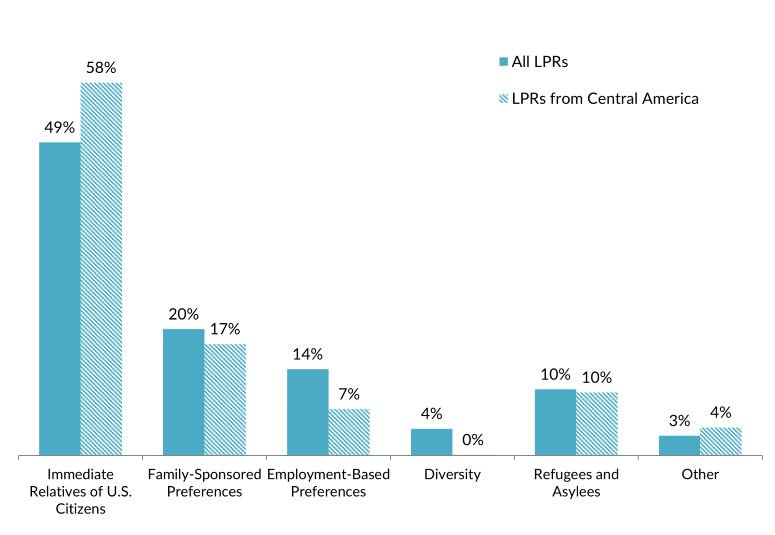
Notes: Immediate relatives of U.S. citizens include spouses, minor children, and parents of U.S. citizens. Family-sponsored preferences include adult children and siblings of U.S. citizens, and spouses and children of green-card holders. The Diversity Visa lottery refers to the program established by the Immigration Act of 1990 to allow immigrants from countries with low rates of immigration to enter the United States; the law states that 55,000 diversity visas in total are made available each fiscal year. Individuals born in El Salvador, Guatemala, and Honduras were ineligible for the DV-2022 lottery."
Source: MPI tabulation of data from the Department of Homeland Security (DHS), 2019 Yearbook of Immigration Statistics (Washington, DC: DHS Office of Immigration Statistics, 2020), available online.
Unauthorized Immigrant Population
The Migration Policy Institute (MPI) estimates that approximately 1.9 million unauthorized immigrants from Central America resided in the United States as of 2018, accounting for approximately 17 percent of the total 11 million unauthorized immigrant population. The top origin countries for unauthorized immigrants from Central America were El Salvador (750,000), Guatemala (588,000), and Honduras (402,000). Click here for an interactive map of the 2018 unauthorized immigrant population in the United States.
Many migrants from these countries have remained in the United States with Temporary Protected Status (TPS), which grants work authorization and relief from deportation (Guatemala is no longer on the designation list). El Salvador, Honduras, and Nicaragua are among the 12 countries with TPS designations. As of March 2021, TPS protections covered 198,400 Salvadorans, 60,400 Hondurans, and 3,200 Nicaraguans. Nationals of these three countries made up 82 percent of the 319,500 individuals protected by TPS.
In addition to comprising the largest share of TPS recipients, Central Americans account for the largest share of Deferred Action for Child Arrivals (DACA) recipients, after Mexicans. As of March 2021, an estimated 58,000 Central American youths and young adults had DACA status, representing 9 percent of the 616,000 active DACA recipients. Among these were 24,000 Salvadorans, 16,000 Guatemalans, and 15,000 Hondurans.
Click here to view the top origin countries of DACA recipients and their U.S. states of residence.
Significant numbers of unaccompanied children from El Salvador, Guatemala, and Honduras also have arrived at the U.S.-Mexico border without prior authorization to enter. These minors accounted for 75 percent of all stops of unaccompanied youth by U.S. Customs and Border Protection (CBP) from October 2020 to June 2021. Many unaccompanied children, families, and single adults arriving at the border have requested asylum. Overall, citizens from these three countries accounted for 40 percent of the more than 1.1 million encounters of migrants at the U.S.-Mexico border in this period.
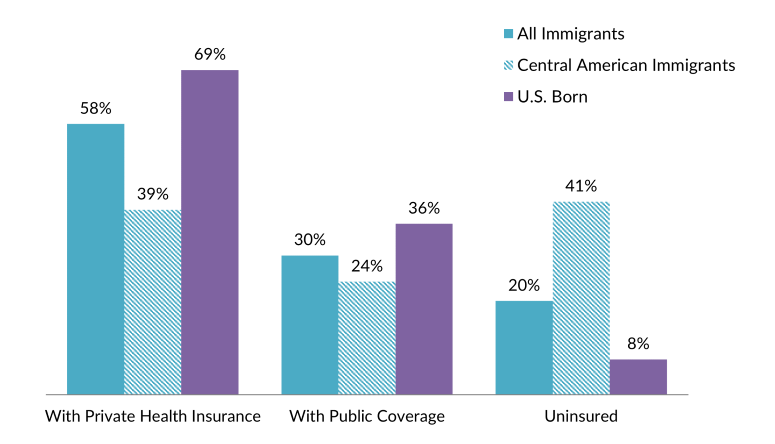
Central American immigrants are less likely to have health insurance, with 41 percent lacking coverage compared to 20 percent of all immigrants and 8 percent of natives. The least insured populations were Hondurans (53 percent) and Guatemalans (48 percent).
Approximately 39 percent of Central Americans had private health insurance coverage, versus 58 percent of all foreign born and 69 percent of natives. Almost one-quarter had public coverage, compared to 30 percent of all immigrants and 36 percent of the U.S. born.
Figure 8. Health Coverage for Central American Immigrants, All Immigrants, and the Native Born, 2019
Note: The sum of shares by type of insurance is likely to be greater than 100 because people may have more than one type of insurance.
Source: MPI tabulation of data from the U.S. Census Bureau 2019 ACS.
The Central American diaspora is comprised of approximately 7 million U.S. residents who were either born in Central America or reported Central American ancestry or origin. Salvadorans make up 2.8 million of this group, followed by 2 million Guatemalans, and 1.3 million people with Honduran ancestry or origin.
Click here to see estimates of the top 20 diasporas groups in the United States in 2019.
Global remittances to Central America have grown over sevenfold since 2000, reaching more than $25.8 billion as of 2020, according to World Bank estimates. Remittances represented a different share of each individual country’s GDP, ranging from only under 1 percent for Costa Rica to 24 percent for both El Salvador and Honduras.
Figure 9. Annual Remittance Flows to Central America, 1990–2020
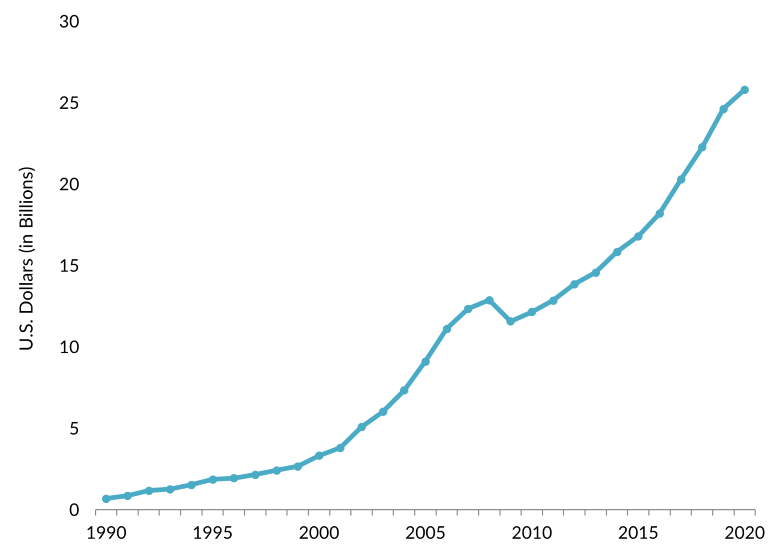
Source: World Bank Prospects Group, “Annual Remittances Data,” May 2021 update, available online.
Track remittances by inflow and outflow, between countries, and over time with the interactive remittances tools on MPI’s Data Hub.
Sources
Congressional Research Service (CRS). 2021. Temporary Protected Status and Deferred Enforced Departure. Washington, DC: CRS. Available online.
Food and Agriculture Organization of the United Nations (FAO). N.d. Drought in the Dry Corridor of Central America. Accessed April 23, 2021. Available online.
Gibson, Campbell J. and Kay Jung. 2006. Historical Census Statistics on the Foreign-Born Population of the United States: 1850-2000. Working Paper no. 81, U.S. Census Bureau, Washington, DC, February 2006. Available online.
UN High Commissioner for Refugees (UNHCR). 2019. Costa Rican Schools Open Their Doors to Displaced Nicaraguan Children. UNHCR, July 5, 2019. Available online.
---. 2019. One Year into Nicaragua Crisis, More Than 60,000 Force to Flee Their Country. Press release, April 16, 2019. Available online.
United Nations Population Division. 2020. International Migrant Stock 2020: Destination and Origin. Available online.
U.S. Census Bureau. N.d. 2019 American Community Survey. Accessed July 5, 2021. Available online.
U.S. Citizenship and Immigration Services (USCIS). 2021. Count of Active DACA Recipients by Country of Birth as of March 31, 2021. Available online.
U.S. Customs and Border Protection (CBP). 2021. Nationwide Enforcement Encounters: Title 8 Enforcement Actions and Title 42 Expulsions. Updated July 16, 2021. Available online.
---. 2021. Southwest Land Border Encounters. Updated July 16, 2021. Available online.
---. 2021. U.S. Border Patrol Southwest Border Apprehensions by Sector. Updated March 2021. Available online.
U.S. Department of Homeland Security (DHS), Office of Immigration Statistics. 2020. 2019 Yearbook of Immigration Statistics. Washington, DC: DHS Office of Immigration Statistics. Available online.
World Bank Prospects Group. 2021. Annual Remittances Data, May 2021 update. Available online.