

Immigration Has Been a Defining, Often Contentious, Element Throughout U.S. History

A Dutch family at Ellis Island between 1915 and 1920. (Photo: Library of Congress)
As host to more immigrants than any other country, the United States has been shaped and reshaped by immigration over the centuries demographically, economically, culturally, socially, and politically. Newcomers have driven fundamental U.S. transformations during four peak periods of significant immigration: establishment of the British colonies, westward expansion and the shift to an agricultural economy in the 19th century, the rise of cities and manufacturing at the turn of the 20th century, and the recent dominance of a services- and knowledge-based economy beginning in the 1970s and continuing today.
Even as immigration has been a regular feature of American life, it has also been historically contentious and in recent decades has been seen through an increasingly partisan lens. While the United States continues to rely on immigration to bolster population growth, for family reunification, and to fill job needs, the system no longer keeps pace with these demands. The country’s present-day immigration framework was mostly constructed in the 1950s and 1960s, and the last major legislative reforms occurred in 1996. Since then, immigration has become a partisan wedge issue within Congress and the country, with fights chiefly concentrated on the fate of the estimated 11 million unauthorized immigrants in the United States, one of the largest such populations in the world, and enforcement measures at the U.S.-Mexico border. In the face of serious roadblocks to changing immigration laws, recent presidential administrations have increasingly governed through executive action, which has allowed them each to put their mark on the system—at least temporarily.
Although the foundational tenets of the immigration system have remained mostly unchanged over the past several decades, the immigrant population has grown significantly. As of 2019, 44.9 million immigrants lived in the United States—more than double the 1990 number—representing nearly 14 percent of the country’s total population, the highest share since 1910. Immigrant origins are also shifting, with recent arrivals from China and India outpacing those from Mexico, and the overall number of Mexican immigrants declining since 2010. And after peaking at an estimated 12.3 million in 2007, the unauthorized immigrant population has decreased and mostly leveled out around 11 million.
As a result of these shifts, anxieties that have traditionally accompanied sizeable demographic changes, post-9/11 policies that rooted immigration in a new national security narrative, and other factors, immigration has become central to U.S. political debates, helping to propel leaders with ardent but strongly diverging views on the issue. Attempts at major legislative reform have crumbled in the face of such increasing partisanship. This article covers the history of immigration to the United States, provides data on the size and characteristics of the present-day immigrant population, and reviews prospects for future developments.
How Has the Approach to Immigration Changed Throughout U.S. History?
Prior to 1880, immigration to the United States was primarily European, driven by forces including religious and political persecution, crop failure, and the expanding frontiers of the American West and the U.S. industrial revolution. Arrivals of enslaved people from Africa and the Caribbean were high throughout the 18th century but declined dramatically after 1810 and ended in 1861. Chinese immigrants began to arrive in large numbers after gold was discovered in California in 1848.
It was only in 1875 that the U.S. government began to restrict immigration; until that time, virtually all arrivals were admitted. The Immigration Act of 1875 (also known as the Page Act) barred the admission of criminals and made it a felony to import Asian forced laborers and Chinese women. The 1882 Immigration Act further prohibited entry of anyone deemed a "convict, lunatic, idiot, or person unable to take care of himself or herself without becoming a public charge,” and set a fee for arriving noncitizens that would be used to regulate immigration. As the gold rush ended, animosity toward Chinese laborers and other immigrants surged, leading to a further series of racially restrictive immigration laws. The Chinese Exclusion Act of 1882 halted immigration of Chinese laborers for ten years, barred Chinese naturalization, and provided for the deportation of unauthorized Chinese immigrants. Follow-on laws in 1888 and 1892 further restricted immigration from China.
Between 1880 and 1930, more than 27 million immigrants arrived, mainly from Europe and Canada. This peak immigration period—the last major wave prior to the current era—also led to new restrictions. Among them was the 1917 Immigration Act, which prohibited immigration from a newly drawn "Asiatic barred zone" covering most of South and Southeast Asia and nearly the entire Middle East, as well as other groups of migrants such as those who could not pass a literacy test. The Immigration Act of 1924 (also known as the Johnson-Reed Act) established the national-origins quota system, which set a ceiling on the number of immigrants allowed from each country, highly preferencing those from Northern and Western Europe. The 1924 law included no provisions for immigration from South and Central America or Mexico.
The Creation of the Modern U.S. Immigration System
Two decades later, the tides slowly started to turn. In 1943, the Chinese Exclusion Act was repealed after more than 60 years. The 1952 Immigration and Nationality Act continued the national-origins quota system but for the first time allocated a quota for Asian countries. A new philosophy guiding immigration eventually took hold as part the nation's civil-rights movement, and the resulting Immigration and Nationality Act Amendments of 1965 (the Hart-Cellar Act) repealed the national-origins quota system and replaced it with a seven-category preference system based primarily on family unification. By ending strong preferences for European migration and increasing numerical limits on immigration, the landmark 1965 law set in motion powerful forces that still shape the United States today. Immigration flows that had long been dominated by Europeans gave way to predominantly Latin American and Asian immigration.
Figure 1. U.S. Immigrant Population by Region of Birth, 1960-2019
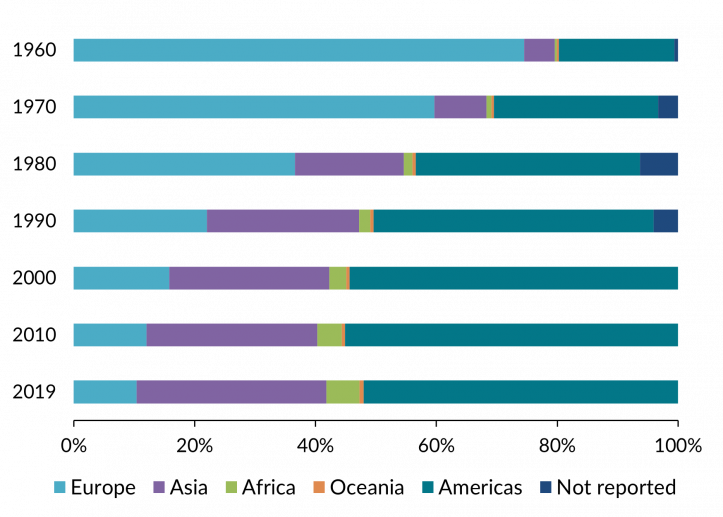
Source: Migration Policy Institute (MPI), “U.S. Immigrant Population by World Region of Birth, 1960-2019,” MPI Migration Data Hub, accessed December 9, 2021, available online.
The Hart-Cellar Act also for the first time created a permanent admissions category for refugees. Previously, refugees had been allowed into the United States only under the attorney general’s parole authority (this power continued to be used after 1965 to admit refugees beyond the admissions cap). Later, the Refugee Act of 1980 established the modern U.S. refugee system, including authorizing the president to set annual admissions targets, creating the asylum system, and providing a pathway to permanent residence for refugees and asylees.
Though Congress in 1964 terminated the World War II-era Bracero program used to recruit Mexican workers for U.S. farms, the 1965 Act helped usher in a new era of migration from Mexico. As Mexico became the largest source country for legal admissions, it also became the origin for a growing population of unauthorized migrants coming in search of jobs; by the mid-1980s, an estimated 3 million to 5 million immigrants were living unlawfully in the country.
The Immigration Reform and Control Act of 1986 (IRCA) was intended to address and end illegal immigration with a "three-legged stool” approach: penalize employers who knowingly hired unauthorized immigrants, increase border enforcement, and offer legal status to unauthorized immigrants who had lived in the United States for at least five years (with more leniency for agricultural workers). The law granted legal status to 2.7 million individuals, but it never accomplished its goal of ending illegal immigration. Many unauthorized immigrants were not eligible for legalization under the law’s provisions, and the measure also did not provide for newly legalized immigrants to reunite with their relatives. Meanwhile, policing of employers was minimal and border enforcement was slow to scale up.
Four years later, the Immigration Act of 1990 sought to ease entry for highly skilled immigrants by raising legal immigration caps, creating a preference system for employment-based immigration, and modifying categories for temporary visas, among other changes. It also established Temporary Protected Status (TPS) for nationals of countries deemed unsafe for return because of armed conflict or natural disaster, as well as the Diversity Visa Program, which allots green cards for immigrants from countries with little immigration to the United States.
The continuing rise in illegal immigration sparked a backlash that prompted Congress in 1996 to pass laws that included strict immigration provisions. Among these were the Illegal Immigration Reform and Immigrant Responsibility Act (IIRIRA), which significantly expanded the number of crimes that are defined as aggravated felonies and subject noncitizens to removal, provided for expedited removal of inadmissible noncitizens, barred unauthorized immigrants for long periods of time from re-entry, and set income requirements for immigrants' family sponsors at 125 percent of the federal poverty level. IIRIRA also required the government to track foreign visitors' entries and exits, which became a key element in the government's security strategy after the terrorist attacks of September 11, 2001. In 1996, Congress also revised federal welfare law with passage of the Personal Responsibility and Work Opportunity Reconciliation Act (PRWORA), which denied some legally present immigrants access to benefits such as Medicaid and food stamps. Finally, that year lawmakers passed the Antiterrorism and Effective Death Penalty Act (AEDPA), making it easier to arrest, detain, and deport noncitizens.
9/11 and the Securitization of Immigration
For much of U.S. history, debates about immigration had centered on economic, national-origin, and public-safety arguments. Since 9/11, national security concerns moved to the forefront. The government in 2002 created the Department of Homeland Security (DHS) by merging 22 federal agencies, including the U.S. Immigration and Naturalization Service (INS), which had been the national immigration agency since 1933. Within DHS, INS was replaced by three new agencies to manage immigration: U.S. Customs and Border Protection (CBP), which oversees the entry of all people and goods; U.S. Immigration and Customs Enforcement (ICE), which enforces immigration and customs laws in the U.S. interior; and U.S. Citizenship and Immigration Services (USCIS), which adjudicates immigration applications.
The national security focus led to increased scrutiny and sometimes targeting of immigrant communities. Shortly after 9/11, more than 1,000 foreign nationals deemed potential threats were arrested. Officials also established the National Security Entry-Exit Registration System (NSEERS) requiring noncitizen men from a group of largely Muslim-majority countries to submit fingerprints and other information upon entering the United States, and DHS later replaced it with the U.S. Visitor and Immigrant Status Indicator Technology (US-VISIT) program to collect biometrics from all foreign nationals entering the country.
Other expanded enforcement activities included the Secure Fence Act of 2006, which directed DHS to establish a system of technology and at least 700 miles of barriers at the nearly 2,000-mile U.S.-Mexico border. Meanwhile, ICE increasingly worked with local law enforcement agencies to drive up interior arrests of unauthorized immigrants and other removable noncitizens, including by deputizing local law enforcement agents to enforce immigration laws. The more than 320,000 ICE arrests in fiscal year (FY) 2011 marked a record high.
As the roles of the immigration agencies grew, so did their funding. The $25.1 billion appropriated for immigration enforcement in FY 2020 (which went to CBP, ICE, and the Office of Biometric Identity Management) was nearly five times the $4.3 billion allocated in FY 2000. It was also 28 percent more than the combined $19.5 billion spent on the federal government’s principal criminal law enforcement agencies (the Federal Bureau of Investigation, Drug Enforcement Administration, Secret Service, U.S. Marshals Service, and the Bureau of Alcohol, Tobacco, Firearms, and Explosives).
Aggressive immigration enforcement drew pushback from immigrant-rights advocates, leading to various kinds of so-called sanctuary policies restricting state and local police from cooperating with ICE in places such as California, the Chicago area, and New York City. The 2016 election of President Donald Trump, who promised to deport millions of unauthorized immigrants, further spurred this trend, and eventually birthed a movement among some progressive activists to “abolish ICE.” One effect was that Democratic lawmakers became more hesitant to support increases in immigration enforcement resources and effort, after two decades of dramatic, sustained growth.
The Political Divide Deepens
In the post-9/11 era, lawmakers made multiple attempts to enact comprehensive immigration legislation that traded increased enforcement for paths by which unauthorized immigrants could gain legal status and eventually citizenship. But these efforts failed repeatedly, most notably in 2006, 2007, and 2013. With Republicans increasingly focused solely on prioritizing enforcement and Democrats motivated chiefly by legalization, hopes of reaching a legislative grand bargain have faded. Even legal immigration has become a point of increasing political contention, representing a turning point from the longstanding bipartisan consensus that illegal immigration should be discouraged but that legal immigration benefits the country.
Changing demographics are the backdrop to the shift away from compromise. Hispanic, Asian-American, and Black voters have grown as a share of the electorate, while the share of non-Hispanic White voters is shrinking, affecting the makeup of registered Democrats more than Republicans. Nonwhite voters accounted for 40 percent of Democrats in 2019, up from around 24 percent in 1996; meanwhile, they accounted for 17 percent of Republicans in 2019, up from 6 percent in 1996. The share of Hispanic voters in particular, some of whom have been among the most vocal advocates for immigrant rights, nearly tripled from 4 percent in 1996 to 11 percent in 2019 (as a whole, though, Hispanics rarely cite immigration as their top priority).
Congressional inaction and increasing partisan polarization have set the conditions for presidents to make immigration changes through executive action. One early example was the Obama administration’s 2012 Deferred Action for Childhood Arrivals (DACA) program, which provides temporary protection from deportation and work authorization to some unauthorized youths who arrived in the United States as children.
Trump took full advantage of the executive branch’s powers. Through FY 2019, a higher share of Trump’s executive orders and presidential proclamations were immigration-related than any other president since 1945. Overall, his administration took more than 500 executive actions on immigration, according to Migration Policy Institute (MPI) analysis, including headline-generating travel bans on nationals of mostly Muslim-majority countries and redirecting Pentagon funds to build a border wall. More under-the-radar moves included encouraging consular officers to authorize visas for shorter durations and raising standards for initial asylum screening interviews. Despite some early losses in lower courts, presidents' ability to use executive power to change immigration policy has been largely upheld by the Supreme Court.
President Joe Biden has largely continued this trend and, as of this writing, has outpaced the Trump administration’s rate of action over a similar period. Among other actions, in 2021 the Biden administration made hundreds of thousands of immigrants, mainly from Venezuela, eligible for TPS, which protects recipients from deportation and allows them to work legally.
But the limits of executive action are apparent. Courts may be more willing to consider challenges to administrative changes than congressional reform. Policies enacted through agency action can similarly be rescinded through agency action. Additionally, administrative changes are not tempered by the need to compromise, resulting in wide policy swings from administration to administration. In the face of more extreme executive actions such as the Trump administration’s travel bans or Biden’s effort to temporarily halt deportations, states have often taken the lead in contesting them in court, exacerbating tensions between states and the federal government.
Who Are Immigrants in the United States?
The 44.9 million immigrants in the United States make up about one-sixth of all international migrants in the world. Although the 13.7 percent foreign-born share of the overall U.S. population is near the previous U.S. peaks of 14.8 percent in 1890 and 14.7 percent in 1910, it still falls below many countries, particularly those with small populations.
Figure 2. Number and Share of Immigrants in the United States, 1850-2019
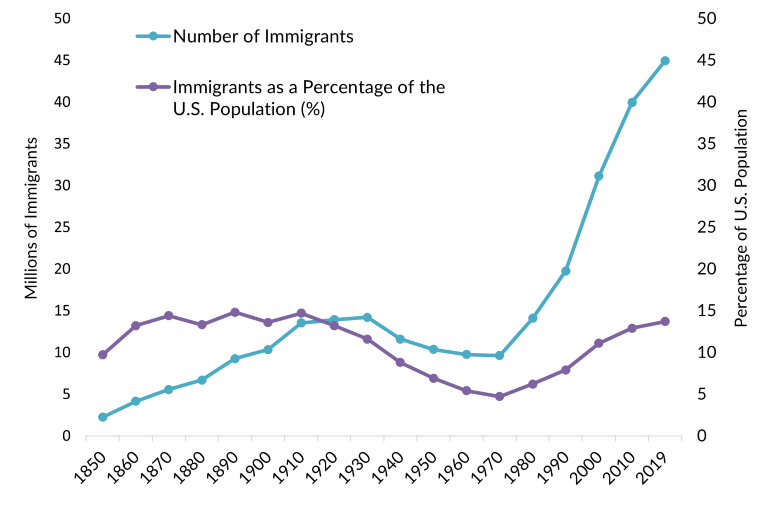
Source: MPI, “U.S. Immigrant Population and Share over Time, 1850-Present,” MPI Migration Data Hub, accessed December 9, 2021, available online.
MPI estimates approximately 45 percent of the foreign-born population are naturalized citizens, 28 percent are lawful permanent residents (LPRs, also known as green card holders), 23 percent are unauthorized immigrants, and 5 percent are temporary visitors, such as international students or seasonal workers. Among unauthorized immigrants, about 16 percent as of 2019 were temporarily protected from deportation through enrollment in TPS or DACA or because they had a pending asylum application.
Figure 3. Immigrant Population in the United States by Status, 2019
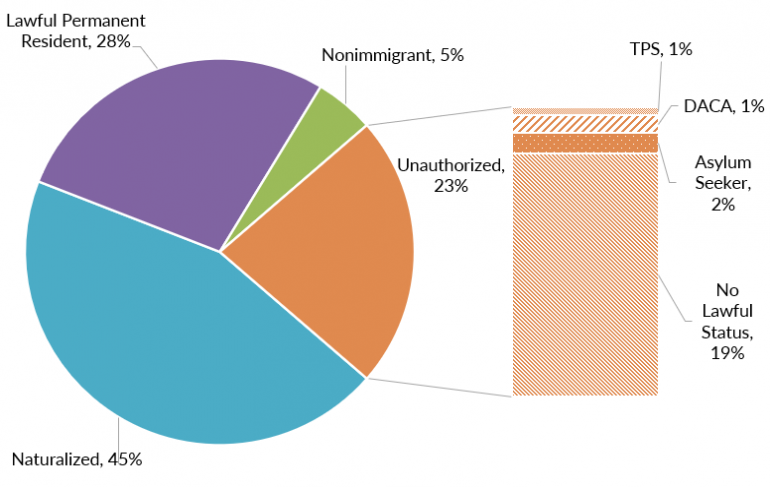
Notes: DACA is Deferred Action for Childhood Arrivals and TPS is Temporary Protected Status.
Sources: These 2019 data result from MPI analysis of data from the U.S. Census Bureau’s 2015–19 American Community Survey (ACS), pooled, and the 2008 Survey of Income and Program Participation (SIPP), weighted to 2019 unauthorized immigrant population estimates provided by Jennifer Van Hook. Data on DACA recipients are from U.S. Citizenship and Immigration Services (USCIS), “Approximate Active DACA Recipients: As of June 30, 2019,” accessed December 8, 2021, available online. Data on TPS beneficiaries are from Jill H. Wilson, Temporary Protected Status: Overview and Current Issues (Washington, DC: Congressional Research Service, 2018), available online. Data on asylum seekers are from USCIS, “Form I-765 Application for Employment Authorization, All Receipts, Approvals, Denials Grouped by Eligibility Category and Filing Type,” accessed December 8, 2021, available online.
Roughly 10.9 million (24 percent) of the immigrant population is from Mexico, the most common country of origin. However, since 2013 new arrivals from India and China have outpaced those from Mexico, due to factors including the large numbers of Indian and Chinese migrants who are international students or hold temporary work visas, as well as reduced illegal immigration from Mexico following the 2008 financial crisis, a growing economy there, and increased U.S. border enforcement. Latin America is the largest region of origin for the overall U.S. immigrant population; the Pew Research Center has projected that immigrants from Asia will make up the largest share of the foreign-born population by 2065. Overall, Indian and Chinese immigrants make up the second- and third-largest immigrant groups, with 2.7 million and 2.5 million respectively, or about 6 percent of the foreign-born population each.
Immigrants are geographically concentrated, with 63 percent residing in six states that have long been the main immigrant destinations: California (about 24 percent of the overall U.S. foreign-born population), Texas (11 percent), Florida and New York (each with 10 percent), New Jersey (5 percent), and Illinois (4 percent). While these states continue to draw the bulk of the foreign-born population, newcomers—particularly unauthorized immigrants from Mexico—have also settled elsewhere in recent decades, following employment opportunities, especially in agriculture, food manufacturing, and construction. Ten states have experienced a more than 350 percent increase in their immigrant populations since 1990: North Carolina, Tennessee, Georgia, Arkansas, Nevada, South Carolina, Kentucky, Nebraska, South Dakota, and Utah. In four of these states, immigrant populations have more than quintupled. Arrivals of immigrants in new regions may help explain why immigration has become a more salient national political issue.
New migration patterns may also make integration more difficult, as local infrastructure may not exist to accommodate non-English speakers or those from other cultures. Additionally, areas that experience sudden foreign-born population growth are prone to implement more restrictive local policies toward immigrants. Nationally, researchers have found that migrants’ sense of belonging may grow when they reach certain milestones such as language proficiency and citizenship. According to the International Social Survey Program’s National Identity module, immigrants’ sense of belonging in the United States decreased from 2003 to 2013, but even still was higher than many other “settler nations” such as in Western Europe. It is possible that this sense of belonging has deteriorated as restrictionist viewpoints and policies have entered the mainstream in recent years. Between 2014 and 2019, the United States dropped in the Migrant Integration Policy Index, which tracks public policies affecting immigrant integration, from a score of 75 out of 100 to 73 (meanwhile, the average country score increased by two points in the same period).
Still, Gallup reports the share of Americans who say immigration is good for the country has increased from 62 percent in 2001 to 77 percent in 2020, also the first year more people said immigration should increase than decrease (34 percent versus 28 percent). Most of the increase in those supporting higher levels of immigration comes from Democrats and independents, but shows that explicitly pro-immigration sentiment has risen alongside skepticism.
How Does the U.S. Immigration System Work?
The modern U.S. immigration system was largely established in 1965 and allows for arrival through three primary streams: (re)unification for U.S. citizens and LPRs with close family members, employment, and humanitarian protection. Typically, about two-thirds of permanent immigrants arrive through family-based channels, with about 14-15 percent through employment pathways, and the remainder divided among humanitarian migrants, Diversity Visa recipients, and others such as Afghans and Iraqis who worked with the U.S. government. Other migrants come to the United States temporarily as short-term workers or international students, among others.
For more details on how these visas are allocated, see MPI’s explainer on the legal immigration system.
Figure 4. Green Cards Issued by Category, FY 2019
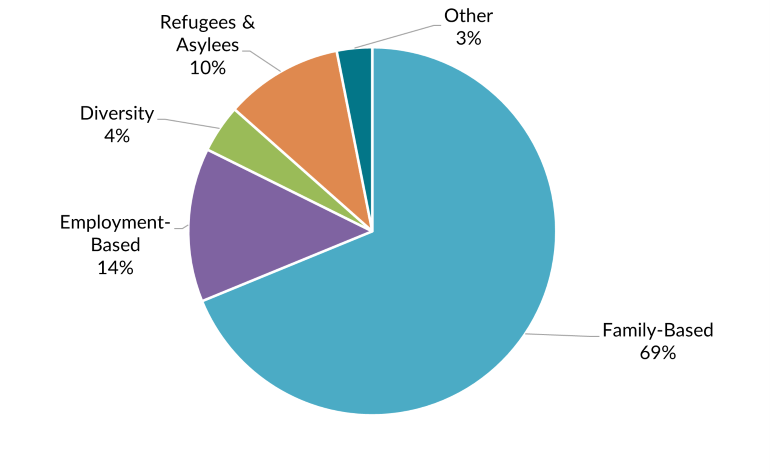
Source: U.S. Department of Homeland Security (DHS), “Table 7. Persons Obtaining Lawful Permanent Resident Status by Type and Detailed Class of Admission: Fiscal Year 2019,” updated January 26, 2021, available online.
Family Pathways
In FY 2019, the 710,000 immigrants admitted via family sponsorship made up 69 percent of the 1 million green cards issued that year. There are huge backlogs in all visa categories, including 3.8 million family applications at the end of 2020. Family-based migration makes up such a large share of overall immigration because immediate relatives of U.S. citizens—including spouses, children under age 21, and parents—are exempted from the yearly cap of 226,000 family-based green cards. But the waits for other categories of relatives can be grueling and sometimes impossible; as of this writing, a Mexican national being sponsored for a green card by a U.S.-citizen sibling faces a wait of more than 150 years.
Employment-Based Channels
Of the green cards issued in FY 2019, 139,000 (14 percent) were issued through employer sponsorship. As has been the case for decades, most of these new LPRs had already been living in the United States on a temporary work visa. Because of lengthy backlogs, particularly for nationals of countries such as India, many had been waiting years to have their application adjudicated.
Because just 140,000 employment-based green cards can be issued each year and more than half tend to go to principal applicants’ spouses and children, the demand greatly outpaces the supply. This is partly because more workers are coming on temporary visas and hope to stay in the United States. For example, more than 389,000 petitions for H-1B visas for temporary high-skilled workers were approved in FY 2019, up from nearly 258,000 in FY 2000. More international students have been granted work authorization for Optional Practical Training (OPT), which allows them to work in the country for one to two years after graduating from a U.S. institution: the 156,000 initial employment authorization documents granted under OPT in FY 2019 were more than twice the 75,000 granted in FY 2003.
Issuance of temporary work visas such as the H-2A visa for seasonal agricultural work and the H-2B visa for seasonal nonagricultural work has also risen in recent years. The 29,000 agricultural work visas issued in FY 1999 rose to 205,000 in FY 2019. In the past decade, agricultural employers who historically relied on a largely unauthorized immigrant workforce have turned to the H-2A visa. Issuances of H-2B visas have also multiplied, from 31,000 issued in FY 1999 to 98,000 in FY 2019. Although H-2B issuances are capped at 66,000 annually, Congress has repeatedly allowed DHS to temporarily raise that cap to meet demand.
Refugees and Asylum Seekers
To qualify as a refugee or asylee, one must demonstrate fear of persecution in their native country because of race, religion, nationality, political opinion, or membership in a particular social group. Refugees apply from another country and then are resettled in the United States, while asylees apply from within the United States.
From the 1970s through the mid-1990s, more than 100,000 refugees were admitted during some years, typically from Southeast Asia and countries in the former Soviet Union (see Figure 6). Since then, refugee admissions have decreased and their principal regions of origin have shifted to the Middle East and Africa.
Figure 5. Refugee Arrivals by Region of Origin, FY 1975-2021
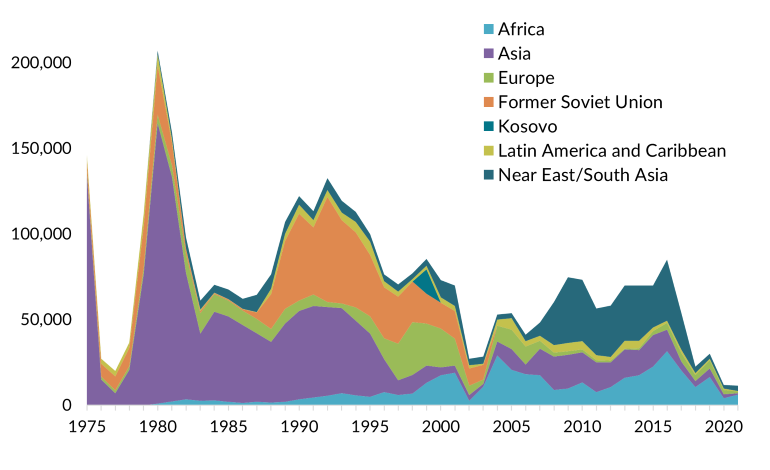
Sources: U.S. Refugee Processing Center, “Admissions & Arrivals—Refugee Admissions Report as of October 31, 2021,” updated October 31, 2021, available online; Andorra Bruno, Refugee Admissions and Resettlement Policy (Washington, DC: Congressional Research Service, 2018), available online.
The United States has historically led the world in numbers of refugees resettled annually, but there were major dips following the September 11, 2001, terrorist attacks and after Trump became president in 2017—a drop that has continued into the Biden administration. In FY 2021, the United States admitted the fewest refugees since the modern resettlement framework was created in 1980: 11,411.
Meanwhile, recent filings of asylum cases, largely by Central Americans, have reached heights not seen in at least three decades . Asylum cases can be filed either defensively in immigration court if the applicant is already in removal proceedings, or affirmatively with USCIS. Among cases filed defensively, top countries of origin have shifted from Mexico and China in the early 2000s to El Salvador, Guatemala, and Honduras. There are less historical data available about affirmative cases, but Venezuela notably emerged as a top country of origin among that group in 2017.
The number of asylum grants increased slightly from 2017 to 2019, but the number of denials increased even more. As a result, the asylum approval rate decreased, largely due to increased pressure on immigration judges to adjudicate cases faster and new policies narrowing asylum eligibility. New filings have outpaced adjudications, so by the end of FY 2021 there were 640,000 asylum cases pending in immigration courts and 386,000 pending at USCIS.
Illegal Flows
The population of unauthorized immigrants in the United States has been relatively stable at an estimated 11 million for the past decade, after reaching a peak of 12 million in 2007. However, its composition has changed: The number of unauthorized immigrants from Mexico dropped by more than 2 million since 2007, although Mexicans still make up about half the unauthorized population, the largest share of any nationality. Over the same period other unauthorized immigrant populations have grown, mainly from Asian countries including India, China, and the Philippines, and from El Salvador, Guatemala, and Honduras.
From 2010 to 2017, visa overstayers accounted for most of the growth in the overall unauthorized population. However, most unauthorized immigrants from Central America crossed the border illegally. Indeed, for most years since FY 2014 more migrants from El Salvador, Guatemala, and Honduras have crossed illegally than single Mexican men seeking U.S. jobs, who had comprised the vast majority of apprehensions in previous decades. Compared to previous Mexican migrants, higher shares of Central Americans come as families and seek asylum.
Figure 6. U.S. Border Patrol Southwest Border Encounters by Nationality, FY 2000-21
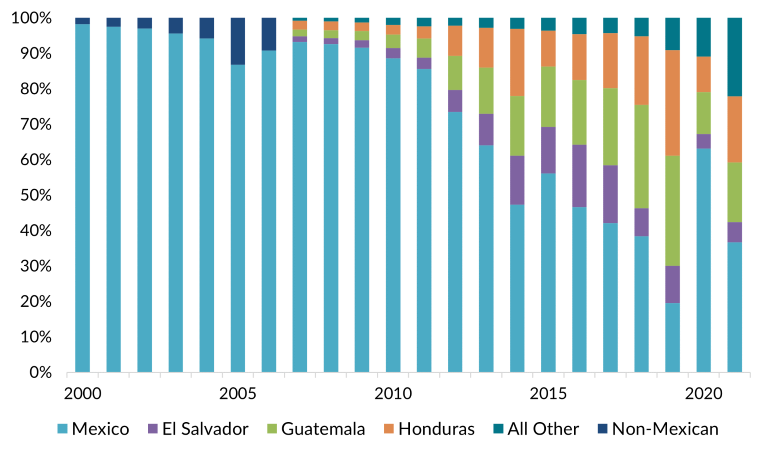
Note: Data from FY 2000-06 denote encounters only of either Mexicans or non-Mexicans; subsequent data also specify arrivals from El Salvador, Guatemala, and Honduras.
Sources: Data for FY 2000-06 are from U.S. Border Patrol, “U.S. Border Patrol Apprehensions From Mexico and Other Than Mexico (FY 2000 - FY 2020),” accessed December 8, 2021, available online. Data for FY 2007-20 are from U.S. Border Patrol, “U.S. Border Patrol Nationwide Apprehensions by Citizenship and Sector,” accessed December 8, 2021, available online. Data for FY 2021 are from U.S. Customs and Border Protection, “Southwest Land Border Encounters,” updated November 15, 2021, available online.
This change has posed challenges for a U.S. border strategy designed to target illegal crossings by adults from Mexico. Criminal prosecution, expedited removal, detention, and other consequences designed for adults are more difficult to apply to families and unaccompanied children expressing fears of returning to their origin countries.
What Next? Prospects for Reform and the Future of U.S. Immigration
The nearly 60-year-old U.S. immigration system was designed in response to factors that are increasingly disconnected from current economic and demographic realities. The U.S. population is aging, with the U.S. Census Bureau estimating that seniors over age 65 will outnumber children under 18 by 2034, potentially straining pension and health-care systems. Additionally, the gap between labor demand and the skills of U.S. workers is projected to widen. Demand for lower-skill jobs in health care, hospitality, and other fields is expected to grow, but U.S. workers’ rising education levels make them less likely to fill these jobs. And the U.S. population grew by the lowest rate on record, at just 0.1 percent, in 2020.
Immigration could help solve these issues by filling certain labor-market gaps and increasing the number of workers contributing to social welfare systems.
However, heightened divisions around immigration have made addressing these issues more complex. Political tensions have created a Congress unwilling to consider most reforms in a bipartisan manner. As such, near-term action on immigration is likely to come instead from the executive branch, meaning that immigration policy will continue to change every time the White House switches between the parties. Yet this pendulum swing will still occur within the bounds of the existing legislative framework as determined by the courts, preventing a wholescale reimagining of the system that might be needed to address changing circumstances. Neither skepticism of immigration nor labor-market challenges are new issues, but the fractured nature of U.S. politics is a novel development for a country that is in so many ways defined by its immigrant history. Absent a political breakthrough, the immigration system remains an antiquated, inflexible one.
The historical aspects of this article draw in part from a prior 2013 U.S. country profile published by the Migration Information Source, Immigration in the United States: New Economic, Social, Political Landscapes with Legislative Reform on the Horizon, by Faye Hipsman and Doris Meissner.
Sources
Bruno, Andorra. 2018. Refugee Admissions and Resettlement Policy. Washington, DC: Congressional Research Service. Available online.
Capps, Randy, Julia Gelatt, Ariel G. Ruiz Soto, and Jennifer Van Hook. 2020. Unauthorized Immigrants in the United States: Stable Numbers, Changing Origins. Washington, DC: Migration Policy Institute (MPI). Available online.
Chishti, Muzaffar and Jessica Bolter. 2021. Two Decades after 9/11, National Security Focus Still Dominates U.S. Immigration System. Migration Information Source, September 22, 2021. Available online.
Chishti, Muzaffar, Julia Gelatt, and Doris Meissner. 2021. Rethinking the U.S. Legal Immigration System: A Policy Road Map. Washington, DC: MPI. Available online.
Chishti, Muzaffar and Faye Hipsman. 2015. In Historic Shift, New Migration Flows from Mexico Fall Below Those from China and India. Migration Information Source, May 21, 2015. Available online.
Cohn, D’Vera. 2015. Future Immigration Will Change the Face of America by 2065. Pew Research Center, October 5, 2015. Available online.
Hipsman, Faye and Doris Meissner. 2013. Immigration in the United States: New Economic, Social, Political Landscapes with Legislative Reform on the Horizon. Migration Information Source, April 16, 2013. Available online.
International Social Survey Programme. 2005. ZA3910: International Social Survey Programme: National Identity II - ISSP 2003. Available online.
---. 2015. International Social Survey Programme: National Identity III – ISSP 2013. Available online.
Israel, Emma and Jeanne Batalova. 2020. Mexican Immigrants in the United States. Migration Information Source, November 5, 2020. Available online.
Krogstad, Jens Manuel and Mark Hugo Lopez. 2020. Hispanic Voters Say Economy, Health Care and COVID-19 Are Top Issues in 2020 Presidential Election. Pew Research Center, September 11, 2020. Available online.
Martin, Philip. 2017. Immigration and Farm Labor: From Unauthorized to H-2A for Some? Washington, DC: MPI. Available online.
Meissner, Doris, Faye Hipsman, and T. Alexander Aleinikoff. 2018. The U.S. Asylum System in Crisis: Charting a Way Forward. Washington, DC: MPI. Available online.
Migration Policy Institute (MPI). N.d. U.S. Immigrant Population and Share over Time, 1850-Present. MPI Migration Data Hub. Accessed December 3, 2021. Available online.
---. N.d. Immigrant Population by State, 1990-Present. MPI Migration Data Hub. Accessed December 2, 2021. Available online.
---. N.d. State Immigration Data Profiles: United States. MPI Migration Data Hub. Accessed December 1, 2021. Available online.
Page Act of 1975. Public Law 43–141. U.S. Statutes at Large 18 (1875): 477. Available online.
Pew Research Center. 2020. In Changing U.S. Electorate, Race and Education Remain Stark Dividing Lines. Washington, DC: Pew Research Center. Available online.
Refugee Act of 1980. Public Law 96—212. U.S. Statutes at Large 94 (1980): 102. Available online.
Simonsen, Kristina Bakkær. 2016. How the Host Nation’s Boundary Drawing Affects Immigrants’ Belonging. Journal of Ethnic and Migration Studies 42 (7): 1153-76.
Smith, Samantha and Carroll Doherty. 2016. A Divide Between College, Non-College Republicans. Pew Research Center, March 1, 2016. Available online.
Solano, Giacomo and Thomas Huddleston. 2020. Migrant Integration Policy Index 2020, Key Findings: USA, 2019. Accessed December 2, 2021. Available online.
U.S. Citizenship and Immigration Services (USCIS). 2021. Refugee Timeline. Updated November 9, 2021. Available online.
---. N.d. Form I-765 Application for Employment Authorization, All Receipts, Approvals, Denials Grouped by Eligibility Category and Filing Type. Accessed December 3, 2021. Available online.
U.S. Department of Homeland Security (DHS). 2021. Table 7. Persons Obtaining Lawful Permanent Resident Status by Type and Detailed Class of Admission: Fiscal Year 2019. Updated January 26, 2021. Available online.
U.S. Department of State. N.d. Annual Report of Immigrant Visa Applicants in the Family-Sponsored and Employment-Based Preferences Registered at the National Visa Center as of November 1, 2020. Accessed December 3, 2021. Available online.
---. N.d. Table XVI(A) Classes of Nonimmigrants Issued Visas (Including Crewlist Visas and Border Crossing Cards) Fiscal Years 1996 – 2000. Accessed December 20, 2021. Available online.
U.S. Refugee Processing Center. 2021. Admissions & Arrivals—Refugee Admissions Report as of October 31, 2021. Updated October 31, 2021. Available online.
Warren, Robert. N.d. US Undocumented Population Continued to Fall from 2016 to 2017, and Visa Overstays Significantly Exceeded Illegal Crossings for the Seventh Consecutive Year. New York: Center for Migration Studies. Available online.
Waslin, Michele. 2020. The Use of Executive Orders and Proclamations to Create Immigration Policy: Trump in Historical Perspective. Journal on Migration and Human Security 8 (1): 54-67. Available online.
Waters, Mary C. and Marisa Gerstein Pineau, eds. 2015. The Integration of Immigrants into American Society. Washington, DC: The National Academies Press. Available online.
World Bank. N.d. Population, Total - United States. Accessed December 1, 2021. Available online.
Younis, Mohamed. 2020. Americans Want More, Not Less, Immigration for First Time. Gallup, July 1, 2020. Available online.