

Senior Immigrants in the United States in 2010
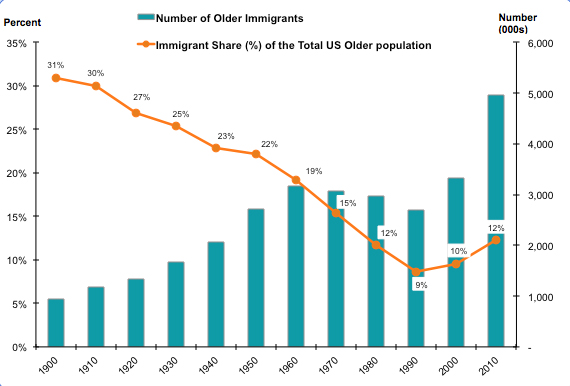
Following a steady decline between 1960 and 1990, the number of older immigrants (those age 65 and over) in the United States almost doubled between 1990 and 2010, from 2.7 million to nearly 5 million. These seniors now account for 12 percent of the 40 million immigrants in the United States — a share that is much lower than the historical high. In 1960, 33 percent of the nation's 9.7 million immigrants were 65 or older, mostly Europeans who arrived during the early 20th century wave of immigration.
Since the 1965 revisions to the U.S. immigrant admission system, which expanded the number and diversified immigrants' countries of origin, the vast majority of newcomers have been younger, working-age adults. As a result, the proportion of elderly among immigrants dropped sharply in the post-1965 period: from 33 percent in 1960 to 11 percent in 2000. However, the older-age immigrant population has been rebounding for two main reasons.
The first is demographic: an increasing number of working-age adults who arrived during the 1980s and the 1990s are aging into the 65 and older group. Their numbers, while still small, are projected to increase over time following overall immigration patterns, especially given the post-recession slowdown in new immigration flows.
The second reason is that once immigrants become U.S. citizens, they can sponsor their parents to come to the United States. As the number of younger immigrants who naturalize increases, the number of older parents eligible to immigrate will also increase.
Today, older immigrants account for 12 percent of the 40.4 million elderly in the United States and for 12 percent of the 40 million immigrant population.
With May designated as Older Americans Month, we present this Spotlight focusing on older immigrants (age 65 and older) residing in the United States. This article examines their population size, geographic distribution, socioeconomic characteristics, labor force participation and income, and admission categories using data from the U.S. Census Bureau's 2010 American Community Survey (ACS) and 2000 Decennial Census, and the Department of Homeland Security's Office of Immigration Statistics (OIS) for fiscal years 2010 and 2011.
Click on the bullet points below for more information.
Size and Distribution
- The number of older immigrants in the United States declined between 1960 and 1990 but nearly doubled between 1990 and 2010.
- Older immigrants made up about 12 percent of all immigrants in 2010.
- More than one-quarter of the foreign born from Europe and Canada were 65 and older.
- More than half of all older immigrants resided in California, Florida, and New York.
Demographic and Socioeconomic Overview
- Older immigrant women outnumbered men in 2010.
- Among elderly immigrants, 25 percent were octogenarians or older.
- Less than one-third of immigrant seniors were Hispanic versus 47 percent of all immigrants.
- More than two in five older immigrants resided in the United States for four decades or longer.
- One of every seven older immigrants in the United States in 2010 was born in Mexico.
- Nearly three-quarters of older immigrants were naturalized U.S. citizens in 2010.
- More than half of older immigrants in 2010 were Limited English Proficient.*
- Almost 45 percent of Limited English Proficient older immigrants spoke Spanish.
- Two of every five older immigrants had less than a high school education.
Work and Income
- Older immigrant men were more likely to participate in the labor force than older native-born men.
- Compared to older natives, immigrant seniors were more likely to live in low-income families.
- The share of older immigrants with low incomes has stayed relatively constant since 1990.
- The total personal income of older immigrants* was lower than those of older U.S. born.
- Older immigrants were more dependent on Supplemental Security Income than natives.
Admissions of Older Immigrants
- About 53,000 older immigrants obtained green cards in the United States in 2011.
- Over the past two decades, the annual number of older immigrants who became LPRs fluctuated significantly.
- Nearly 43,000 immigrant seniors became U.S. citizens in 2010.
Size and Distribution
The number of older immigrants in the United States declined between 1960 and 1990 but nearly doubled between 1990 and 2010.
The older foreign-born population grew during the first half of the 20th century before declining between 1960 and 1990. Between 1990 and 2000, this trend reversed, with the number of older immigrants rising from 2.7 million to 3.3 million between 1990 and 2000 and further increasing to 4.9 million by 2010.
The immigrant share of the elderly population in the United States declined significantly between 1900 and 1990 (from 31 percent to 9 percent) before increasing from 1990 to 2010 to 12 percent (see Figure 1).
|
|
||
|
Older immigrants made up about 12 percent of all immigrants in 2010.
U.S.-born seniors accounted for 13 percent of the 269.4 million native-born population, whereas older immigrants accounted for 12 percent of the roughly 40 million immigrants in the United States (see Figure 2). For comparison, the elderly represented 14 percent of the total immigrant population in 1990 and 11 percent in 2000.
More than one-quarter of the foreign born from Europe and Canada were 65 and older.
There was a considerable diversity in age composition of immigrants from different regions. In 2010, seniors accounted for 29 percent of immigrants from Europe and 26 percent from Canada and Bermuda.
|
|
||
|
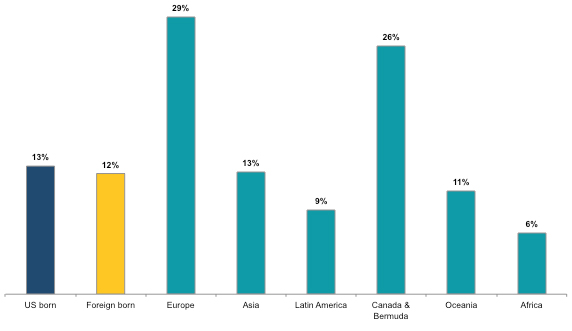
By contrast, just 13 percent of the foreign born from Asia were 65 and above, with 11 percent from Oceania, 9 percent from Latin America, and 6 percent from Africa.
Specifically, more than half of immigrants from Latvia (54 percent) were seniors, as were 47 percent of immigrants from Italy, 45 percent from Hungary and Austria, 43 percent from Greece, 41 percent from Denmark, and 40 percent from Germany.
The countries of origin with the lowest share of older persons among the total immigrant population in the United States — under 4 percent — were Saudi Arabia (1 percent); Kuwait, Nepal, Yemen, and Sudan (2 percent each); and Kenya and Cameroon (3 percent each).
(Note: Countries with less than 200 unweighted observations in the data sample are excluded.)
More than half of all older immigrants resided in California, Florida, and New York.
California had the largest number of older immigrants (1.3 million, or 27 percent of the total elderly immigrant population) in 2010, followed by Florida (677,000, or 14 percent), and New York (653,000, or 13 percent).
These three states accounted for 54 percent (or 2.7 million) of all older immigrants compared to 45 percent (or 18.1 million) of all immigrants.
Demographic and Socioeconomic Overview
Older immigrant women outnumbered men in 2010.
Of all older immigrants residing in the United States in 2010, 59 percent were women and 41 percent were men. Similarly, there were more women than men among U.S.-born seniors: 57 percent versus 43 percent. Among immigrants of all ages, the gender balance was nearly equal (51 percent women versus 49 percent men).
Among elderly immigrants, 25 percent were octogenarians or older.
Of the 4.9 million older immigrants in the United States, about 32 percent were between the ages of 65 and 69, 43 percent were in their 70s, and another 25 percent were 80 years of age or older. Among the native-born elderly, the proportions were tilted toward the oldest age groups: 28 percent of those who are 80 and above, 41 percent in their 70s, and 31 percent between 65 and 69.
Less than one-third of immigrant seniors were Hispanic versus 47 percent of all immigrants.
In 2010, the majority of older immigrants were non-Hispanic. Only 31 percent reported Hispanic or Latino origin compared to a higher share (47 percent) among the overall foreign-born population.
More than two in five older immigrants resided in the United States for four decades or longer.
In 2010, 44 percent of the 4.9 million older immigrants reported that they arrived in the United States before 1970 (see Figure 3). Another 17 percent came in the 1970s and 14 percent came in the 1980s. Fewer than 25 percent came between 1990 and 2010. In contrast, 62 percent of all immigrants came within the last two decades.
|
|
||
|

One of every seven older immigrants in the United States in 2010 was born in Mexico.
The top 10 countries of origin of older immigrants in the United States are Mexico (735,000, or 15 percent), Cuba (301,000, or 6 percent), the Philippines (290,000, or 6 percent), China/Hong Kong (277,000, or 6 percent), Germany (243,000, or 5 percent), Canada (204,000, or 4 percent), Italy (172,000, or 3 percent), India (165,000, or 3 percent), South Korea (144,000, or 3 percent), and Vietnam (142,00, or 3 percent).
See the top 10 countries for all immigrants in the United States here.
Nearly three-quarters of older immigrants were naturalized U.S. citizens in 2010.
Older immigrants were much more likely to be naturalized U.S. citizens than the overall foreign-born population: Among the older foreign born, 73 percent were naturalized U.S. citizens in 2010 compared to 44 percent among the overall foreign-born population.
The share of older foreign born who were naturalized U.S. citizens has increased slightly in the past two decades, from 71 percent in 1990 to 73 percent in 2010.
More than half of older immigrants in 2010 were Limited English Proficient.*
About 23 percent of the 5 million older immigrants in 2010 reported speaking "English only" while another 21 percent reported speaking English "very well." In contrast, 56 percent (or about 2.8 million) reported speaking English less than "very well," higher than the 52 percent reported among all foreign born age 5 and older.
The share of older immigrants who reported speaking English less than "very well" has increased from 41 percent in 1990 to 51 percent in 2000 to 56 percent in 2010.
(Note: *"Limited English Proficient" refers to any person age 5 and older who reported speaking English "not at all," "not well," or "well" on their survey questionnaire. Individuals who reported speaking only English or speaking English "very well" are considered proficient in English).
Almost 45 percent of Limited English Proficient older immigrants spoke Spanish.
Among the roughly 2.8 million older immigrants who were Limited English Proficient in 2010, the most common language spoken was Spanish (1.2 million, or 45 percent), followed by "Chinese"* (260,000, or 9 percent), Russian (124,000, or 5 percent), Korean (118,000, or 4 percent), Filipino or Tagalog (113,000, or 4 percent), and Vietnamese (112,000, or 4 percent).
(Note: *"Chinese" includes Mandarin and Cantonese.)
Two of every five older immigrants had less than a high school education.
In 2010, 42 percent of the 4.9 million older immigrants had less than a high school degree, compared to 32 percent among the 33.6 million foreign-born adults age 25 and older and 19 percent of the 35.5 million native-born older population.
On the other end of the education continuum, 21 percent of older immigrants had a bachelor's degree or higher, similar the older native born (21 percent). In comparison, 27 percent of all foreign-born adults had a bachelor's degree or higher.
About 37 percent of older immigrants and 41 percent of all immigrants age 25 and older had a high school degree or some college education. Both were lower than the rate for native-born older persons (59 percent).
|
Income Definitions
|
||
|
Work and Income
Older immigrant men were more likely to participate in the labor force than older native-born men.
In 2010, older foreign-born men were slightly more likely to be in the labor force (23 percent) than older native-born men (21 percent).
Regardless of nativity, women were less likely to be in the labor force than men. Older foreign-born women were nearly as likely to be in the labor force as their native-born counterparts (11 percent versus 12 percent).
Compared to older natives, immigrant seniors were more likely to live in low-income families.
Some 16 percent of older immigrants lived below the poverty line in 2010, while another 24 percent were in families with annual incomes between 100 percent and 199 percent of the official poverty level. This means that about 40 percent of immigrant seniors living in the United States were in low-income families (i.e., below 200 percent of the poverty line),* compared to 30 percent of the native-born elderly.
(Note: * Whether an individual falls below the official poverty line depends not only on total family income, but also on the size of the family, the number of children, and the age of the householder. ACS reports total income over the 12 months preceding the interview date. The poverty threshold in 2010 for adults age 65 years or older was $10,458 for persons residing alone and $13,180 for those residing in two-person households.)
The share of older immigrants with low incomes has stayed relatively constant since 1990.
The share of older immigrants with low incomes declined slightly from 40 percent in 1990 to 38 percent in 2000 before rising back to 40 percent in 2010. By contrast, the share of older natives with low incomes has declined from 38 percent in 1990 to 30 percent in 2000 and remained at the same level (30 percent) in 2010.
The total personal income of older immigrants* was lower than those of older U.S. born.
In 2010, half of the 4.9 million older immigrants had less than $11,000 in yearly individual income from all sources. Of the 34 million U.S.-born elderly, half lived on $20,000 or less.
(Note: *Excludes those in group quarters. Income refers to the previous year (2009). See Income Definitions sidebar for a complete description of income sources that comprise total personal income.)
Older immigrants were more dependent on Supplemental Security Income than natives.
In 2009,* nearly 72 percent of immigrants 65 and older and 90 percent of natives received Social Security benefits (see Table 1). Compared to native elderly, immigrants were less likely to receive income from assets such as interest, dividends, and rental income) (31 percent versus 18 percent) and from retirement income (40 percent versus 20 percent). In contrast, immigrants were three times more likely to rely on the federal program known as Supplemental Security Income (12 percent versus 4 percent). Close to one out of five immigrants and natives received income from employment.
|
|
||||||||||||||||||||||||||||||||||||||
|
||||||||||||||||||||||||||||||||||||||
Admissions of Older Immigrants
About 53,000 older immigrants obtained green cards in the United States in 2011.
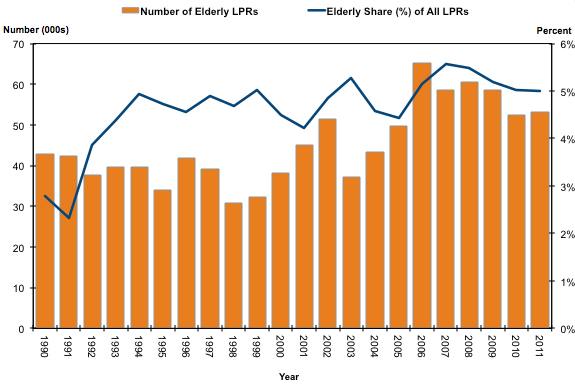
In 2011, 53,126 older immigrants received lawful permanent residence (or green cards) in the United States, accounting for 5 percent of the 1.1 million foreign born who became lawful permanent residents (LPRs).
Over the past two decades, the annual number of older immigrants who became LPRs fluctuated significantly.
The number of older immigrants who obtained green cards hit the lowest point of the 1990-2011 period in 1998 (30,717) and the highest point in 2006 (65,119). The share of all LPR admissions that were older persons increased significantly between 1990 and 1994 and remained roughly around 5 percent since then (see Figure 4).
|
|
||
|
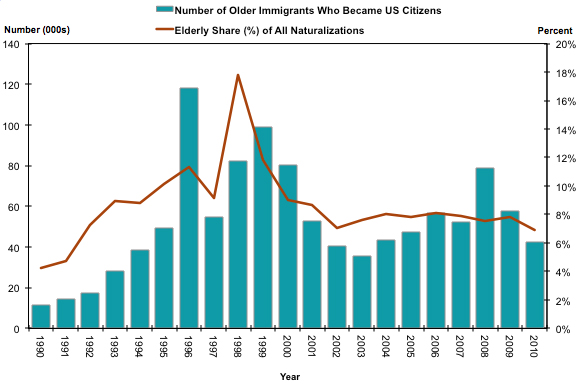
Nearly 43,000 immigrant seniors became U.S. citizens in 2010. In 2010, 42,618 older immigrants naturalized, accounting for about 7 percent of the 620,000 immigrants who naturalized (See Figure 5).
|
|
||
|
Sources
Gibson, Campbell J. and Emily Lennon. 1999. Report 29. "Historical Census Statistics on the Foreign-born Population of the U.S.: 1850-1990" Table 7. Age and Sex of the Foreign-Born Population: 1870 to 1990. Available online.
U.S. Census Bureau. 2010 American Community Survey. Accessed from Steven Ruggles, J. Trent Alexander, Katie Genadek, Ronald Goeken, Matthew B. Schroeder, and Matthew Sobek. Integrated Public Use Microdata Series: Version 5.0 [Machine-readable database]. Minneapolis: University of Minnesota, 2012. Available online.
For information about ACS methodology, sampling error, and nonsampling error, click here.
U.S. Department of Homeland Security, Office of Immigration Statistics. 2012. 2010 and 2011 Yearbook of Immigration Statistics, various tables. Available online.