

Spotlight on Naturalization Trends in 2005
Source Spotlights are often updated as new data become available. Please click here to find the most recent version of this Spotlight.
This spotlight examines foreign nationals ages 18 and older who became U.S. citizens (i.e., naturalized) in 2005. It also highlights some of the trends surrounding naturalization since the 1980s.
Unless otherwise noted, the data are from the Department of Homeland Security's Office of Immigration Statistics (OIS) Annual Flow Report, as well from tables available on the OIS website.
Note: all yearly data is for the government's fiscal year (October 1 through September 30).
Click on the bullet points below for more information:
- There were 14.9 million naturalized citizens in the United States in 2005.
- In 2004, an estimated eight million lawful permanent residents were eligible for naturalization.
- In 2005, United States Citizenship and Immigration Services (USCIS) naturalized 604,280 lawful permanent residents.
- Approximately 85 percent of those whose applications were processed in 2005 were granted citizenship.
- About 552,000 applications for naturalization were pending a decision at the end of 2005.
- Between 1996 and 2005, over 6.6 million people became naturalized citizens, more than double the three million who naturalized between 1986 and 1995.
Special Note To be eligible for naturalization, an immigrant must be at least 18 years of age; have lawful permanent residence (a green card) for at least five continuous years (three continuous years if the individual is married to a U.S. citizen); no criminal record; the ability to read, write, and speak simple words and phrases in English; and knowledge and understanding of American history fundamentals and U.S. government principles. - The increased number of naturalizations since 1994 is partly a result of the legalization of unauthorized immigrants under the 1986 Immigration Reform and Control Act (IRCA).
- The average wait for a naturalization application to be processed was reduced from two years in 1997 to between six and nine months as of October 2001.
- In 2005, foreign born from Mexico, the Philippines, and India accounted for 25 percent of naturalizations.
- Of the Mexican foreign born naturalized in 2005, the largest groups resided in California, Texas, and Illinois.
- Almost half of those who naturalized in 2005 lived in three states: California, New York, and Florida.
- The state with the fewest naturalizations in 2005 was Wyoming.
- The New York, Los Angeles, and Chicago metropolitan areas were home to more than one-third of new U.S. citizens.
- Of the 604,280 immigrants naturalized in 2005, the largest group was professional and technical workers.
- The median number of years of residence between the date of legal immigration and the date of naturalization was eight years.
There were 14.9 million naturalized citizens in the United States in 2005.
Of the 35.7 million total foreign born in the United States in 2005, 14.9 million (42 percent) were naturalized citizens, according to 2005 American Community Survey (ACS) estimates. Note: ACS estimates do not include students living in dormitories, inmates in prisons, and people in nursing homes.
In 2004, an estimated eight million lawful permanent residents were eligible for naturalization.
OIS estimated there were eight million lawful permanent residents (LPRs) eligible to naturalize in 2004. They included 2.3 million (29.3 percent) LPRs in California, 1.1 million (13.6 percent) in New York, 800,000 (9.9 percent) in Texas, and 600,000 (7.8 percent) in Florida. (Source: USCIS, “Estimates of the Legal Permanent Resident Population and Population Eligible to Naturalize in 2004.” Available online.
In 2005, United States Citizenship and Immigration Services (USCIS) naturalized 604,280 lawful permanent residents.
In 2005, USCIS naturalized 604,280 lawful permanent residents, which represents about 1.7 percent of the total U.S. foreign-born population of 35.7 million (2005 ACS estimates).
Approximately 85 percent of those whose applications were processed in 2005 were granted citizenship.
Of the 712,527 naturalization applications processed in 2005, USCIS approved 84.9 percent. The remaining 15.1 percent (108,247 applications) were denied citizenship for one or more of the following reasons: applicant could not prove five years of permanent residence in the United States, applicant was determined to lack allegiance to the United States, applicant was determined to have bad moral character, or applicant failed the English language or American civics test.
About 552,000 applications for naturalization were pending a decision at the end of 2005.
By the end of 2005, there were 552,000 applications pending a decision. Since 1996, the number of people naturalizing every year has not always matched the number of people applying for naturalization due to delays in application processing. Therefore, users have to exercise caution in interpreting trends in naturalization over time.
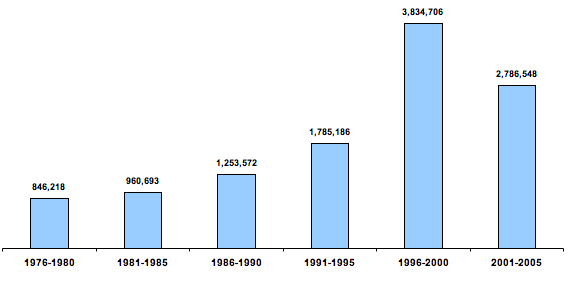
Between 1996 and 2005, over 6.6 million people became naturalized citizens, more than double the three million who naturalized between 1986 and 1995.
The number of individuals naturalized between 1996 and 2005 (6,621,254) increased 2.2 times from the 1986-1995 period (3,038,758) (see Figure 1).
|
|
||
|
The increased number of naturalizations since 1994 is partly a result of the legalization of unauthorized immigrants under the 1986 Immigration Reform and Control Act (IRCA).
Under IRCA, 2.7 million unauthorized immigrants received lawful permanent resident (LPR) status. This increased the pool of foreign born eligible for naturalization.
The average wait for a naturalization application to be processed was reduced from two years in 1997 to between six and nine months as of October 2001.
The average wait time for a naturalization application was two years in 1997, and because of USCIS's Backlog Elimination Plan, was reduced to between six and nine months as of October 2001. Applications that take more than six months are deemed backlogged, though the six-month waiting period has been criticized by the USCIS's Ombudsman as too long.
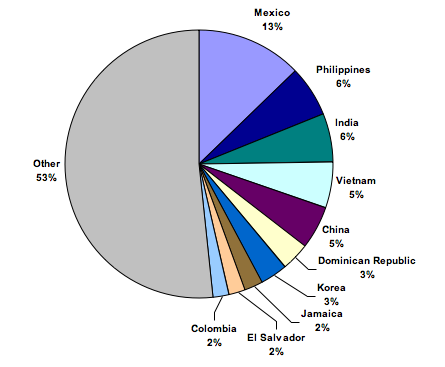
In 2005, foreign born from Mexico, the Philippines, and India accounted for 25 percent of naturalizations.
Of those naturalized in 2005, 12.8 percent were born in Mexico (77,089), 6.1 percent in the Philippines (36,673), and six percent in India (35,962) (see Figure 2).
According to ACS 2005, of the 35.7 million foreign born in the United States, 30.7 percent were from Mexico (10.9 million), 4.5 percent were from the Philippines (about 1.6 million), and four percent were from India (1.4 million).
|
|
||
|
Back to the top
Of the Mexican foreign born naturalized in 2005, the largest groups resided in California, Texas, and Illinois.
More than half (52.5 percent) of the Mexican foreign born naturalized in 2005 resided in California (40,510), while 16.5 percent were in Texas (12,736) and 6.2 percent were in Illinois (4,818).
Almost half of those who naturalized in 2005 lived in three states: California, New York, and Florida.
In 2005, 28.2 percent of those who naturalized lived in California (170,489), 14 percent in New York (84,624), and 7.1 percent in Florida (42,999) (see Table 1).
|
|
||||||||||||||||||||||||||||||||||||||||||||||||||||||||||||||||||||||||||||||||||||||||||
|
The state with the fewest naturalizations in 2005 was Wyoming.
In Wyoming, 134 lawful permanent residents naturalized in 2005. The next-lowest numbers of naturalizations were in North Dakota (203), Montana (209), Iowa (234), South Dakota (354), and West Virginia (362).
The New York, Los Angeles, and Chicago metropolitan areas were home to more than one-third of new U.S. citizens.
Approximately 18 percent of all those who naturalized in 2005 lived in the greater New York metropolitan area (108,440), 12.9 percent lived in the greater Los Angeles metropolitan area (78,184), and 4.5 percent lived in the greater Chicago metropolitan area (27,054). These metropolitan areas — together with San Francisco (4.2 percent), Miami (four percent), Washington (3.7 percent), and Boston (three percent) metropolitan areas — were home to 50.3 percent of persons who became U.S. citizens in 2005.
Of the 604,280 immigrants naturalized in 2005, the largest group was professional and technical workers.
In 2005, 9.3 percent (56,381) of those naturalizing reported their occupation as management or professional workers. Persons in production, transportation, and material moving occupations represented 4.8 percent (29,049), and those in sales and office occupations constituted 4.5 percent (27,155). About 62 percent of those naturalized in 2005 (375,024) did not report or had an unknown occupation.
The median number of years of residence between the date of legal immigration and the date of naturalization was eight years.
Among persons who became U.S. citizens in 2005, the median number of years of residence between the date of legal immigration and the date of naturalization was eight years. This number has remained the same since 2002.
Additional Resources
Rytina, Nancy F (2006). “Estimates of the Legal Permanent Resident Population and Population Eligible to Naturalize in 2004.” USCIS, February. Available online.
DHS's Office of Immigration Statistics: Data on naturalizations
Definitions of terms can be found at the website of the Office of Immigration Statistics