

Venezuelan Immigrants in the United States

A young Venezuelan girl (Photo: Valentin Guerrero)
The Venezuelan immigrant population in the United States has more than tripled in size since the turn of the century, and much of this growth has occurred in just a few years, as Venezuela’s economic and political destabilization has led to a mass exodus across the Americas and beyond. The population of Venezuelan immigrants in the United States has risen 54 percent since 2015, when it stood at 256,000. By 2018, this population had grown to 394,000, making it the fifth-largest South American immigrant population in the United States.
With its vast oil reserves, Venezuela has both benefited and suffered from fluctuations in the petroleum market. In the early 2000s, President Hugo Chávez redistributed much of the country’s oil wealth toward social welfare programs for the poor while also nationalizing private businesses, which contributed to the disruption of the national economy and decline in private investments. Following Chávez’s death in 2013, Nicolás Maduro largely maintained his predecessor’s approach to economic policy. Since then, Venezuelans have experienced a sharp decline in economic fortunes, sky-high inflation, rising corruption, and political persecution—a constellation of conditions that has pushed about 5.1 million Venezuelans out, most in the last few years. The majority have moved within Latin America, with Colombia, Peru, and Chile receiving the most Venezuelan refugees and migrants. Smaller numbers have migrated to countries outside the region, mainly to the United States and Spain.
Until recently, the number of Venezuelans in the United States was relatively small compared to immigrants from other South American countries. For instance, the 107,000 Venezuelans who resided in the United States in 2000 were roughly equal to one-fifth the number of immigrants from Colombia (509,000)—the largest source of South American immigrants to the United States. In 2018, by comparison, there were about half as many Venezuelans (394,000) as Colombians (790,000) in the United States, making them the fifth-largest immigrant group from South America, after those from Colombia, Brazil (473,000), Peru (467,000), and Ecuador (443,000).
Figure 1. Venezuelan Immigrant Population in the United States, 1980-2018
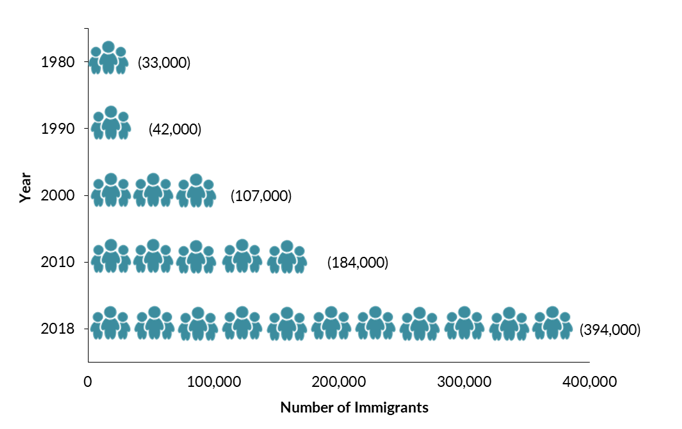
Sources: Data from U.S. Census Bureau 2010 and 2018 American Community Surveys (ACS), and 1980, 1990, and 2000 Decennial Census.
The top destination worldwide for Venezuelan refugees and migrants is Colombia, accounting for about 36 percent of the 5.1 million Venezuelans living outside of Venezuela, according to April 2020 estimates published by the Regional Inter-Agency Coordination Platform for Refugees and Migrants from Venezuela – Response for Venezuelans (R4V). Other common destination countries have significantly smaller shares of Venezuelan refugees and migrants, including Peru (with 17 percent), Chile (9 percent), and the United States (7 percent).
In comparison to the total foreign-born population in the United States, Venezuelan migrants have higher educational attainment and are more likely to obtain green cards as immediate relatives of U.S. citizens or through employment channels. However, they are also more likely to live in poor families and lack health insurance.
Using data from the U.S. Census Bureau (the most recent 2018 American Community Survey [ACS] and pooled 2014–18 ACS data), the Department of Homeland Security’s Yearbook of Immigration Statistics, and World Bank annual remittance data, this Spotlight provides information on the Venezuelan immigrant population in the United States, focusing on its size, geographic distribution, and socioeconomic characteristics.
Click on the bullet points below for more information:
- Distribution by State and Key Cities
- English Proficiency
- Age, Education, and Employment
- Income and Poverty
- Immigration Pathways and Naturalization
- Health Coverage
- Diaspora
- Remittances
Distribution by State and Key Cities
More than half of Venezuelan immigrants in the United States reside in Florida (53 percent). The next largest destination state, Texas, accounts for another 12 percent. The top four counties by concentration in the 2014–18 period were Miami-Dade, FL; Broward, FL; Orange County, FL; and Harris County, TX. Together, these four counties accounted for almost half (45 percent) of Venezuelan immigrants in the country.
Figure 2. Top Destination States for Venezuelan Immigrants in the United States, 2014–18
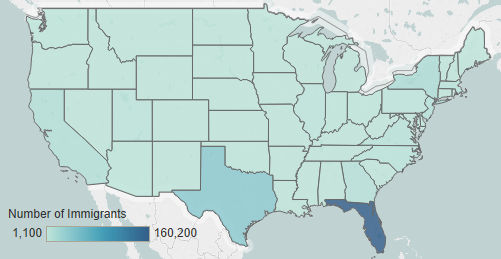
Note: Pooled 2014-18 ACS data were used to get statistically valid estimates at the state level for smaller-population geographies. For details, visit the Migration Policy Institute (MPI) Data Hub for an interactive map showing the geographic distribution of immigrants by state and county, available online.
Source: MPI tabulation of data from the U.S. Census Bureau pooled 2014-18 ACS.
As of 2014–18, the greater Miami, Orlando, and Houston metropolitan areas were home to 53 percent of Venezuelan immigrants. Another 7 percent of Venezuelans resided in the greater New York metropolitan area, and 3 percent lived in greater Tampa.
Figure 3. Top Metropolitan Areas of Residence for Venezuelan Immigrants in the United States, 2014–18
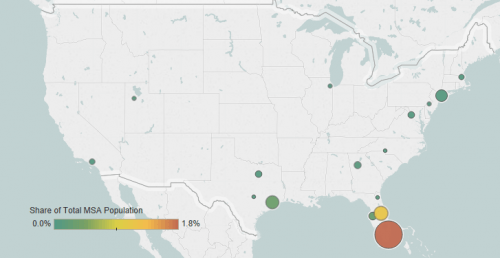
Note: Pooled 2014-18 ACS data were used to get statistically valid estimates at the metropolitan statistical-area level for smaller-population geographies. For details, visit the MPI Data Hub for an interactive map showing the geographic distribution of immigrants by metropolitan area, available online.
Source: MPI tabulation of data from the U.S. Census Bureau pooled 2014-18 ACS.
Even in U.S. metropolitan areas with larger Venezuelan populations—including Miami, Orlando, and Houston—these immigrants make up fairly small shares of the overall metro area population, less than 2 percent as of 2014–18.
Table 1. Top Concentrations by Metropolitan Area for Venezuelan Immigrants, 2014-18
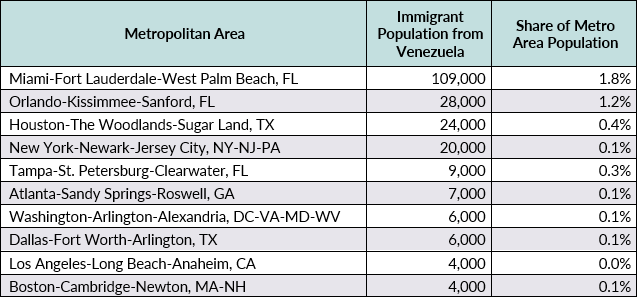
Source: MPI tabulation of data from the U.S. Census Bureau pooled 2014-18 ACS.
Click here for an interactive map that highlights the metropolitan areas with the highest concentrations of immigrants. Select Venezuela from the dropdown menu.
Venezuelan immigrants are less likely to be proficient in English and speak English at home than the overall U.S. foreign-born population. In 2018, about 49 percent of Venezuelan immigrants ages 5 and over reported limited English proficiency, compared to 47 percent of the total foreign-born population. Approximately 6 percent of Venezuelan immigrants spoke only English at home, compared to 17 percent of all immigrants.
Note: Limited English proficiency refers to those who indicated on the ACS questionnaire that they spoke English less than “very well.”
Age, Education, and Employment
The median age of Venezuelan immigrants was 38 years as of 2018, slightly older than the U.S.-born population (36 years). Both groups were younger than the overall foreign-born population (45 years). Venezuelan immigrants—like immigrants overall—were more likely than the native born to be of working age (18 to 64; see Figure 4).
Figure 4. Age Distribution of the U.S. Population by Origin, 2018

Note: Numbers may not add up to 100 as they are rounded to the nearest whole number.
Source: MPI tabulation of data from the U.S. Census Bureau, 2018 ACS.
Compared to foreign- and U.S.-born adults (ages 25 and older), Venezuelan immigrant adults have considerably higher levels of education, especially in terms of four-year college degrees. In 2018, more than half of Venezuelan immigrants held at least a bachelor’s degree (57 percent), significantly higher than all foreign-born and U.S.-born adults (32 percent and 33 percent, respectively). Venezuelan immigrants were also more likely to have a graduate or professional degree than the other two groups (21 percent, versus 14 percent for all immigrants and 12 percent for the U.S. born). Only 6 percent of Venezuelan immigrants lacked a high school diploma, compared to 27 percent of all immigrant adults.
Venezuelan immigrants participate in the U.S. labor force at a much higher rate than the overall immigrant and native-born populations. In 2018, 73 percent of Venezuelan immigrants ages 16 and older were in the civilian labor force, compared to 66 percent of all immigrants and 62 percent of the native born. Thirty-seven percent Venezuelan immigrants were employed in management, business, science, and arts occupations—their top employment field—followed by 22 percent in sales and office occupations.
Figure 5. Employed Workers in the Civilian Labor Force (ages 16 and older) by Occupation and Origin, 2018
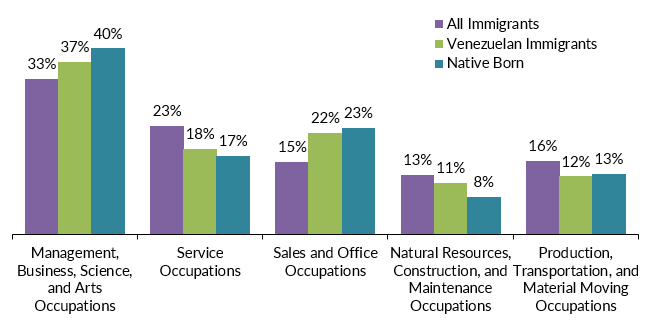
Source: MPI tabulation of data from the U.S. Census Bureau 2018 ACS.
In 2018, Venezuelan immigrants had a median household income of $56,000. This was lower than that of the overall foreign- and native-born populations: $60,000 and $62,000, respectively.
Venezuelan immigrants were more likely to live in families with income levels below the official poverty threshold (19 percent), compared to all immigrants (15 percent) and the U.S. born (13 percent).
Immigration Pathways and Naturalization
In 2018, 34 percent of Venezuelan immigrants in the United States were naturalized U.S. citizens, a share much lower than among the total foreign-born population (51 percent).
Compared to all immigrants, many Venezuelans came to the United States relatively recently. Fifty-seven percent of Venezuelan immigrants arrived in 2010 or later, a share twice that of post-2010 arrivals among all immigrants (23 percent). Another 20 percent of Venezuelans arrived between 2000 and 2009, and 23 percent before 2000 (see Figure 6).
Figure 6. Immigrants from Venezuela and All Immigrants in the United States by Period of Arrival, 2018
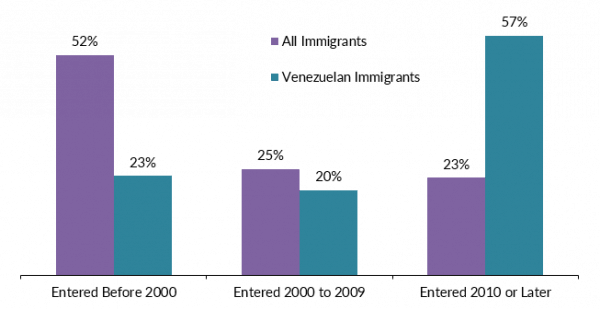
Note: Numbers may not add up to 100 as they are rounded to the nearest whole number.
Source: MPI tabulation of data from the U.S. Census Bureau 2018 ACS.
In FY 2018, approximately 11,700 (1 percent) of the nearly 1.1 million new lawful permanent residents (LPRs, also known as green-card holders) were from Venezuela. More than half of Venezuelan immigrants who received green cards that year did so as immediate relatives of U.S. citizens (54 percent), while new LPRs overall were less likely to receive green cards through this channel (44 percent; see Figure 7). The second most common immigration pathway for Venezuelans was employment-based preferences (21 percent), which also accounted for a larger share of new Venezuelan LPRs than of all new LPRs (13 percent).
Figure 7. Immigration Pathways of Venezuelan Immigrants and All Immigrants in the United States, 2018
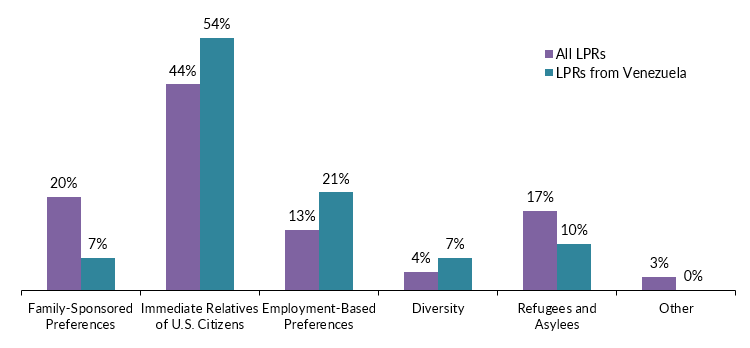
Notes: Family-sponsored: Includes adult children and siblings of U.S. citizens as well as spouses and children of green-card holders. Immediate relatives of U.S. citizens: Includes spouses, minor children, and parents of U.S. citizens. Diversity: The Immigration Act of 1990 established the Diversity Visa Lottery to allow entry to immigrants from countries with low rates of immigration to the United States. The law states that 55,000 diversity visas in total are made available each fiscal year.
Source: MPI tabulation of data from Department of Homeland Security (DHS) Office of Immigration Statistics, 2018 Yearbook of Immigration Statistics (Washington, DC: DHS, 2019), available online.
Although most Venezuelan immigrants in the United States are legally present, approximately 50,000 were unauthorized in 2016, according to Migration Policy Institute (MPI) estimates, comprising less than half of 1 percent of the 11.3 million unauthorized immigrants in the United States.
The Deferred Action for Childhood Arrivals (DACA) program provides temporary relief from deportation and work authorization to unauthorized immigrants who came to the United States as children and who meet program requirements. As of September 30, 2019, Venezuelans made up 2,150 of the approximately 653,000 DACA recipients.
Venezuelan immigrants are more likely to have private health insurance than the overall foreign-born population, and less likely to be covered by public health insurance programs than both all immigrants and the native born (see Figure 8). As of 2018, Venezuelans were also more likely to be uninsured (25 percent), compared to the overall immigrant population (20 percent) and the native born (7 percent).
Figure 8. Health Coverage for Venezuelan Immigrants, All Immigrants, and the Native Born, 2018
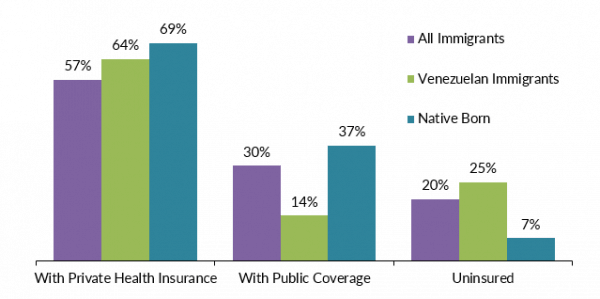
Note: The sum of shares by type of insurance is likely to be greater than 100 because people may have more than one type of insurance.
Source: MPI tabulation of data from the U.S. Census Bureau, 2018 ACS.
The Venezuelan diaspora in the United States is comprised of approximately 587,000 individuals who were either born in Venezuela or reported Venezuelan ancestry or Hispanic origin, according to MPI tabulations of 2018 ACS data.
Global remittances to Venezuela have gone through two periods of significant growth. The first turning point was between 2002 and 2003, when annual remittance inflows jumped from $19 million to $208 million. After a drop to $143 million in 2004, annual remittances remained relatively level for about a decade until they began to climb steadily again after 2013, driven in large part by rapidly accelerating economic and political instability in the country under the Maduro presidency and rising emigration. In 2019, Venezuela’s remittance inflow reached $289 million, a record high. Remittances represented less than 0.5 percent of Venezuela’s gross domestic product (GDP) in 2019.
Figure 9. Annual Remittance Flows to Venezuela, 1990 to 2019
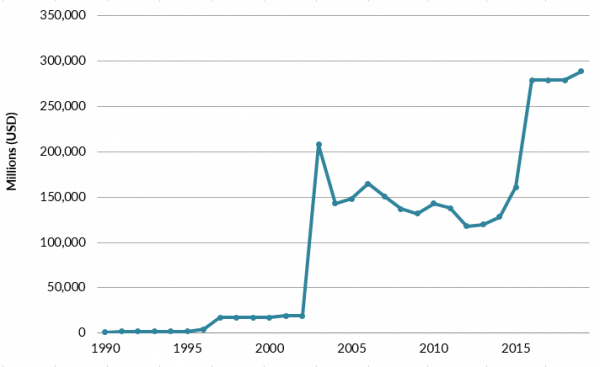
Source: MPI tabulations of data from the World Bank, “Annual Remittances Data,” updated October 2019, available online.
Visit the Data Hub’s collection of interactive remittances tools, which track remittances by inflow and outflow, between countries, and over time.
Sources
Freier, Luisa Feline and Nicolas Parent. 2018. A South American Migration Crisis: Venezuelan Outflows Test Neighbors' Hospitality. Migration Information Source, July 18, 2018. Available online.
Noe-Bustamante, Luis, Antonio Flores, and Sono Shah. 2019. Facts on Hispanics of Venezuelan Origin in the United States, 2017. Pew Research Center, Hispanic Trends, September 16, 2019. Available online.
Regional Inter-Agency Coordination Platform for Refugees and Migrants from Venezuela – Response for Venezuelans (R4V). 2020. Venezuelan Refugees & Migrants in the Region. Updated April 2020. Available online.
---. N.d. Refugees and Migrants from Venezuela. Accessed April 6, 2020. Available online.
United Nations Population Division. N.d. International Migrant Stock by Destination and Origin. Accessed January 22, 2020. Available online.
U.S. Census Bureau. 2020. 2018 American Community Survey. Accessed from Steven Ruggles, Sarah Flood, Ronald Goeken, Josiah Grover, Erin Meyer, Jose Pacas, and Matthew Sobek. Integrated Public Use Microdata Series: Version 10.0 [dataset]. Minneapolis: University of Minnesota. Available online.
---. N.d. 2019 American Community Survey—Explore Census Data. Accessed January 23, 2020. Available online.
U.S. Department of Homeland Security (DHS) Office of Immigration Statistics. 2019. 2018 Yearbook of Immigration Statistics. Washington, DC: DHS. Available online.
U.S. Department of State. 2020. Visa Bulletin for January 2020. Updated January 2020. Available online.
World Bank. 2019. Annual Remittances Data. Updated October 2019. Available online.