

Cuban Immigrants in the United States

In 2013, about 77 percent of the more than 1.1 million Cuban immigrants in the United States resided in Florida. (Photo: dragonflyajt/Flickr)
Cuba has occupied a unique place in U.S. immigration law and policy as a result of fraught political relations and geographic proximity between the two countries. Cubans have been one of the ten largest immigrant-origin groups in the United States since 1970 and are currently the seventh largest. As of 2013, more than 1.1 million Cuban immigrants resided in the United States, accounting for 2.8 percent of the total U.S. immigrant population.
Large-scale Cuban migration to the United States began in earnest after the overthrow of the Fulgencio Batista regime by Castro-led revolutionaries in 1959. The population of Cuban immigrants in the United States more than doubled between 1950 and 1960, rising from 71,000 to 163,000. Since the mid-1960s, most Cubans who land on U.S. soil have been admitted to the United States through special humanitarian provisions of U.S. law instead of the traditional immigration pathways through which nationals of all other countries are required to seek admission. In 1965, the first Cuban “boatlift”—when the Cuban government opened the port of Camarioca to anyone wishing to depart the country—prompted the United States and Cuba to reach an agreement allowing Cubans to fly to Miami on U.S.-government chartered “Freedom Flights:” about 300,000 Cubans arrived this way between 1965 and 1973.
In 1966, Congress passed the Cuban Adjustment Act (CAA), which provides a pathway to permanent residence for Cubans who have been physically present in the United States for at least one year. In 1980, maritime departures from Cuba surged dramatically during the Mariel boatlift: 125,000 Cubans (and 25,000 Haitians) arrived in South Florida. Subsequently, boat migration again rose from a few hundred in 1989 to a few thousand in 1993. U.S. Coast Guard interdictions of Cubans jumped from 2,882 in fiscal year (FY) 1993 to 38,560 in FY 1994.
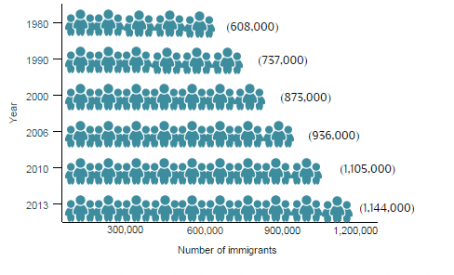
The 1994 surge prompted two far-reaching migration agreements between Cuba and the United States in 1994 and 1995 designed to ensure safe, legal, and orderly immigration. Combined with the CAA, the 1994 and 1995 migration accords established the current “wet-foot, dry-foot” policy: unless they cite fears of persecution, Cubans intercepted at sea are returned to Cuba, where the Cuban government, per signed accords, cannot retaliate against them, while those who reach the United States are generally permitted to stay and may adjust to permanent resident status after one year. The Cuban population in the United States has steadily grown, accelerating from 737,000 in 1990 to 1,144,000 in 2013.
|
Figure 1. Cuban Immigrant Population in the United States, 1980-2013
|
|
Sources: Data from U.S. Census Bureau 2006, 2010, and 2013 American Community Surveys (ACS), and Campbell J. Gibson and Kay Jung, "Historical Census Statistics on the Foreign-born Population of the United States: 1850-2000" (Working Paper no. 81, U.S. Census Bureau, Washington, DC, February 2006), www.census.gov/population/www/documentation/twps0029/twps0029.html. |
The historic December 2014 decision by President Barack Obama and Cuban President Raúl Castro to normalize relations between the United States and Cuba may herald revisions to immigration policy and create changes that affect the future migration of Cubans to the United States. Click here to read an article about the U.S.-Cuba migration relationship.
Currently, the United States is home to the largest number of Cuban immigrants; other popular destinations include Spain (115,000), Italy (32,000), Puerto Rico (17,000), Mexico (14,000), and Canada (11,000), according to mid-2013 estimates by the United Nations Population Division. Click here to view an interactive map showing where migrants from Cuba and other countries have settled worldwide.
Compared with the overall immigrant and U.S.-born populations, Cubans were less likely to be proficient in English, had lower educational attainment, and earned a lower household income. Using data from the U.S. Census Bureau (the most recent 2013 American Community Survey [ACS] as well as pooled 2009-13 ACS data), and the Department of Homeland Security’s Yearbook of Immigration Statistics, this Spotlight provides information on the Cuban immigrant population in the United States, focusing on its size, geographic distribution, and socioeconomic characteristics.
|
Definitions
|
|
|
Click on the bullet points below for more information:
- Distribution by State and Key Cities
- English Proficiency
- Educational and Professional Attainment
- Income and Poverty
- Immigration Pathways and Naturalization
- Health Coverage
- Diaspora
Distribution by State and Key Cities
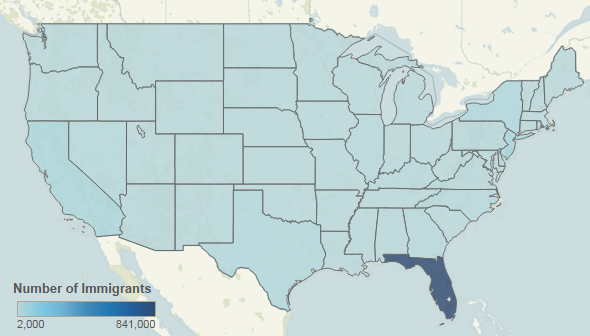
The majority of Cuban immigrants settled in Florida (77 percent). The top four counties with Cuban immigrants were Miami-Dade County, Broward County, Hillsborough County, and Palm Beach County—all in Florida. Together, these four counties accounted for about 68 percent of the total Cuban immigrant population in the United States.
|
Figure 2. Top Destination States for Cuban Immigrants in the United States, 2009-13
|
|
Source: MPI tabulation of data from U.S. Census Bureau pooled 2009-13 ACS. |
Click here for an interactive map that shows the geographic distribution of immigrants by state and county. Select Cuba from the dropdown menu to see which states and counties have the most Cuban immigrants.
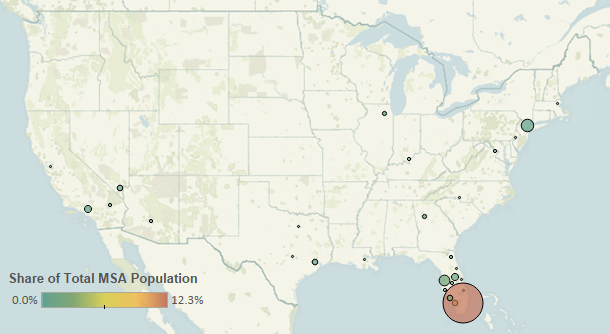
In the 2009-13 period, the U.S. cities with the largest number of Cuban immigrants were the greater Miami and New York metropolitan areas. These metropolitan areas accounted for about 70 percent of Cuban immigrants in the United States.
|
Figure 3. Top Metropolitan Destinations for Cuban Immigrants in the United States, 2009-13
|
|
Source: MPI tabulation of data from the U.S. Census Bureau pooled 2009-13 ACS. |
|
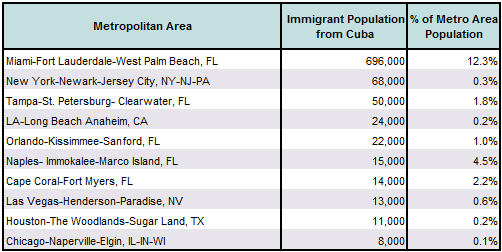
Table 1. Top Concentrations by Metropolitan Area for the Foreign Born from Cuba, 2009-13
|
|
Source: MPI tabulation of data from the U.S. Census Bureau pooled 2009-13 ACS. |
Click here for an interactive map that highlights the metropolitan areas with the highest concentrations of immigrants. Select Cuba from the dropdown menu to see which metropolitan areas have the most Cuban immigrants.
Cuban immigrants were much less likely to be proficient in English and speak English at home than the overall foreign-born population. In 2013, about 62 percent of Cuban immigrants (ages 5 and over) reported limited English proficiency, compared to 50 percent of the total foreign-born population. Approximately 6 percent of Cuban immigrants spoke only English at home, versus 16 percent of all immigrants.
Note: Limited English proficiency refers to those who indicated on the ACS questionnaire that they spoke English less than “very well.”
Educational and Professional Attainment
Cuban immigrants tend to have lower educational attainment compared to the overall foreign- and native-born populations. As of 2013, 21 percent of Cuban immigrants (ages 25 and over) had a bachelor’s degree or higher, compared to 28 percent of the total immigrant population and 30 percent of the native-born population.
Cuban immigrants were older than both the foreign- and native-born populations, and less likely to be of working age than the general immigrant population. The median age of Cuban immigrants was 52 years—compared to 43 for the overall foreign-born population and 36 for the native-born population. In 2013, 68 percent of Cuban immigrants were of working age (18 to 64), 28 percent were 65 and over, and 4 percent were under 18. In comparison, 80 percent of all foreign born in the United States were of working age, 14 percent were 65 and over, and 6 percent were under 18. Meanwhile, 60 percent of the native-born population was of working age, 14 percent was 65 and over, and 26 percent was under 18.
Click here to view an interactive chart showing age and sex distribution of Cuban immigrants.
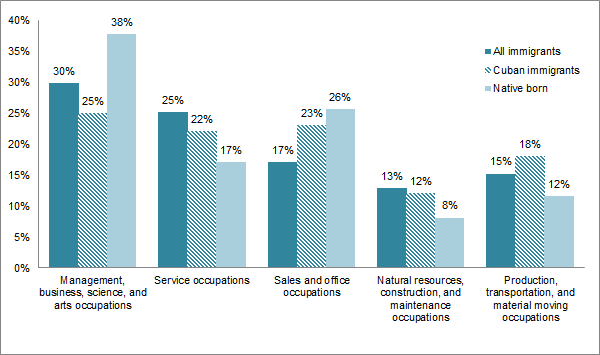
Cuban immigrants participated in the labor force at a lower rate than the overall immigrant and native-born populations. In 2013, about 57 percent of Cuban immigrants ages 16 and over were in the civilian labor force, compared to 67 percent and 63 percent of the total foreign- and native-born populations, respectively. Cuban immigrants were more likely to be employed in sales and office occupations (23 percent) and production, transportation, and material moving (18 percent) than the foreign-born population.
|
Figure 4. Employed Workers in the Civilian Labor Force (ages 16 and older) by Occupation and Origin, 2013
|
|
Source: MPI tabulation of data from the U.S. Census Bureau 2013 ACS. |
Cuban immigrants had much lower incomes compared to the total foreign- and native-born populations. In 2013, the median income of households headed by a Cuban immigrant was $35,400, compared to $48,100 and $53,000 for overall immigrant and native-born households, respectively.
Twenty-three percent of Cuban immigrants lived in poverty, a rate higher than that of immigrants (19 percent) and natives (15 percent).
Immigration Pathways and Naturalization
Cubans were more likely to be naturalized than immigrants overall. Under the Cuban Adjustment Act, Cuban immigrants are able to receive a green card after one year of residence in the United States, putting them on a faster path to citizenship. As of 2013, 59 percent of the approximately 1.1 million Cuban immigrants residing in the United States were naturalized U.S. citizens, compared to 47 percent of the total foreign-born population.
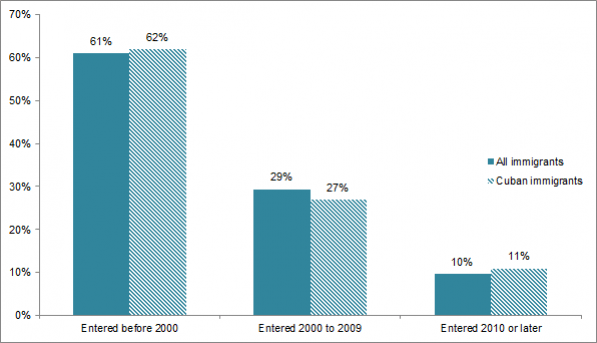
More than 60 percent of Cuban immigrants arrived prior to 2000, followed by 27 percent who arrived between 2000 and 2009, and 11 percent in 2010 or later—similar to the distribution of all immigrants in the United States.
|
Figure 5. Immigrants from Cuba and All Immigrants in the United States by Period of Arrival, 2013
|
|
Source: MPI tabulation of data from the U.S. Census Bureau 2013 ACS. |
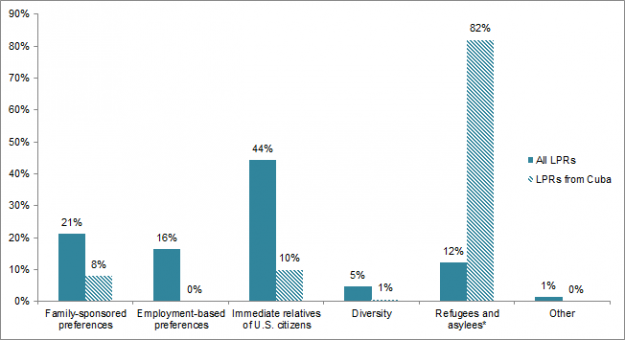
As a result of the special immigration policy towards Cubans, the majority of Cuban immigrants obtain lawful permanent residence through the humanitarian protection channel. In FY 2013, 82 percent of the 32,219 Cuban individuals granted permanent residence received green cards under the “refugee” category, a much higher percentage compared to all lawful permanent residents (LPRs) (12 percent). They were much less likely than the overall LPR population to gain green cards as immediate relatives of U.S. citizens (10 percent versus 44 percent), or through family-sponsored preferences (8 percent versus 21 percent).
|
Figure 6. Immigration Pathways of Cuban Immigrants and All Immigrants in the United States, 2013
|
|
Notes: Family-sponsored: Includes adult children and siblings of U.S. citizens as well as spouses and children of green-card holders. Immediate relatives of U.S. citizens: Includes spouses, minor children, and parents of U.S. citizens. Diversity Visa Lottery: The Immigration Act of 1990 established the Diversity Visa (DV) Lottery to allow entry to immigrants from countries with low rates of immigration to the United States. The law states that 55,000 diversity visas in total are made available each fiscal year. *Although Cubans typically do not arrive through refugee resettlement programs, their adjustment to LPR status falls under the refugee category per the 1966 Cuban Adjustment Act. Source: MPI tabulation of data from Department of Homeland Security (DHS), 2013 Yearbook of Immigration Statistics (Washington, DC: DHS Office of Immigration Statistics, 2014), www.dhs.gov/yearbook-immigration-statistics-2013-lawful-permanent-residents. |
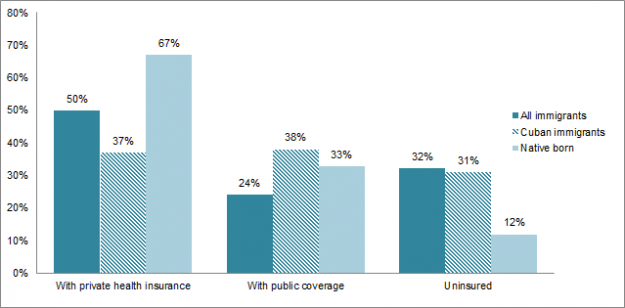
Cuban immigrants were just as likely to be uninsured (31 percent) as the immigrant population overall (32 percent), but more likely to be uninsured than the native-born population (12 percent). Cuban immigrants were more likely to be covered by public health insurance (38 percent) compared to other immigrants (24 percent), but much less likely to have private insurance coverage (37 percent) than both the native- (67 percent) and foreign-born (50 percent) populations.
|
Figure 7. Health Coverage for Cuban Immigrants, All Immigrants, and the Native Born, 2013
|
|
Note: The sum of shares by type of insurance is likely to be greater than 100 because people may have more than one type of insurance. Source: MPI tabulation of data from the U.S. Census Bureau 2013 ACS. |
The Cuban diaspora population in the United States was comprised of approximately 2.2 million individuals who were either born in Cuba or reported Cuban ancestry or race, according to tabulations from the U.S. Census Bureau’s 2013 ACS.
Sources
Department of Homeland Security (DHS), Office of Immigration Statistics. 2014. 2013 Yearbook of Immigration Statistics. Washington, DC: DHS Office of Immigration Statistics. Available Online.
Gibson, Campbell J. and Kay Jung. 2006. Historical Census Statistics on the Foreign-born Population of the United States: 1850-2000. Working Paper no. 81, U.S. Census Bureau, Washington, DC, February 2006. Available Online.
Martin, Daniel C. and James E. Yankay. 2014. Refugees and Asylees: 2013. Annual Flow Report, August 2014. Washington, DC: DHS Office of Immigration Statistics. Available Online.
Rosenblum, Marc C. and Faye Hipsman. 2015. Normalization of Relations with Cuba May Portend Changes to U.S. Immigration Policy. Migration Information Source, January 2015. Available Online.
U.S. Census Bureau. 2013. 2013 American Community Survey (ACS). American FactFinder. Available Online.
Wasem, Ruth Ellen. 2009. Cuban Migration to the United States: Policy and Trends. Washington, DC: Congressional Research Service. Available Online.