

Central American Immigrants in the United States

The majority of Central American immigrants who have obtained lawful permanent residence in the United States did so through family reunification channels. (Photo: Ryan Rodrick Beiler/Shutterstock)
Large-scale Central American migration to the United States, an overwhelmingly post-1980s phenomenon, has been driven mainly by economic hardship and political instability in the region. In 2013, approximately 3.2 million Central American immigrants resided in the United States—the majority from the so-called Northern Triangle formed by El Salvador, Guatemala, and Honduras—representing 7 percent of the country’s 41.3 million immigrants.
The Central American population in the United States was very small in the 1950s and 1960s, consisting of a mix of privileged individuals and low-skilled workers. Of the total 48,900 Central American immigrants in 1960, Panama was the largest origin country, followed by Nicaragua, Honduras, and El Salvador. The Central American immigrant population began its rapid increase in the late 1970s when a series of civil wars broke out in the region. Thousands of Salvadorans and Guatemalans, many from rural areas with little formal education, fled north in response to the repression and violence of war. In contrast, those who left Nicaragua were mostly well-educated elites. The Reagan administration, as part of its regional foreign policy, actively discouraged Salvadorans and Guatemalans from applying for political asylum: their approval rates were less than 3 percent in 1984, compared to 12 percent for Nicaraguans, and far below the rates for Poles (32 percent) and Iranians (60 percent). However, many whose applications were declined remained in the United States without authorization under the protection of local religious congregations in the sanctuary movement.
Although migration rates from Central America declined with the end of the conflicts in the early 1990s, the Central American immigrant population has continued to grow. Migrant social networks previously developed to assist those seeking political refuge now facilitate economic migration, with many individuals entering the United States illegally. In the late 1990s, unauthorized Salvadorans, Hondurans, and Nicaraguans became eligible for Temporary Protected Status (TPS)—provisional protection against deportation with work authorization—due to a series of natural disasters in those countries. TPS has been renewed for Honduras and Nicaragua until July 2016, and El Salvador until September 2016. In addition, many unauthorized Central Americans have legalized their status through a set of discretionary measures and legislation passed by the U.S. government, including the 1997 Nicaraguan Adjustment and Central American Relief Act (NACARA). However, the number of unauthorized immigrants from Central America has continued to rise.
Since 2011, a growing number of unaccompanied children, largely from the Northern Triangle, have arrived at the U.S.-Mexico border. From the start of fiscal year (FY) 2014 through July 31, 2015, 72,968, or 74 percent, of the unaccompanied minors apprehended by U.S. Customs and Border Protection (CBP) at the U.S.-Mexico border were from El Salvador, Guatemala, and Honduras.
From 1980 to 2013, the size of the Central American immigrant population grew nine-fold from 354,000 to 3.2 million (see Figure 1). The population more than tripled in the 1980s, almost doubled in the 1990s, and continued to grow more than 56 percent between 2000 and 2013.
Figure 1. Central American Immigrant Population in the United States, 1980-2013
![]()
Sources: Data from U.S. Census Bureau 2006, 2010, and 2013 American Community Surveys (ACS), and Campbell J. Gibson and Kay Jung, "Historical Census Statistics on the Foreign-born Population of the United States: 1850-2000" (Working Paper no. 81, U.S. Census Bureau, Washington, DC, February 2006), available online.
Immigrants from El Salvador, Guatemala, and more recently, Honduras accounted for 90 percent of the total growth between 1980 and 2013, while other Central American groups showed moderate increases. Between 2010 and 2013, the number of Costa Rican and Nicaraguan immigrants actually decreased.
Click here for an interactive chart showing changes in the number of immigrants from Central America in the United States over time. Select individual Central American countries from the dropdown menu.
In 2013, El Salvador, Guatemala, and Honduras were the top three countries of origin for Central American immigrants (see Table 1). Together, they accounted for 85 percent of immigrants from Central America, followed by Nicaragua, Panama, Costa Rica, and Belize.
Table 1. Distribution of Central American Immigrants by Country of Origin, 2013
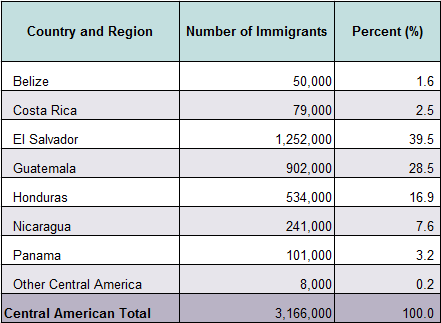
Source: Migration Policy Institute (MPI) tabulation of data from the U.S. Census Bureau, 2013 ACS.
The majority of Central American immigrants who have obtained lawful permanent residence in the United States (also known as receiving a “green card”) did so through family reunification channels. Compared to the overall foreign- and native-born populations, Central American immigrants on average were significantly less educated, but more likely to be employed. Although Central American countries share similar religious and linguistic backgrounds, there are great variations in socioeconomic characteristics among the different origin countries. Due to the high share of individuals from the Northern Triangle, the indicators for all Central American immigrants are biased towards immigrants from those three countries.
Of the total 4.2 million Central American immigrants worldwide, the vast majority (80 percent) resided in the United States, with the rest scattered in Central America and Europe, according to mid-2013 estimates by the United Nations Population Division. However, the international settlement pattern of each country’s immigrants is very different. For instance, between 80 percent and 90 percent of immigrants from Belize, El Salvador, Guatemala, and Honduras settled in the United States, compared to only 42 percent of Nicaraguan immigrants (46 percent reside in Costa Rica). Click here to view an interactive map showing where migrants from Central American countries among others have settled worldwide.
Definitions
Central America includes Belize, Costa Rica, El Salvador, Guatemala, Honduras, Nicaragua, and Panama.
The U.S. Census Bureau defines the foreign born as individuals who had no U.S. citizenship at birth. The foreign-born population includes naturalized citizens, lawful permanent residents, refugees and asylees, legal nonimmigrants (including those on student, work, or other temporary visas), and persons residing in the country without authorization.
The terms foreign born and immigrant are used interchangeably and refer to those who were born in another country and later emigrated to the United States. Data collection constraints do not permit inclusion of those who gained citizenship in a Central American country via naturalization and later moved to the United States.
Using data from the U.S. Census Bureau (the most recent 2013 American Community Survey [ACS] and pooled 2009-13 ACS data), the Department of Homeland Security’s Yearbook of Immigration Statistics, and the World Bank's annual remittance data, this Spotlight provides information on the Central American immigrant population in the United States, focusing on its size, geographic distribution, and socioeconomic characteristics.
Click on the bullet points below for more information:
- Distribution by State and Key Cities
- Language Diversity and English Proficiency
- Age, Education, and Employment
- Income and Poverty
- Immigration Pathways and Naturalization
- Health Coverage
- Diaspora
- Remittances
Distribution by State and Key Cities
Most immigrants from Central America have settled in California (28 percent), Texas (11 percent), and Florida (11 percent). The top four counties with Central American immigrants in 2009-13 were Los Angeles County in California, Harris County in Texas, Miami-Dade County in Florida, and Prince George’s County in Maryland. Together, these four counties accounted for about 30 percent of the total Central American immigrant population in the United States.
Figure 2. Top Destination States for Central American Immigrants in the United States, 2009-13
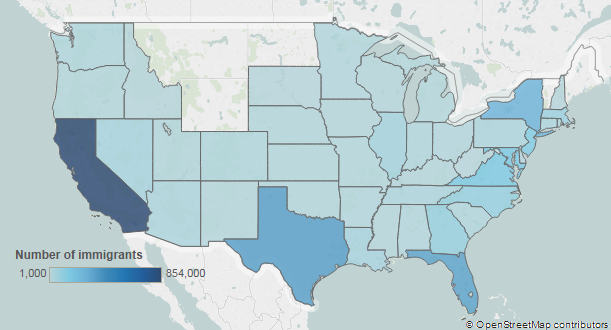
Note: Pooled 2009-13 ACS data were used to get statistically valid estimates at the state level for smaller-population geographies.
Source: MPI tabulation of data from the U.S. Census Bureau pooled 2009-13 ACS.
Click here for an interactive map that shows the geographic distribution of immigrants by state and county. Select individual Central American countries from the dropdown menu to see which states and counties have the most Central American immigrants.
In the 2009-13 period, the U.S. cities with the largest number of Central American immigrants were the greater Los Angeles, New York City, and Washington, DC metropolitan areas. These three metropolitan areas accounted for close to 40 percent of Central American immigrants in the United States.
Figure 3. Top Metropolitan Destinations for Central American Immigrants in the United States, 2009-13
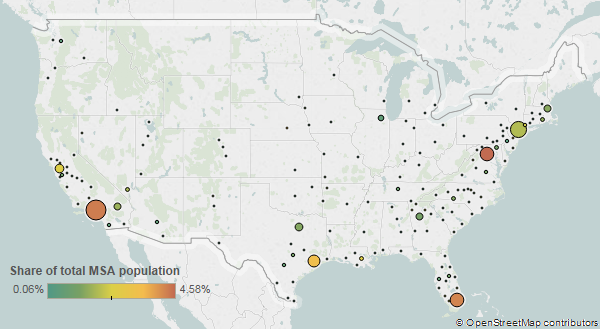
Note: Pooled 2009-13 ACS data were used to get statistically valid estimates at the metropolitan statistical-area level for smaller-population geographies.
Source: MPI tabulation of data from the U.S. Census Bureau pooled 2009-13 ACS.
Click here for an interactive map that highlights the metropolitan areas with the highest concentrations of immigrants. Select individual Central American countries from the dropdown menu to see which metropolitan areas have the most Central American immigrants.
Table 2. Top Concentrations by Metropolitan Area for the Foreign Born from Central America, 2009-13
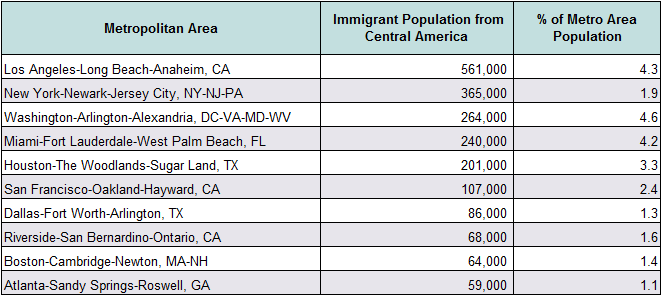
Source: MPI tabulation of data from the U.S. Census Bureau pooled 2009-13 ACS.
Click here for an interactive map that shows the metropolitan areas with the highest concentrations of immigrants from El Salvador, Guatemala, and Honduras, as well as the three combined. Select one population from the list and see which metropolitan areas have the most Northern Triangle immigrants.
Language Diversity and English Proficiency
Central American immigrants were both much less likely to be proficient in English and to speak English at home than the overall U.S. foreign-born population. In 2013, approximately 67 percent of Central American immigrants (ages 5 and over) reported limited English proficiency (LEP), compared to 50 percent of the total foreign-born population. English proficiency varied significantly by country of origin: less than 7 percent of immigrants from Belize and 26 percent of those from Panama were LEP, versus around 70 percent of immigrants from El Salvador, Honduras, and Guatemala. Approximately 7 percent of all Central American immigrants spoke only English at home, versus 16 percent of all immigrants.
Note: Limited English proficiency refers to those who indicated on the ACS questionnaire that they spoke English less than “very well.”
Age, Education, and Employment
The Central American immigrant population was younger than the overall foreign-born population but older than the native-born population. The median age of Central American immigrants was 38 years—compared to 43 for the foreign-born population overall and 36 for U.S. born. In 2013, a higher share of Central American immigrants were of working age (18 to 64) compared to both the total foreign- and U.S.-born populations (see Table 3). Notably, approximately 22 percent of Panamanian immigrants were ages 65 and older, the highest share among all Central American immigrant groups.
Table 3. Age Distribution by Origin, 2013
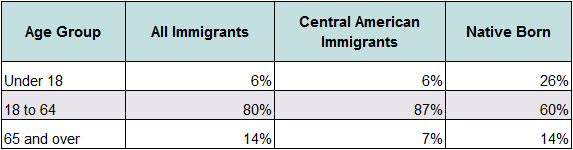
Source: MPI tabulation of data from the U.S. Census Bureau, 2013 ACS. Numbers may not add up to 100 as they are rounded to the nearest whole number.
Click here to view an interactive chart showing the age and sex distribution of the top immigrant-origin groups, including those from El Salvador.
Central American immigrants tend to have much lower educational attainment compared to the overall foreign- and native-born adult populations. In 2013, close to half (49 percent) of Central American immigrants ages 25 and over did not finish high school, compared to 30 percent of all immigrants and 10 percent of U.S.-born adults. Around 9 percent of Central American adults had a bachelor’s degree or higher, compared to 28 percent of the total immigrant population and 30 percent of native-born adults. Immigrants from Nicaragua (17 percent), Belize (19 percent), Costa Rica (23 percent), and Panama (27 percent) were significantly more likely to be college graduates compared to those from El Salvador, Guatemala, and Honduras (about 7 percent each).
Central American immigrants participated in the labor force at a higher rate than the overall immigrant and native-born populations. In 2013, about 75 percent of Central American immigrants ages 16 and over were in the civilian labor force, compared to 67 percent and 63 percent of all foreign and native born, respectively.
Central American immigrants were significantly more likely to be employed in service occupations (34 percent); natural resources, construction, and maintenance occupations (22 percent); and production, transportation, and material-moving occupations (18 percent) than both the overall foreign- and native-born populations (see Figure 4).
Figure 4. Employed Workers in the Civilian Labor Force (ages 16 and older) by Occupation and Origin, 2013
![]()
Source: MPI tabulation of data from the U.S. Census Bureau 2013 ACS.
In contrast, close to one-third of employed immigrants from Panama, Belize, and Costa Rica worked in management, business, science, and arts occupations, compared to less than 10 percent of their peers from Honduras, Guatemala, and El Salvador.
Central American immigrants had significantly lower incomes than the total foreign- and U.S.-born populations. In 2013, the median income of households headed by a Central American immigrant was $41,000, compared to $48,000 and $53,000 for overall immigrant and native-born households, respectively. All Central American immigrant groups, except for Costa Ricans, had lower median household income than the total foreign-born population.
In 2013, 22 percent of Central American immigrant families lived in poverty, higher than both all immigrant (18 percent) and native-born families (10 percent). Around 28 percent of immigrant families from Guatemala and Honduras were in poverty, versus 11 percent of those from Costa Rica.
Immigration Pathways and Naturalization
Central American immigrants were less likely than the total foreign-born population to be naturalized citizens, partly due to the large presence of TPS beneficiaries and unauthorized individuals ineligible for U.S. citizenship. In 2013, only 32 percent of the 3.2 million Central American immigrants residing in the United States were naturalized U.S. citizens, compared to 47 percent of all immigrants. Between half and two-thirds of immigrants from Belize, Costa Rica, Nicaragua, and Panama were naturalized citizens, compared to between 22 percent and 31 percent of immigrants from Honduras, Guatemala, and El Salvador.
In general, Central American immigrants have mirrored the arrival patterns of the overall immigrant population with some small variations. Central Americans were more likely than other origin groups to have entered the United States between 2000 and 2009 and less likely to have arrived since 2010 (see Figure 5). Approximately 57 percent of Central American immigrants arrived prior to 2000, followed by 36 percent who arrived between 2000 and 2009, and 7 percent in 2010 or later. The majority of immigrants from El Salvador (61 percent), Costa Rica (67 percent), Belize (74 percent), Nicaragua (75 percent), and Panama (77 percent) entered before 2000, while less than half (47 percent) of immigrants from Guatemala and Honduras entered during the same period.
Figure 5. Immigrants from Central America and All Immigrants in the United States by Period of Arrival, 2013
![]()
Source: MPI tabulation of data from the U.S. Census Bureau, 2013 ACS. Numbers may not add up to 100 as they are rounded to the nearest whole number.
The majority (84 percent) of Central American immigrants who became legal permanent residents (LPRs) in FY 2013 did so through family-based channels. Close to half (47 percent) of new Central American LPRs were immediate relatives of U.S. citizens, while 37 percent qualified via other family-sponsored preferences. Central American immigrants were much less likely to become LPRs via employment-based preferences (6 percent) or as refugees and asylees (4 percent) than the total LPR population (see Figure 6).
Figure 6. Immigration Pathways of Central American Immigrants and All Immigrants in the United States, 2013
![]()
Notes: Family-sponsored: Includes adult children and siblings of U.S. citizens as well as spouses and children of green-card holders. Immediate relatives of U.S. citizens: Includes spouses, minor children, and parents of U.S. citizens. Diversity Visa Lottery: The Immigration Act of 1990 established the Diversity Visa (DV) Lottery to allow entry to immigrants from countries with low rates of immigration to the United States. The law states that 55,000 diversity visas in total are made available each fiscal year. All Central American countries are eligible for the DV lottery except El Salvador.
Source: MPI tabulation of data from Department of Homeland Security (DHS), 2013 Yearbook of Immigration Statistics (Washington, DC: DHS Office of Immigration Statistics, 2014), available online.
Although petitioning as immediate relatives of U.S.-citizens was the primary pathway for almost all Central American groups in FY 2013, patterns of LPR channels varied by country. For instance, 10 percent of Costa Rican immigrants became LPRs via employment-based preferences, 7 percent of Guatemalan immigrants as asylees, and 7 percent of Salvadoran immigrants under other specific legislation (for example, cancellation of removal under NACARA).
As of 2015, about 204,000 Salvadorans, 61,000 Hondurans, and 2,800 Nicaraguans benefitted from TPS based on USCIS data.
Click here to read an article on TPS in the United States.
In the 2009-13 period, approximately 1.6 million Central American unauthorized immigrants resided in the United States, according to MPI estimates, representing 15 percent of the 11 million total unauthorized population. El Salvador, Guatemala, and Honduras are among the top five origin countries of unauthorized immigrants. In August 2015, MPI estimated that approximately 118,000 Central American youth were immediately eligible for the 2012 Deferred Action for Childhood Arrivals (DACA) program. As of June 30, 2015 (the latest data available from the U.S. government), 72,647 Central American unauthorized immigrants had applied for the DACA program, and 60,677 had been approved.
More than half of Central American immigrants (52 percent) were uninsured: a much higher share compared to both the total foreign born (32 percent) and native born (12 percent). They were also much less likely than the foreign- and U.S.-born populations to have public or private health insurance, possibly due to lack of legal status (see Figure 7). For all Central American immigrant groups, public health insurance rates were generally low (ranging from 14 percent to 22 percent). Private coverage rates were the highest for immigrants from Costa Rica (51 percent), Belize (52 percent), and Panama (63 percent), while the majority of immigrants from Guatemala (60 percent) and Honduras (62 percent) were uninsured.
Figure 7. Health Coverage for Central American Immigrants, All Immigrants, and the Native Born, 2013
![]()
Note: The sum of shares by type of insurance is likely to be greater than 100 because people may have more than one type of insurance.
Source: MPI tabulation of data from the U.S. Census Bureau, 2013 ACS.
The Central American diaspora population in the United States is comprised of approximately 5.3 million individuals who were either born in Central America or reported Central American ancestry, according to tabulations from the U.S. Census Bureau 2013 ACS.
Notes: There is no universally-recognized definition of the term "diaspora." Most often, the term includes individuals who self-identify as having ancestral ties to a specific country of origin. The Central American diaspora in the United States includes all individuals who were born in a Central American country, reported “Central American Hispanic” origin, or who selected at least one of the following responses on the two ACS questions about ancestry: “Costa Rican,” “Honduran,” “Nicaraguan,” “Panamanian,” “Salvadoran,” or “Central American.”
Remittances sent to Central America increased five-fold since 2000. Global remittances sent to Central American countries via formal channels equaled nearly USD $15 billion in 2013, representing around 7 percent of the region’s gross domestic product (GDP). However, for several countries including Guatemala (10 percent), Nicaragua (10 percent), El Salvador (16 percent), and Honduras (17 percent), remittances accounted for more than 10 percent of their GDP in 2013.
Figure 8. Annual Remittance Flows to Central America, 1974-2014
![]()
Source: MPI tabulations of data from the World Bank Prospects Group, “Annual Remittances Data,” April 2015 update.
Visit the Data Hub’s collection of interactive remittances tools, which track remittances by inflow and outflow, between countries, and over time.
Click here for an article about remittance trends in Central America.
Sources
Agunias, Dovelyn. 2006. Remittance Trends in Central America. Migration Information Source, April 1, 2006. Available Online.
Department of Homeland Security (DHS), Office of Immigration Statistics. 2014. 2013 Yearbook of Immigration Statistics. Washington, DC: DHS Office of Immigration Statistics. Available Online.
Gammage, Sarah. 2007. El Salvador: Despite End to Civil War, Emigration Continues. Migration Information Source, July 26, 2007. Available Online.
Gibson, Campbell J. and Kay Jung. 2006. Historical Census Statistics on the Foreign-born Population of the United States: 1850-2000. Working Paper No. 81, U.S. Census Bureau, Washington, DC, February 2006. Available Online.
Gzesh, Susan. 2006. Central Americans and Asylum Policy in the Reagan Era. Migration Information Source, April 1, 2006. Available Online.
Jensen, Anthony. 2012. Fleeing North: An Examination of U.S. Refugee and Asylum Policy towards Nicaragua. Thesis, College of Saint Benedict, St John’s University, Minnesota, 2012. Available Online.
Messick, Madeline and Claire Bergeron. 2014. Temporary Protected Status in the United States: A Grant of Humanitarian Relief that Is Less than Permanent. Migration Information Source, July 2, 2014. Available Online.
Reichman, Daniel. 2013. Honduras: The Perils of Remittance Dependence and Clandestine Migration. Migration Information Source, April 11, 2013. Available Online.
Rosenblum, Marc R. and Ariel G. Ruiz Soto. 2015. An Analysis of Unauthorized Immigrants in the United States by Country and Region of Birth. Washington, DC: Migration Policy Institute. Available Online.
Rosenblum, Marc R. and Kate Brick. 2011. US Immigration Policy and Mexican/Central American Migration Flows: Then and Now. Washington, DC: Migration Policy Institute. Available Online.
Seghetti, Lisa, Karma Ester, and Ruth Ellen Wasem. 2015. Temporary Protected Status: Current Immigration Policy and Issues. Washington, DC: Congressional Research Service. Available Online.
Smith, James. 2006. Guatemala: Economic Migrants Replace Political Refugees. Migration Information Source, April 1, 2006. Available Online.
U.S. Census Bureau. 2013. 2013 American Community Survey. American FactFinder. Available Online.
---. 2010. 2013 ACS. Accessed from Steven Ruggles, J. Trent Alexander, Katie Genadek, Ronald Goeken, Matthew B. Schroeder, and Matthew Sobek. Integrated Public Use Microdata Series: Version 5.0 [Machine-readable database]. Minneapolis: University of Minnesota, 2010. Available Online.
U.S. Citizenship and Immigration Services (USCIS). 2015. Number of I-821D, Consideration of Deferred Action for Childhood Arrivals by Fiscal Year, Quarter, Intake, Biometrics and Case Status: 2012-2015 (June 30). Available Online.
U.S. Customs and Border Protection (CBP). 2015. Southwest Border Unaccompanied Alien Children. Accessed August 20, 2015. Available Online.
World Bank Prospects Group. 2015. Annual Remittances Data, April 2015 update. Available Online.