

Mexican Immigrants in the United States

A vendor in San Francisco sells Mexican wrestling masks. California is home to more than one-third of Mexican immigrants in the United States. (Photo: antifluor/Flickr)
After four decades of rapid growth, the size of the Mexican immigrant population in the United States has remained stable in recent years. In 2014, more than 11.7 million Mexican immigrants resided in the United States, accounting for 28 percent of the 42.4 million foreign-born population—by far the largest immigrant origin group in the country.
Between 2006 and 2010, the number of Mexican immigrants increased by 200,000 compared to the more than 2 million who arrived in the five years prior (see Figure 1). Following this trend, in the last decade and a half, the Mexican share among all immigrants dropped from 29.5 percent in 2000 to 27.6 percent in 2014.
Mexico is also no longer the top origin country among the most recent immigrants to the United States. In 2013, China and India overtook Mexico as the most common countries of origin of immigrants who have resided in the United States for one year or less. Furthermore, more Mexican immigrants have returned to Mexico than have migrated to the United States since the end of the 2007-2009 Great Recession, according to a recent report from Pew Research Center. The decline in Mexican inflows results from a mix of factors including weakened job opportunities in the United States, tougher border enforcement, the long-term decline in Mexico’s birth rates, and the improving Mexican economy.
Figure 1. Mexican Immigrant Population in the United States, 1980-2014
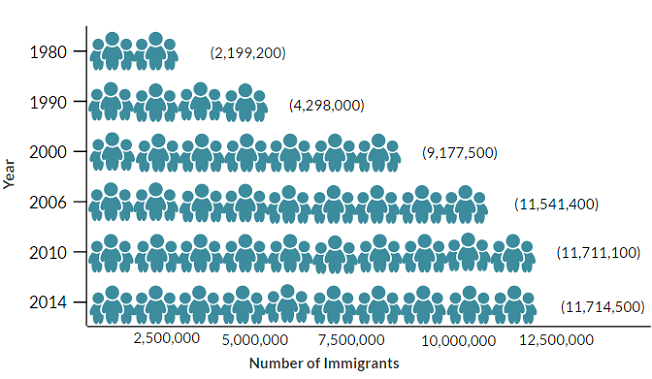
Source: Data from U.S. Census Bureau 2006, 2010, and 2014 American Community Surveys (ACS) and Campbell J. Gibson and Kay Jung, "Historical Census Statistics on the Foreign-born Population of the United States: 1850-2000" (Working Paper no. 81, U.S. Census Bureau, Washington, DC, February 2006), available online.
Click here to view an interactive chart highlighting Mexican migration trends over time.
The vast majority of Mexican emigrants settle in the United States, with others heading to Canada (94,000), Spain (47,000), and Germany (18,000), according to mid-2015 estimates by the United Nations Population Division. Click here to view an interactive map showing where migrants from Mexico and other countries have settled worldwide.
Most Mexican immigrants who obtain lawful permanent residence in the United States (also known as receiving a green card) qualify as immediate relatives of U.S. citizens or through other family-sponsored preferences. Compared to the total foreign-born population, Mexican immigrants were more likely to be Limited English Proficient (LEP), have less education and lower income, experience a higher poverty rate, and lack health insurance.
Using data from the U.S. Census Bureau (the most recent 2014 American Community Survey [ACS] as well as pooled 2010-14 ACS data), the Department of Homeland Security (DHS) Yearbook of Immigration Statistics, and the World Bank's annual remittance data, this Spotlight provides information on the Mexican immigrant population in the United States, focusing on its size, geographic distribution, and socioeconomic characteristics.
Click on the bullet points below for more information:
- Distribution by State and Key Cities
- English Proficiency
- Age, Education, and Employment
- Income and Poverty
- Immigration Pathways and Naturalization
- Health Coverage
- Diaspora
- Remittances
Distribution by State and Key Cities
Most immigrants from Mexico settled in California (37 percent), Texas (21 percent), and Illinois (6 percent). The top four counties with Mexican immigrants were Los Angeles County in California, Harris County in Texas, Cook County in Illinois, and Orange County in California. Together, these four counties accounted for about 23 percent of the total Mexican immigrant population in the United States.
Figure 2. Top Destination States for Mexican Immigrants in the United States, 2010-14
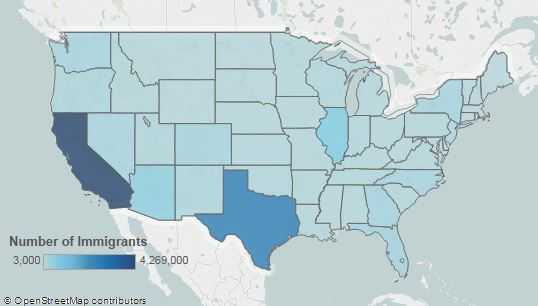
Note: Pooled 2010-14 ACS data were used to get statistically valid estimates at the state and metropolitan statistical area levels, for smaller-population geographies.
Source: Migration Policy Institute (MPI) tabulation of data from U.S. Census Bureau pooled 2010-14 ACS.
Click here for an interactive map showing the geographic distribution of immigrants by state and county. Select Mexico from the dropdown menu to see which states and counties have the highest distributions of Mexican immigrants.
In the 2010-14 period, the U.S. cities with the greatest number of Mexican immigrants were the greater Los Angeles, Chicago, Houston, and Dallas metropolitan areas. These four metropolitan areas accounted for about 31 percent of Mexican immigrants in the United States.
Figure 3. Top Destination Metropolitan Areas for Mexican Immigrants in the United States, 2010-14
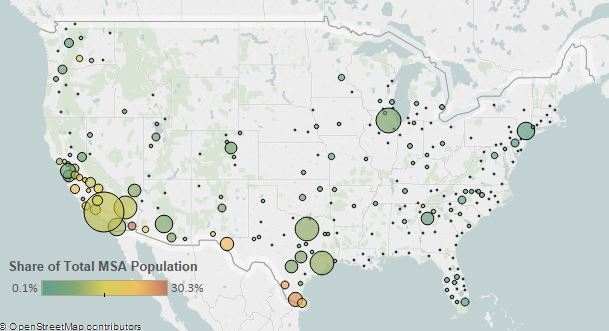
Note: Pooled 2010-14 ACS data were used to get statistically valid estimates at the state and metropolitan statistical area levels, for smaller-population geographies.
Source: MPI tabulation of data from U.S. Census Bureau pooled 2010-14 ACS.
Click here for an interactive map that highlights the metropolitan areas with the highest concentrations of immigrants. Select Mexico from the dropdown menu to see which metropolitan areas have the highest concentrations of Mexican immigrants.
Table 1. Top Concentrations by Metropolitan Area for the Foreign Born from Mexico, 2010-14
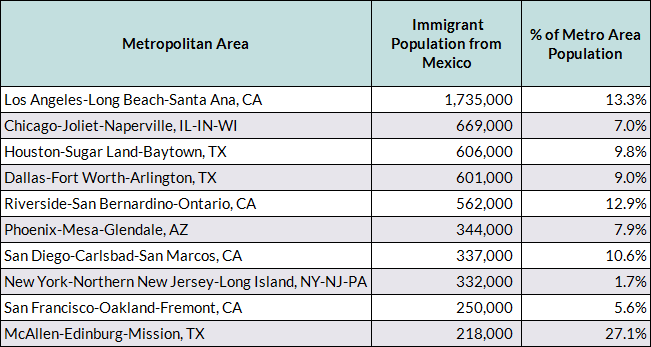
Source: MPI tabulation of data from the U.S. Census Bureau pooled 2010-14 ACS.
Mexican immigrants were less likely to be proficient in English and speak English at home than the overall foreign-born population. In 2014, about 69 percent of Mexican immigrants (ages 5 and over) reported limited English proficiency, compared to 50 percent of all immigrants. Approximately 4 percent of Mexican immigrants spoke only English at home, versus 16 percent of all immigrants.
Note: Limited English proficiency refers to those who indicated on the ACS questionnaire that they spoke English less than “very well.”
Age, Education, and Employment
The Mexican immigrant population is younger than the total foreign-born population, but older than the native-born population. The median age of Mexican immigrants was 41 years, compared to 44 for the foreign born overall and 36 for U.S. born. In 2014, 87 percent of Mexican immigrants were of working age (18 to 64), a much higher share than the 80 percent of all immigrants and 60 percent of the native born (see Table 2).
Table 2. Age distribution by Origin, 2014
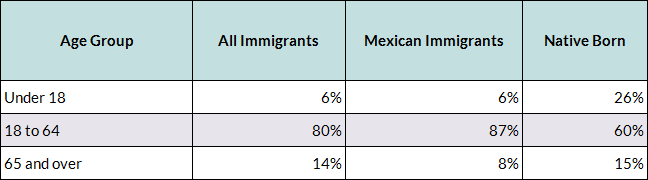
Source: MPI tabulation of data from the U.S. Census Bureau 2014 ACS.
Education
Mexican immigrants tend to have much lower educational attainment in comparison to the overall foreign- and native-born populations. In 2014, 6 percent of Mexican immigrants (ages 25 and over) had a bachelor’s degree or higher, compared to 29 percent of the total foreign-born population and 30 percent of the U.S.-born population.
Employment
Mexican immigrants participate in the labor force at a slightly higher rate than the overall immigrant and U.S.-born populations. In 2014, about 69 percent of Mexican immigrants (ages 16 and over) were in the civilian labor force, compared to 66 percent and 62 percent of all immigrants and native born, respectively. Mexican immigrants were much more likely to be employed in service occupations (31 percent); natural resources, construction, and maintenance occupations (26 percent); and production, transportation, and material-moving occupations (22 percent) than the overall foreign- and native-born populations (see Figure 4).
Figure 4. Employed Workers in the Civilian Labor Force (ages 16 and older) by Occupation and Origin, 2014
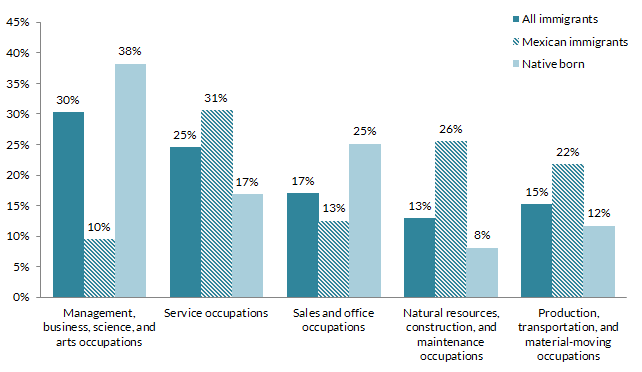
Source: MPI tabulation of data from the U.S. Census Bureau 2014 ACS.
Mexican immigrants had much lower incomes compared to the total foreign- and native-born populations. In 2014, median household income among Mexican immigrants was $37,390, compared to $49,487 and $54,565 for the immigrant and native-born populations, respectively.
Mexican immigrants were also much more likely to experience poverty than the other two groups. In 2014, 28 percent of Mexican immigrant families lived in poverty, compared to 18 percent of all immigrant families and 10 percent of native-born families.
Immigration Pathways and Naturalization
Mexican immigrants are much less likely to be naturalized U.S. citizens than the overall immigrant population, a fact mainly attributable to the presence of a large unauthorized population ineligible for U.S. citizenship. In 2014, 27 percent of the 11.7 million Mexican immigrants who resided in the United States were naturalized citizens, compared to 47 percent of the total foreign-born population.
Nearly two-thirds of Mexican immigrants arrived prior to 2000 (63 percent), 31 percent between 2000 and 2009, and 6 percent in 2010 or later. In comparison, 59 percent of all immigrants to the United States arrived prior to 2000, 29 percent between 2000 and 2009, and 12 percent in 2010 and after (see Figure 5).
Figure 5. Mexican Immigrants and All Immigrants in the United States by Period of Arrival, 2014
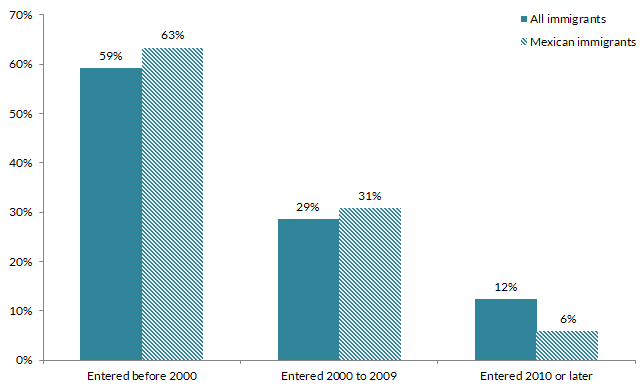
Source: MPI tabulation of data from the U.S. Census Bureau 2014 ACS.
The majority of Mexican immigrants who became lawful permanent residents (LPRs) in the United States in fiscal year (FY) 2013 did so as immediate relatives of U.S. citizens (63 percent) or held other family-sponsored preference visas (26 percent), according to the most recent DHS Yearbook of Immigration Statistics. Mexican immigrants were much less likely to gain green cards via employment pathways (6 percent) compared to the overall LPR population (16 percent).
Figure 6. Immigration Pathways of Mexican Immigrants and All Immigrants in the United States, 2013
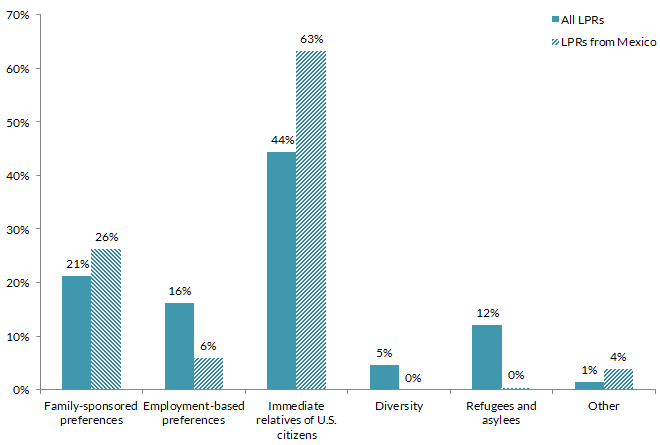
Notes: Family-sponsored: Includes adult children and siblings of U.S. citizens as well as spouses and children of green-card holders. Immediate relatives of U.S. citizens: Includes spouses, minor children, and parents of U.S. citizens. Diversity Visa Lottery: The Immigration Act of 1990 established the Diversity Visa Lottery to allow entry to immigrants from countries with low rates of immigration to the United States. The law states that 55,000 diversity visas are made available each fiscal year. Mexican nationals are not eligible for the lottery.
Source: MPI tabulation of data from Department of Homeland Security (DHS), 2013 Yearbook of Immigration Statistics (Washington, DC: DHS Office of Immigration Statistics, 2014), available online.
Mexicans represent the largest unauthorized immigrant group in the United States. As of 2013, 6.2 million (56 percent) of the estimated 11 million unauthorized immigrants in the United States were from Mexico.
Click here for an interactive map showing unauthorized immigrant populations in the United States by origin country and region and top state and county destinations, for 2009-13.
Mexico is also the largest origin country among beneficiaries of the Deferred Action for Childhood Arrivals (DACA) program, which provides temporary deportation relief and work authorization. Between the program’s start in August 15, 2012 and the end of FY 2015 on September 30, 2015, U.S. Citizenship and Immigration Services (USCIS) accepted 609,105 initial and 371,219 renewal DACA applications from unauthorized youth born in Mexico (77 percent of all initial and renewal applications combined). About 90 percent of initial applications and 92 percent of renewal applications from Mexican nationals had been approved by the end of FY 2015.
In 2014, 47 percent of Mexican immigrants were uninsured, a much higher rate than the total foreign-born population (27 percent) and the native born (9 percent). Mexican immigrants were also less likely to have public or private health insurance than the foreign- and native-born populations (see Figure 7).
Figure 7. Health Coverage for Mexican Immigrants, All Immigrants, and the Native Born, 2014
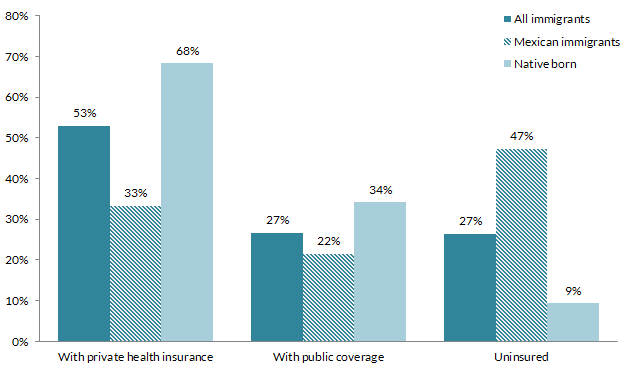
Note: The sum of shares by type of insurance is likely to be greater than 100 because people may have more than one type of insurance.
Source: MPI tabulation of data from the U.S. Census Bureau 2014 ACS.
The Mexican diaspora population in the United States is comprised of approximately 35.4 million individuals who were either born in Mexico or reported Mexican ancestry or Hispanic origin, according to tabulations from the U.S. Census Bureau pooled 2010-14 ACS.
Total global remittances sent to Mexico via formal channels amounted to $24 billion in 2014, representing about 2 percent of the country’s gross domestic product (GDP), according to data from the World Bank. Remittances received by Mexicans have steadily increased in recent years after a dramatic decline during the Great Recession.
Figure 8. Annual Remittance Flows to Mexico, 1979-2014
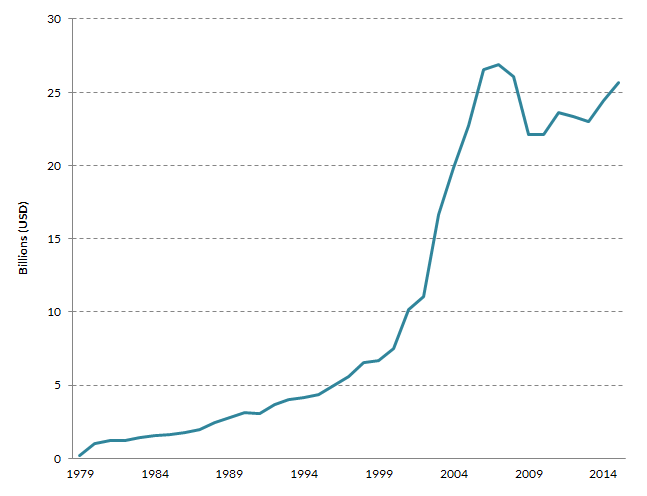
Source: MPI tabulations of data from the World Bank Prospects Group, “Annual Remittances Data,” October 2015 update.
Visit the Data Hub’s collection of interactive remittances tools, which track remittances by inflow and outflow, between countries, and over time.
Sources
Department of Homeland Security (DHS), Office of Immigration Statistics. 2014. 2013 Yearbook of Immigration Statistics. Washington, DC: DHS Office of Immigration Statistics. Available Online.
Gibson, Campbell J. and Kay Jung. 2006. Historical Census Statistics on the Foreign-born Population of the United States: 1850-2000. Working Paper No. 81, U.S. Census Bureau, Washington, DC, February 2006. Available Online.
Gonzalez-Barrera, Ana. 2015. More Mexicans Leaving Than Coming to the U.S. Washington, DC: Pew Research Center. Available Online.
Migration Policy Institute. N.d. Unauthorized Immigrant Population Profiles. Accessed March 15, 2016. Available Online.
U.S. Census Bureau. 2015. 2014 American Community Survey. American FactFinder. Available Online.
---. 2016. 2010-14 American Community Survey. Access from Steven Ruggles, Katie Genadek, Ronald Goeken, Josiah Grover, and Matthew Sobek. Integrated Public Use Microdata Series: Version 6.0 [Machine-readable database]. Minneapolis: University of Minnesota, 2016. Available Online.
U.S. Citizenship and Immigration Services. 2015. Number of I-821D, Consideration of Deferred Action for Childhood Arrivals by Fiscal Year, Quarter, Intake, Biometrics and Case Status: 2012-2015 (September 30). Available Online.
World Bank Prospects Group. 2015. Annual Remittances Data, October 2015 update. Available Online.