

Central American Immigrants in the United States

Guatemalan women attend mass at a church in Los Angeles. (Photo: Eric Chan)
Haga clic aquí para leer este artículo en español.
Over the past several years, Central American migration to the United States has been the focal point of significant media and public policy attention, as the number of unaccompanied children and families fleeing gang violence and poverty has risen dramatically. In 2015, approximately 3.4 million Central Americans resided in the United States, representing 8 percent of the 43.3 million U.S. immigrants. Eighty-five percent of Central Americans in the United States were from the Northern Triangle, formed by El Salvador, Guatemala, and Honduras.
However, large-scale Central American migration is not a new phenomenon. Civil wars, political instability, and economic hardship first drove significant numbers of Central Americans northward in the 1980s, when the population from that region living in the United States more than tripled. Despite the end of political conflicts in the early 1990s, additional migration was driven by family unification, natural disasters, and persistent political and economic volatility, with many individuals entering illegally. Following a series of natural disasters in the region, Salvadorans, Hondurans, and Nicaraguans became eligible for Temporary Protected Status (TPS), offering provisional protection against deportation and eligibility for work authorization. TPS has been renewed for Honduras and Nicaragua until January 2018, and El Salvador until March 2018.
The region continues to suffer from poor political and socioeconomic conditions, including some of the world’s highest homicide rates and widespread gang violence, which drive ongoing migration. A growing number of unaccompanied children and families from Central America have arrived at the U.S.-Mexico border since 2011, largely from the Northern Triangle. In fiscal year (FY) 2016 alone, U.S. Customs and Border Protection (CBP) intercepted nearly 46,900 unaccompanied children and more than 70,400 family units from El Salvador, Guatemala, and Honduras arriving at the U.S.-Mexico border.
From 1980 to 2015, the size of the Central American immigrant population grew nearly tenfold (see Figure 1).
Figure 1. Central American Immigrant Population in the United States, 1980-2015
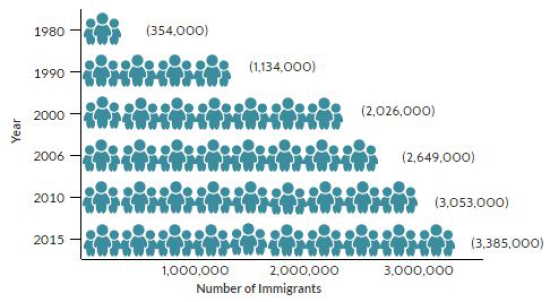
Sources: Data from U.S. Census Bureau 2006, 2010, and 2015 American Community Surveys (ACS), and Campbell J. Gibson and Kay Jung, "Historical Census Statistics on the Foreign-born Population of the United States: 1850-2000" (Working Paper no. 81, U.S. Census Bureau, Washington, DC, February 2006), available online.
Immigrants from El Salvador, Guatemala, and Honduras accounted for almost 90 percent of the total growth in the population since 1980. Other Central American groups showed more moderate increases over the past 35 years.
 Click here for an interactive chart showing changes in the number of immigrants from Central America in the United States over time. Select individual countries from the dropdown menu.
In 2015, El Salvador, Guatemala, and Honduras were the top three origin countries in Central America, followed by Nicaragua, Panama, Costa Rica, and Belize (see Table 1).
Table 1. Distribution of Central American Immigrants in the United States by Country of Origin, 2015
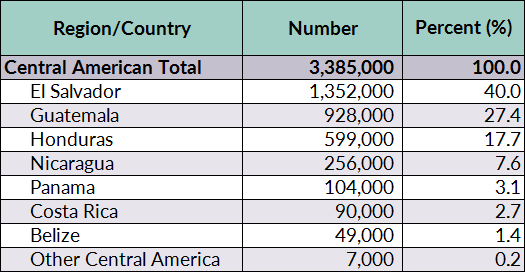
Source: Migration Policy Institute (MPI) tabulation of data from the U.S. Census Bureau, 2015 ACS.
The majority of Central Americans who have obtained lawful permanent residence in the United States (also known as receiving a green card) did so through family reunification channels. Compared to the overall foreign- and U.S.-born populations, Central Americans on average were significantly less educated, but more likely to be employed. Although Central American countries share similar cultural and linguistic backgrounds, socioeconomic characteristics vary significantly by origin country. Due to the large share of individuals from the Northern Triangle, the indicators for Central American immigrants overall are biased toward immigrants from those three countries.
Of the 4.1 million international migrants from Central America worldwide, the vast majority (78 percent) resided in the United States, according to mid-2015 estimates by the United Nations Population Division. Another 15 percent were scattered within the region, including in Mexico, while the remainder resided in Canada and Europe. However, international settlement patterns vary by country of origin. For instance, more than 80 percent of migrants from Belize, El Salvador, Guatemala, and Honduras settled in the United States, compared to just 40 percent of Nicaraguans (47 percent live in Costa Rica).
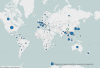 Click here to view an interactive map showing where migrants from Central America (and elsewhere) have settled worldwide.
Using data from the U.S. Census Bureau (the most recent 2015 American Community Survey [ACS] and pooled 2011-15 ACS data), the Department of Homeland Security’s Yearbook of Immigration Statistics, and the World Bank's annual remittance data, this Spotlight provides information on the Central American immigrant population in the United States, focusing on its size, geographic distribution, and socioeconomic characteristics.
Click on the bullet points below for more information:
- Distribution by State and Key Cities
- Language Diversity and English Proficiency
- Age, Education, and Employment
- Income and Poverty
- Immigration Pathways and Naturalization
- Unauthorized Immigrants
- Health Coverage
- Diaspora
- Remittances
Distribution by State and Key Cities
Almost half of immigrants from Central America have settled in three states: California (27 percent), Texas (12 percent), and Florida (11 percent). In the 2011-15 period, the top four counties with Central American immigrants were Los Angeles County in California, Harris County in Texas, Miami-Dade County in Florida, and Prince George’s County in Maryland. These four counties together accounted for about 30 percent of the total Central American immigrant population in the United States.
Figure 2. Top Destination States for Central American Immigrants in the United States, 2011-15
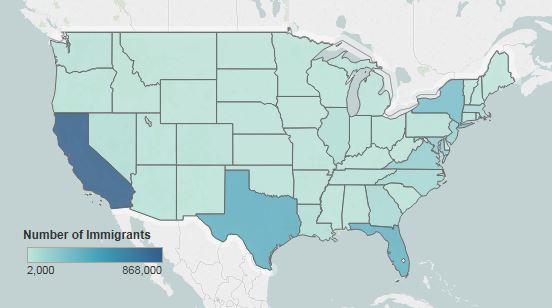
Note: Pooled 2011-15 ACS data were used to get statistically valid estimates at the state level for smaller-population geographies. Not shown are populations in Alaska and Hawaii, which are small in size; for details, visit the Migration Policy Institute (MPI) Data Hub for an interactive map showing geographic distribution of immigrants by state and county, available online.
Source: MPI tabulation of data from the U.S. Census Bureau pooled 2011-15 ACS.
 Click here for an interactive map that shows the geographic distribution of immigrants by state and county. Select individual Central American countries from the dropdown menu to see which states and counties have the most Central American immigrants.
The U.S. cities with the most Central Americans in the 2011-15 period were the greater Los Angeles, New York City, Washington, DC, Miami, and Houston metropolitan areas (see Figure 3). These five metropolitan areas accounted for 52 percent of Central Americans in the United States.
Figure 3. Top Metropolitan Destinations for Central American Immigrants in the United States, 2011-15
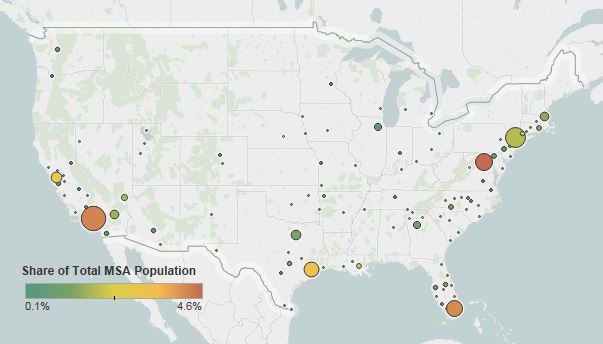
Note: Pooled 2011-15 ACS data were used to get statistically valid estimates at the metropolitan statistical-area level for smaller-population geographies.
Source: MPI tabulation of data from the U.S. Census Bureau pooled 2011-15 ACS.
 Click here for an interactive map that highlights the metropolitan areas with the highest concentrations of immigrants. Select individual Central American countries from the dropdown menu to see which metropolitan areas have the most immigrants.
Table 2. Top Concentrations by Metropolitan Area for the Foreign Born from Central America, 2011-15
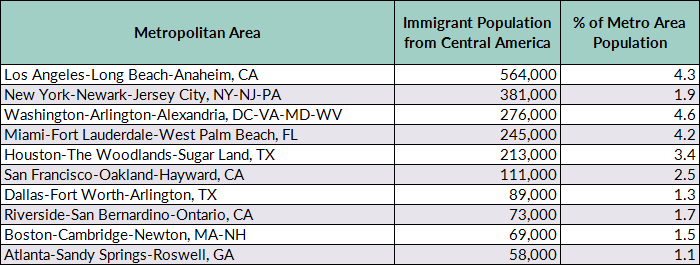
Source: MPI tabulation of data from the U.S. Census Bureau pooled 2011-15 ACS.
Language Diversity and English Proficiency
Central American immigrants were much less likely to be proficient in English or to speak English at home than the overall U.S. foreign-born population. In 2015, approximately 67 percent of Central Americans (ages 5 and over) reported limited English proficiency (LEP), compared to 49 percent of the total immigrant population. English proficiency varied significantly by country of origin: Five percent of immigrants from Belize and 27 percent of those from Panama were LEP, versus around 70 percent of immigrants from El Salvador, Honduras, and Guatemala. Approximately 6 percent of all Central Americans spoke only English at home, versus 16 percent of all immigrants.
Note: Limited English proficiency refers to persons who indicated on the ACS questionnaire that they spoke English less than “very well.”
Age, Education, and Employment
In 2015, the Central American immigrant population was younger than the overall foreign-born population but older than the U.S. born. The median age of Central American immigrants was 39 years—compared to 44 for the foreign-born population and 36 for the native born. A higher share of Central American immigrants were of working age (18 to 64) in 2015, compared to both the total foreign- and U.S.-born populations (see Figure 4). Notably, Panamanians had the highest share of immigrants ages 65 and older, with approximately 27 percent.
Figure 4. Age Distribution by Origin, 2015
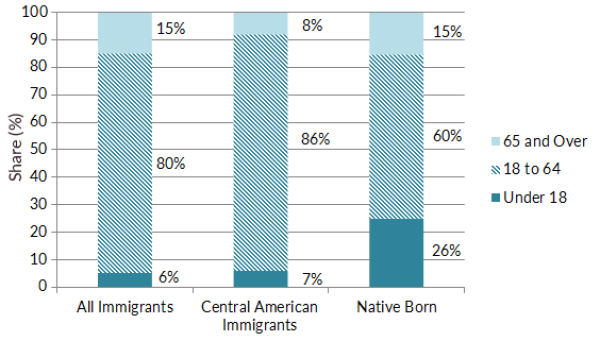
Source: MPI tabulation of data from the U.S. Census Bureau, 2015 ACS. Numbers may not add up to 100 as they are rounded to the nearest whole number.
 Click here to view an interactive chart showing the age and sex distribution of the top immigrant-origin groups, including those from El Salvador.
Central American immigrants tend to have significantly lower educational attainment compared to the overall foreign- and native-born adult populations. In 2015, 49 percent of Central American immigrants ages 25 and over had not finished high school, compared to 29 percent of all immigrants and 9 percent of U.S.-born adults. Less than 10 percent of Central American adults had a bachelor’s degree or higher, compared to 29 percent and 31 percent respectively for overall immigrant and native-born adult populations. Immigrants from Panama (27 percent), Costa Rica (24 percent), and Belize (21 percent) were significantly more likely to be college graduates, compared to those from Honduras (9 percent), El Salvador (7 percent), and Guatemala (6 percent).
In 2015, Central American immigrants participated in the labor force at a higher rate than the overall immigrant and U.S.-born populations. Seventy-three percent of Central Americans ages 16 and over were in the civilian labor force, compared to 66 percent and 62 percent of all foreign and native born, respectively.
Central American immigrants were considerably more likely to be employed in service occupations (33 percent); natural resources, construction, and maintenance occupations (23 percent); and production, transportation, and material-moving occupations (19 percent) than both the overall foreign- and native-born populations (see Figure 5).
Figure 5. Employed Workers in the Civilian Labor Force (ages 16 and Older) by Occupation and Origin, 2015
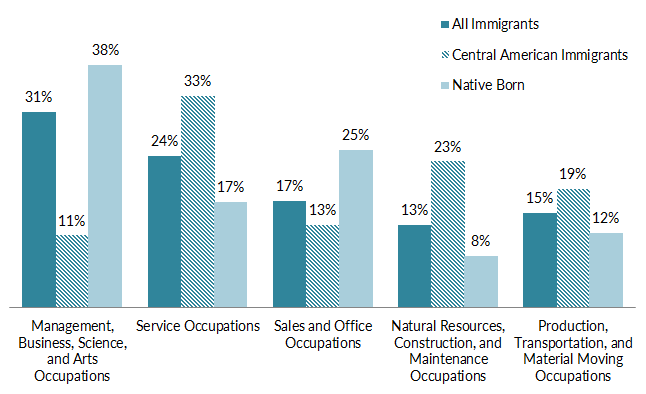
Source: MPI tabulation of data from the U.S. Census Bureau 2015 ACS.
In contrast, close to one-third of employed immigrants from Panama and Costa Rica worked in management, business, science, and arts occupations, compared to 10 percent or fewer of their peers from Honduras, El Salvador, and Guatemala.
Central Americans had considerably lower incomes and higher poverty rates than the overall foreign- and U.S.-born populations. In 2015, the median income of households headed by a Central American immigrant was $42,000, compared to $51,000 and $56,000 for overall foreign- and native-born households, respectively. All Central American origin groups had lower median household income than the total foreign-born population.
In 2015, 22 percent of Central American immigrant families lived in poverty, a higher share than for all immigrant (16 percent) and native-born families (9 percent). The poverty rate was highest for immigrant families from Honduras and Guatemala (approximately 28 percent each), followed by those from El Salvador (19 percent). In contrast, between 12 percent and 13 percent of immigrant families from Costa Rica, Panama, and Nicaragua were in poverty.
Immigration Pathways and Naturalization
Central American immigrants were less likely than the overall foreign-born population to be naturalized citizens, partly due to the large presence of TPS beneficiaries and unauthorized individuals ineligible for U.S. citizenship. In 2015, just 33 percent of the 3.4 million Central Americans residing in the United States were naturalized U.S. citizens, compared to 48 percent of all immigrants. Approximately 70 percent of Panamanians and roughly half of Costa Ricans and Nicaraguans were naturalized citizens, compared to much lower shares of Hondurans (23 percent), Guatemalans (27 percent), and Salvadorans (32 percent).
Central Americans have generally mirrored the arrival patterns of the overall immigrant population with some small variations. They were more likely than other origin groups to have entered the United States between 2000 and 2009, and less likely to have arrived since 2010 (see Figure 5). Approximately 52 percent of Central American immigrants arrived prior to 2000, followed by 34 percent who arrived between 2000 and 2009, and 15 percent in 2010 or later. The majority of Panamanians (78 percent), Nicaraguans (71 percent), Costa Ricans (60 percent), and Salvadorans (56 percent) entered before 2000, while less than half of Guatemalans (44 percent) and Hondurans (41 percent) entered during that period.
Figure 6. Central American and All Immigrants in the United States by Period of Arrival, 2015
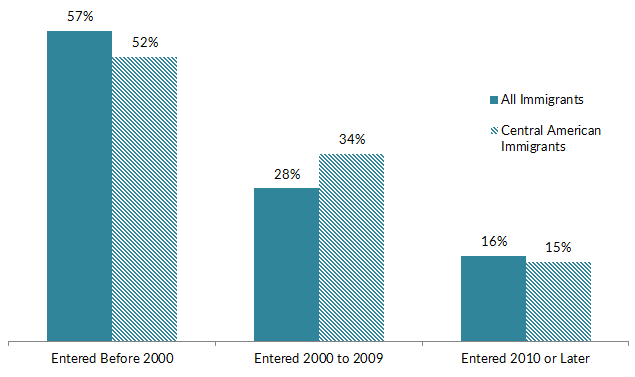
Source: MPI tabulation of data from the U.S. Census Bureau, 2015 ACS. Numbers may not add up to 100 as they are rounded to the nearest whole number.
The majority (79 percent) of Central American immigrants who became lawful permanent residents (LPRs) in FY 2015 did so through family-based channels. More than half (52 percent) of new Central American LPRs were immediate relatives of U.S. citizens, followed by those who qualified via other family-sponsored preferences (27 percent). Central Americans were much less likely to become LPRs via employment-based preferences (9 percent) or as refugees and asylees (3 percent) than the overall LPR population (see Figure 7).
Figure 7. Immigration Pathways of Central American and All Legal Permanent Residents in the United States, 2015
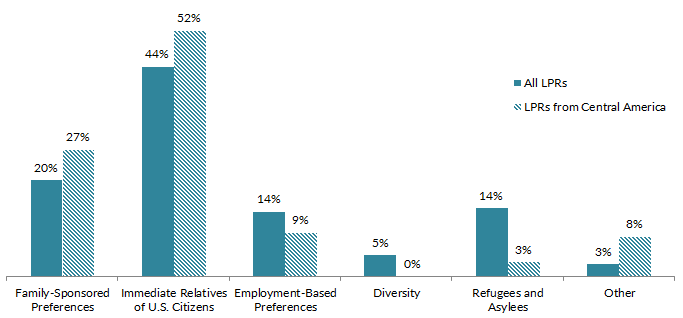
Notes: Family-sponsored: Includes adult children and siblings of U.S. citizens as well as spouses and children of green-card holders. Immediate relatives of U.S. citizens: Includes spouses, minor children, and parents of U.S. citizens. Diversity Visa Lottery: The Immigration Act of 1990 established the Diversity Visa Lottery to allow entry to immigrants from countries with low rates of immigration to the United States. The law states that 55,000 diversity visas in total are made available each fiscal year. All Central American countries are eligible for the diversity visa except El Salvador.
Source: MPI tabulation of data from Department of Homeland Security (DHS), 2015 Yearbook of Immigration Statistics (Washington, DC: DHS Office of Immigration Statistics, 2016), available online.
Although petitioning based on family connections was the primary pathway for all Central American groups in FY 2015, patterns of legal immigration channels varied by country of origin. For instance, 13 percent of Hondurans became LPRs via employment-based preferences, 6 percent of Guatemalans as asylees, and 8 percent of Salvadorans under other specific legislation.
As of 2015, about 204,000 Salvadorans, 61,000 Hondurans, and 2,800 Nicaraguans benefitted from TPS based on data from U.S. Citizenship and Immigration Services (USCIS).
Click here to read an article on TPS in the United States.
In the 2010-14 period, approximately 1.7 million Central American unauthorized immigrants resided in the United States, according to Migration Policy Institute (MPI) estimates, representing 15 percent of the 11 million total unauthorized population. Guatemala (723,000), El Salvador (465,000), and Honduras (337,000) were among the top five origin countries of unauthorized immigrants, between Mexico (about 6.2 million) and China (268,000).
In 2016, approximately 124,000 youth from Guatemala, El Salvador, and Honduras were immediately eligible for work authorization and relief from deportation through the Deferred Action for Childhood Arrivals (DACA) program. Unauthorized immigrants from the three Northern Triangle countries were among the top five origin groups for DACA eligibility. As of December 31, 2016 (the latest data available from the U.S. government), nearly 79,000 unauthorized youth from these countries had applied for the DACA program, and nearly 65,000 had been approved.
Note: Published USCIS data on DACA applications and approvals are available for the top 25 origin countries of applicants. Only Costa Rica, El Salvador, Guatemala, Honduras, and Nicaragua are on this list from Central America.
About 40 percent of Central American immigrants were uninsured in 2015, a much higher share than the overall foreign born (22 percent) and U.S. born (7 percent).
However, there is a significant variance in health insurance coverage by country of origin. Uninsured rates were lower among immigrants from Panama (11 percent), Costa Rica (24 percent) and Nicaragua (25 percent) compared to those from Guatemala (50 percent) and Honduras (52 percent). Central Americans were much less likely than the overall foreign- and U.S.-born populations to have public or private health insurance, possibly due to lack of legal status (see Figure 8).
For all Central American origin groups, public health insurance rates were generally low (ranging from 19 percent to 38 percent). Private coverage rates were the highest for Panamanians (66 percent), Costa Ricans (53 percent), and Nicaraguans (52 percent).
Figure 8. Health Coverage for the U.S. Population, by Nativity, 2015
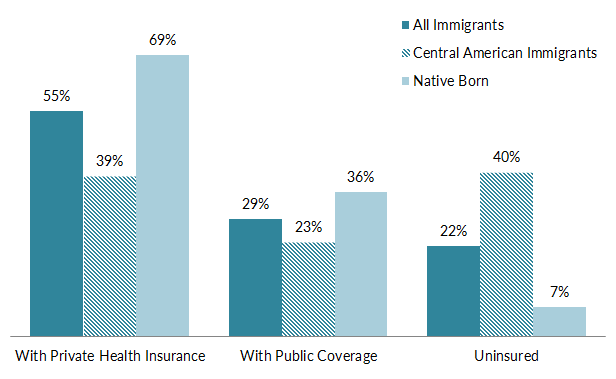
Note: The sum of shares by type of insurance is likely to be greater than 100 because people may have more than one type of insurance.
Source: MPI tabulation of data from the U.S. Census Bureau, 2015 ACS.
The Central American diaspora in the United States is comprised of approximately 6.2 million individuals who were either born in Central America or reported Central American ancestry, according to tabulations from the U.S. Census Bureau 2015 ACS.
Notes: There is no universally-recognized definition of the term "diaspora." Most often, the term includes individuals who self-identify as having ancestral ties to a specific country of origin. The Central American diaspora in the United States includes all individuals who were born in a Central American country, reported any “Central American Hispanic” origin, or who selected at least one of the following responses on the two ACS questions about ancestry: “Costa Rican,” “Guatemalan,” “Honduran,” “Nicaraguan,” “Panamanian,” “Salvadoran,” or “Central American.”
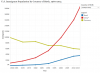
Global remittances sent to Central America via formal channels increased more than five-fold since 2000, reaching almost $17 billion in 2015, according to World Bank data. The United States was by far the top source of remittances to the region, sending more than $15 billion in total.
Figure 9. Annual Remittance Flows to Central America, 1980-2016*
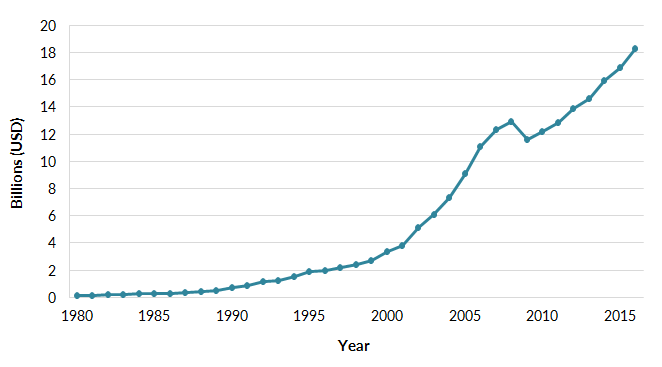
* The 2016 figures represent World Bank estimates.
Source: MPI tabulations of data from the World Bank Prospects Group, “Annual Remittances Data,” updated October 2016.
Remittances sent in 2015 represented approximately 7 percent of the region’s gross domestic product (GDP). However, they accounted for a much higher GDP share for the Northern Triangle countries of Honduras (18 percent), El Salvador (17 percent), and Guatemala (10 percent), compared to Costa Rica and Panama (about 1 percent each).
Visit the Data Hub’s collection of interactive remittances tools, which track remittances by inflow and outflow, between countries, and over time.
Sources
Department of Homeland Security (DHS), Office of Immigration Statistics. 2016. 2015 Yearbook of Immigration Statistics. Washington, DC: DHS Office of Immigration Statistics. Available online.
Gammage, Sarah. 2007. El Salvador: Despite End to Civil War, Emigration Continues. Migration Information Source, July 26, 2007. Available online.
Gibson, Campbell J. and Kay Jung. 2006. Historical Census Statistics on the Foreign-born Population of the United States: 1850-2000. Working Paper No. 81, U.S. Census Bureau, Washington, DC, February 2006. Available online.
Gzesh, Susan. 2006. Central Americans and Asylum Policy in the Reagan Era. Migration Information Source, April 1, 2006. Available online.
Jensen, Anthony. 2012. Fleeing North: An Examination of U.S. Refugee and Asylum Policy towards Nicaragua. Thesis, College of Saint Benedict, St John’s University, Minnesota, 2012. Available online.
Messick, Madeline and Claire Bergeron. 2014. Temporary Protected Status in the United States: A Grant of Humanitarian Relief that Is Less than Permanent. Migration Information Source, July 2, 2014. Available online.
Reichman, Daniel. 2013. Honduras: The Perils of Remittance Dependence and Clandestine Migration. Migration Information Source, April 11, 2013. Available online.
Rosenblum, Marc R. and Ariel G. Ruiz Soto. 2015. An Analysis of Unauthorized Immigrants in the United States by Country and Region of Birth. Washington, DC: Migration Policy Institute. Available online.
Rosenblum, Marc R. and Kate Brick. 2011. U.S. Immigration Policy and Mexican/Central American Migration Flows: Then and Now. Washington, DC: Migration Policy Institute. Available online.
Seghetti, Lisa, Karma Ester, and Ruth Ellen Wasem. 2015. Temporary Protected Status: Current Immigration Policy and Issues. Washington, DC: Congressional Research Service. Available online.
Smith, James. 2006. Guatemala: Economic Migrants Replace Political Refugees. Migration Information Source, April 1, 2006. Available online.
Steven Ruggles, Katie Genadek, Ronald Goeken, Josiah Grover, and Matthew Sobek. 2015. Integrated Public Use Microdata Series: Version 6.0 [dataset]. Minneapolis: University of Minnesota, 2015. Available online.
U.S. Census Bureau. 2016. 2015 American Community Survey. American FactFinder. Available online.
U.S. Citizenship and Immigration Services (USCIS). 2017. Number of I-821D, Consideration of Deferred Action for Childhood Arrivals by Fiscal Year, Quarter, Intake, Biometrics and Case Status: 2012-2017 (December 31). Available online.
---. 2017. Temporary Protected Status. Accessed March 31, 2017. Available online.
U.S. Customs and Border Protection (CBP). 2016. Southwest Border Unaccompanied Alien Children. Accessed March 30, 2017. Available online.
World Bank Prospects Group. 2016. Annual Remittances Data, October 2016 update. Available online.