
It’s Relative: A Crosscountry Comparison of Family-Migration Policies and Flows

Policymakers in a number of countries have been revisiting issues related to family-based migration, including how national laws balance family unity and other immigration priorities. Germany and Sweden, for example, introduced restrictions on the family-reunification rights of some newly arrived asylum seekers at the height of the 2015–16 European migration crisis. And in the United States, the Trump administration has raised questions about the value of family-sponsored immigration and its central place within the U.S. immigration system.
With President Trump and some Republicans in Congress signaling a desire to cut some family-based categories and move towards what they refer to as the “merit-based” system used in Canada, this issue brief offers a comparative look at family-migration trends and policies in nine countries: Australia, Canada, France, Germany, Italy, the Netherlands, Sweden, the United Kingdom, and the United States.
Modeling Potential U.S. Legal Immigration Cuts
This interactive tool shows how potential changes to U.S. legal immigration policy would affect top sending countries. Users can see which countries would experience the largest immigration cuts, in number and share, under different proposals to eliminate current permanent immigration categories such as the diversity visa or individual family-sponsored preferences.
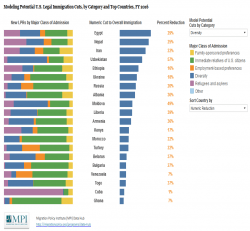
Among the top findings:
- While immigrants admitted through economic streams receive the largest share of permanent-residence grants in Canada and the United Kingdom, the dependent family members of economic migrants account for about half of these grants. When dependents admitted through economic, humanitarian, and other non-family streams are reclassified as family migrants, family admissions comprise 57 percent of permanent-residence grants in the United Kingdom, 66 percent in Canada, and 81 percent in the United States.
- When population size is taken into account, Australia, Canada, and the United States admit family migrants at similar rates (2.6, 2.0, and 2.1 admissions per 1,000 people annually, respectively). However, the United States admits far fewer economic migrants each year (0.5 admissions per 1,000 people compared to 5.5 admissions for Australia and 4.5 admissions for Canada).
- Backlogs and long wait times are common, and in some cases may make family reunification nearly impossible. For example, the European migration crisis has strained the capacity of many national migration agencies to process cases, and some spouses of Swedish citizens now face a wait of up to two years. Meanwhile, high demand for numerically limited visas has seen the wait time in Australia for certain parent visas reach 30 years, and in the United States, the wait for Filipino and Mexican siblings of U.S. citizens is more than 20 years.
I. Introduction
II. Which Family Members Qualify, and What Rights Do They Have?
A. Who Can Sponsor a Family Migrant?
B. Which Family Members Are Eligible?
C. What Status Does the Family Member Receive?
III. Assessing the Scale of Family Migration in Different Countries
A. How Large Are Family-Migration Flows?
B. Which Family Members Migrate?
C. Who Sponsors Family Migration?
IV. Waiting Times and Numerical Caps
V. Conclusions
