

Dominican Immigrants in the United States

A bakery in Washington Heights, New York City reflects the large population of Dominican immigrants in the neighborhood. (Photo: Brian Godfrey)
Migration from the Dominican Republic to the United States largely began after rebel forces killed Dominican dictator Rafael Trujillo in 1961. Economic and political instability during the transition period and subsequent U.S. intervention accelerated the departure of Dominicans in the 1960s and the decades that followed. In 2016, nearly 1.1 million Dominican immigrants lived in the United States, representing 2.5 percent of the nation’s roughly 44 million foreign-born population.
The first wave of Dominican migration was composed of relatively well-off individuals, as well as people from urban and small-town middle and lower-middle classes. Dominicans who arrived during the Latin American debt crisis of the 1980s, known as the “lost decade,” consisted of both the very poor and members of the professional class. Historically, immigration from the Dominican Republic has been dominated by women. Since 1980, more than half of all Dominican immigrants residing in the United States have been female.
The Dominican population in the United States, which stood at 12,000 in 1960, reached 169,000 by 1980 and then doubled by 1990 and more than doubled again by 2010 (see Figure 1).
Figure 1. Dominican Immigrant Population in the United States, 1980–2016
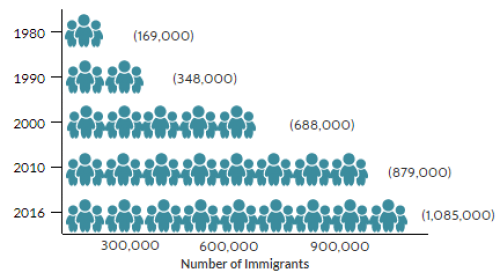
Sources: Data from U.S. Census Bureau 2010 and 2016 American Community Surveys (ACS), and Campbell J. Gibson and Kay Jung, "Historical Census Statistics on the Foreign-born Population of the United States: 1850-2000" (Working Paper no. 81, U.S. Census Bureau, Washington, DC, February 2006), available online. Click here to view an interactive chart showing trends in the size of U.S. immigrant populations by country of birth, from 1960 to the present.
Today, Dominican immigrants and their descendants comprise the fifth-largest Hispanic group in the United States (1.9 million people of Dominican origin or ancestry identify as Hispanic, representing roughly 3 percent of the 57 million U.S. residents who do so), following Mexicans, Puerto Ricans, Cubans, and Salvadorans.
The United States is home to by far the largest number of Dominicans abroad. Other popular destinations include Spain (158,000) and Italy (43,000), according to mid-2017 United Nations Population Division estimates.
Click here to view an interactive map showing where migrants from the Dominican Republic and other countries have settled worldwide.
Nearly all immigrants from the Dominican Republic who obtain lawful permanent residence in the United States (also known as getting a green card) do so through family reunification, while very few come through employment or other channels. Dominican immigrants are more likely than the overall foreign-born population in the United States to live in poverty and be Limited English Proficient (LEP) and are less likely to have a college degree and to be uninsured. Compared to the total immigrant population, a greater share of Dominicans are naturalized U.S. citizens.
Using data from the U.S. Census Bureau (the most recent 2016 American Community Survey [ACS] as well as pooled 2012–16 ACS data) and the Department of Homeland Security’s Yearbook of Immigration Statistics, this Spotlight provides information on the Dominican population in the United States, focusing on its size, geographic distribution, and socioeconomic characteristics.
Click on the bullet points below for more information:
- Distribution by State and Key Cities
- English Proficiency
- Age, Education, and Employment
- Income and Poverty
- Immigration Pathways and Naturalization
- Health Coverage
- Diaspora
- Remittances
Distribution by State and Key Cities
In the 2012–16 period, immigrants from the Dominican Republic were highly concentrated in New York (48 percent), followed distantly by New Jersey (15 percent) and Florida (11 percent). The top four counties by Dominican population were all in New York: Bronx County, New York County (Manhattan), Kings County, and Queens County. Together these counties were home to 41 percent of Dominicans in the United States.
Figure 2. Top States of Residence for Dominicans in the United States, 2012–16
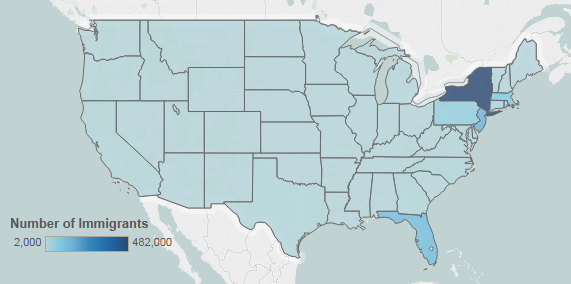
Note: Pooled 2012–16 ACS data were used to get statistically valid estimates at the state level for smaller-population geographies. Not shown is the population in Alaska, which is small in size; for details, visit the Migration Policy Institute (MPI) Data Hub to view an interactive map showing geographic distribution of immigrants by state and county, available online.
Source: MPI tabulation of data from U.S. Census Bureau pooled 2012–16 ACS.
As of 2012–16, the U.S. cities with the largest number of Dominicans were the greater New York (60 percent), Boston (7 percent), and Miami (6 percent) metropolitan areas. Almost three-quarters of all Dominican immigrants resided in these metro areas.
Figure 3. Top Metropolitan Areas of Residence for Dominicans in the United States, 2012–16
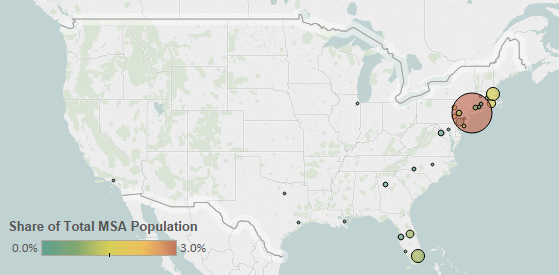
Note: Pooled 2012–16 ACS data were used to get statistically valid estimates at the metropolitan statistical-area level for smaller-population geographies.
Source: MPI tabulation of data from U.S. Census Bureau pooled 2012–16 ACS.
Table 1. Top Concentrations of Dominicans by Metropolitan Area, 2012–16
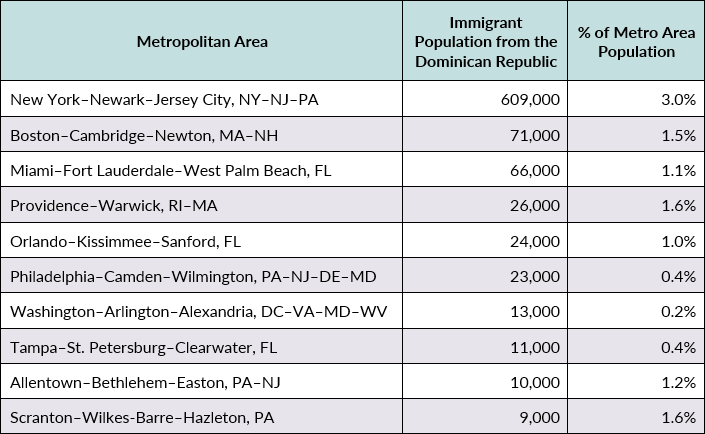
Source: MPI tabulation of data from the U.S. Census Bureau pooled 2012–16 ACS.
Click here for an interactive map that highlights the metropolitan areas with the highest concentrations of immigrants from the Dominican Republic and other countries.
Dominican immigrants are less likely to be proficient in English than the overall foreign-born population. In 2016, about 64 percent of Dominicans ages 5 and over reported limited English proficiency, compared to 49 percent of all immigrants. Approximately 4 percent of Dominicans spoke only English at home, versus 16 percent of the overall foreign born.
Note: Limited English Proficient (LEP) refers to those who indicated on the ACS questionnaire that they spoke English less than “very well.”
Age, Education, and Employment
In 2016, Dominicans were roughly the same age as the overall foreign-born population and were older than the native population. The Dominican median age was 44 years, equal to that of all immigrants, compared to 36 years for the U.S. born. Meanwhile, Dominicans were more likely than the U.S. born but as likely as the overall foreign born to be of working age (18 to 64; see Figure 4).
Figure 4. Age Distribution of the U.S. Population by Origin, 2016
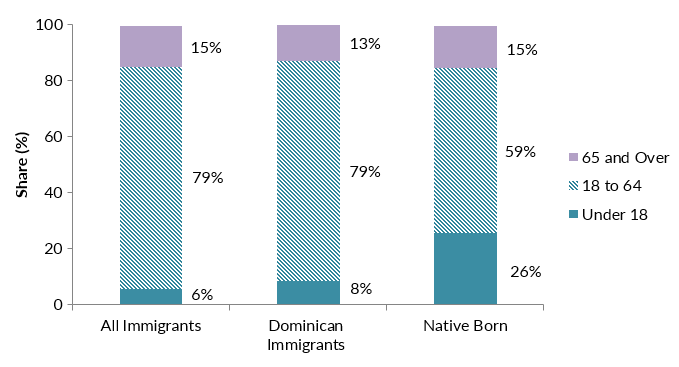
Note: Numbers may not add up to 100 as they are rounded to the nearest whole number.
Source: MPI tabulation of data from the U.S. Census Bureau 2016 ACS. Click here to view an interactive chart showing the age and sex distribution of the top immigrant groups, including Dominicans.
Dominicans ages 25 and over have much lower educational attainment compared to both the native- and overall foreign-born populations. In 2016, approximately 15 percent of Dominican immigrants had a bachelor's degree or higher, compared to about 32 percent of the U.S. born and 30 percent of all immigrants. About 35 percent of Dominican adults lacked a high school diploma, compared to 29 percent of all immigrant adults.
Dominicans participate in the labor force at a similar rate as the foreign born overall. In 2016, about 66 percent of Dominicans ages 16 and over were in the civilian labor force, a rate equivalent to that of all immigrants, compared to 62 percent of the native born. Further, Dominicans were more likely to be employed in service occupations or production, transportation, and material moving occupations than both groups (see Figure 5).
Figure 5. Employed Workers in the Civilian Labor Force (ages 16 and older) by Occupation and Origin, 2016
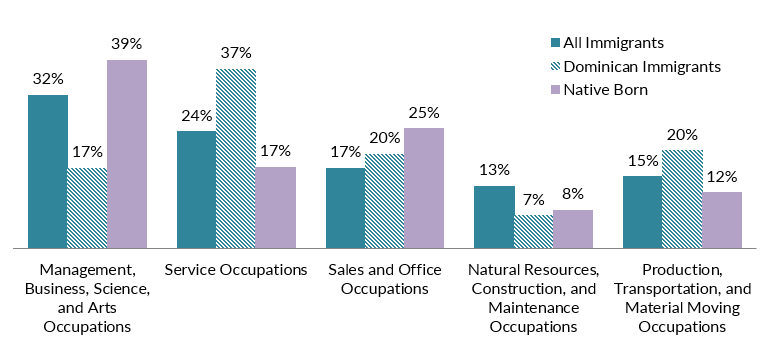
Source: MPI tabulation of data from the U.S. Census Bureau 2016 ACS.
Dominicans overall have significantly lower incomes compared to the total foreign- and native-born populations. In 2016, households headed by a Dominican immigrant had a median income of $37,000, compared to $54,000 and $58,000 for all immigrant and U.S.-born households, respectively.
Further, in 2016, some 24 percent of Dominican families were living in poverty, a much higher rate than the 9 percent for the U.S. born and 15 percent for immigrant families overall.
Immigration Pathways and Naturalization
Dominicans are slightly more likely to be naturalized U.S. citizens than immigrants overall. In 2016, 53 percent of Dominicans were naturalized citizens, compared to 49 percent of the total foreign-born population.
Compared to immigrants overall, Dominicans are slightly more likely to have arrived in 2010 or later. The largest share of Dominicans, approximately 52 percent, arrived prior to 2000, followed by 25 percent who arrived between 2000 and 2009, and 23 percent in 2010 or later (see Figure 6).
Figure 6. Dominicans and All Immigrants in the United States by Period of Arrival, 2016
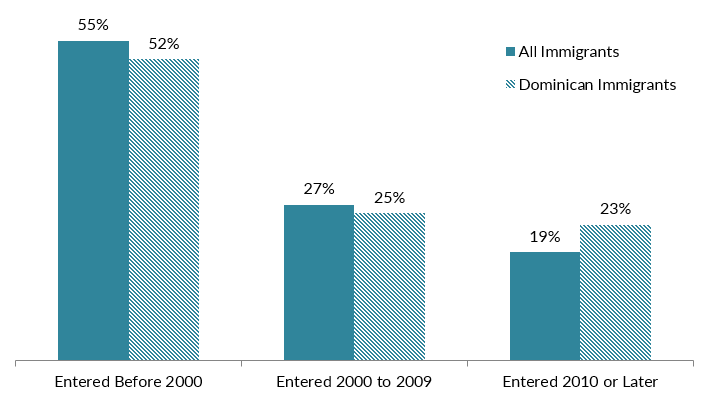
Note: Numbers may not add up to 100 as they are rounded to the nearest whole number.
Source: MPI tabulation of data from the U.S. Census Bureau 2016 ACS.
Most Dominicans who obtain green cards do so through family reunification channels. In fiscal year (FY) 2016, 99 percent of the roughly 61,200 Dominicans who became lawful permanent residents (LPRs) did so as either immediate relatives of U.S. citizens or other family members, a much higher share than the 68 percent of all new LPRs (see Figure 7).
Figure 7. Immigration Pathways of Dominican Immigrants and All Immigrants in the United States, 2016
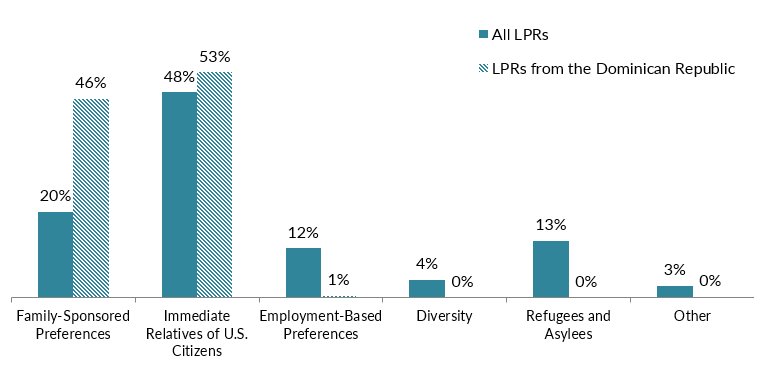
Notes: Family-sponsored: Includes adult children and siblings of U.S. citizens as well as spouses and children of green-card holders. Immediate relatives of U.S. citizens: Includes spouses, minor children, and parents of U.S. citizens. Diversity Visa lottery: The Immigration Act of 1990 established the Diversity Visa lottery program to allow entry to immigrants from countries with low rates of immigration to the United States. The law states that 55,000 diversity visas in total are made available each fiscal year. Individuals born in the Dominican Republic are not eligible for the lottery.
Source: MPI tabulation of data from Department of Homeland Security (DHS), 2016 Yearbook of Immigration Statistics (Washington, DC: DHS Office of Immigration Statistics, 2017), available online.
Although most Dominican immigrants in the United States are legally present, approximately 112,000 Dominicans were unauthorized in the 2010–14 period, according to Migration Policy Institute (MPI) estimates, comprising approximately 1 percent of the 11 million unauthorized population.
MPI also estimated that, in 2017, approximately 9,000 unauthorized Dominicans were immediately eligible for the 2012 Deferred Action for Childhood Arrivals (DACA) program. However, as of January 31, 2018, just under 2,300 Dominicans were active participants of the program, according to U.S. Citizenship and Immigration Services (USCIS) data. Overall, about 683,000 unauthorized youth are participating in the DACA program.
Dominicans are more likely to be covered by public health insurance and less likely to have private coverage compared to the foreign- and U.S.-born populations. In 2016, 14 percent of Dominicans were uninsured, versus 7 percent of the native born and 20 percent of all foreign born (see Figure 8).
Figure 8. Health Coverage for Dominicans, All Immigrants, and the Native Born, 2016
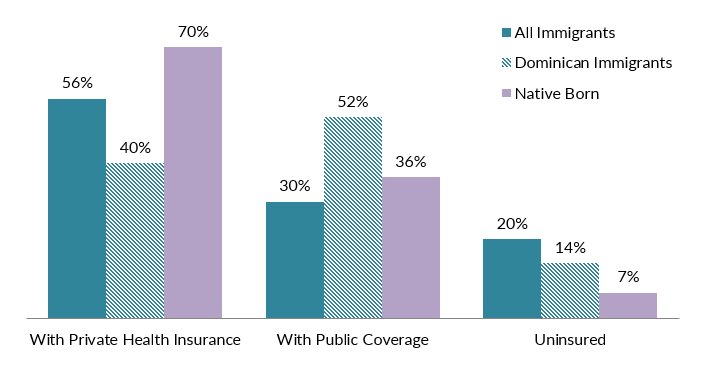
Note: The sum of shares by type of insurance is likely to be greater than 100 because people may have more than one type of insurance.
Source: MPI tabulation of data from the U.S. Census Bureau 2016 ACS.
The Dominican diaspora in the United States is comprised of about 2.2 million individuals who were either born in the Dominican Republic or reported Dominican ethnicity or ancestry, according to tabulations from the U.S. Census Bureau 2016 ACS.
In 2017, Dominicans living abroad sent nearly $6 billion in remittances to the Dominican Republic via formal channels, according to World Bank data. Remittances almost doubled in the past decade and represented about 8 percent of the country’ gross domestic product (GDP) in 2016.
Figure 9. Annual Remittance Flows to the Dominican Republic, 1970–2017
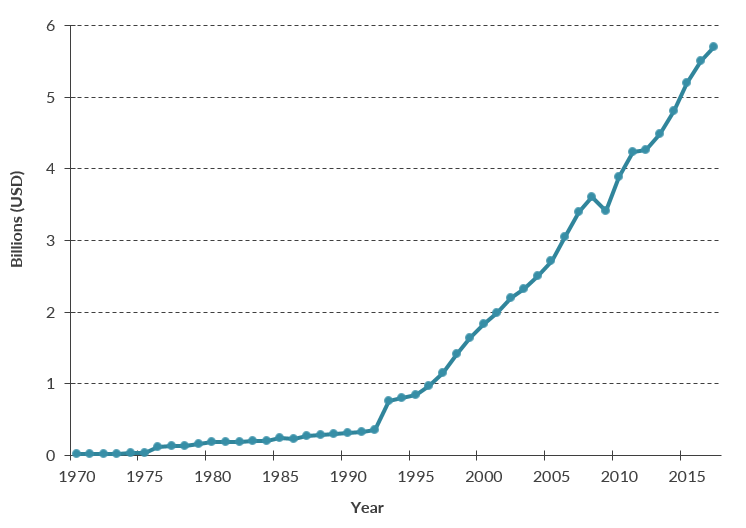
Note: The 2017 figure represents World Bank estimates.
Source: MPI tabulations of data from the World Bank Prospects Group, “Annual Remittances Data,” October 2017 update.
Sources
Gibson, Campbell J. and Kay Jung. 2006. Historical Census Statistics on the Foreign-born Population of the United States: 1850-2000. Working Paper no. 81, U.S. Census Bureau, Washington, DC, February 2006. Available online.
Hoffnung-Garskof, Jesse. 2008. A Tale of Two Cities: Santo Domingo and New York after 1950. Princeton, NJ: Princeton University Press.
United Nations Population Division. N.d. International Migrant Stock by Destination and Origin. Accessed March 1, 2018. Available online.
U.S. Census Bureau. N.d. 2016 American Community Survey (ACS). American FactFinder. Accessed March 1, 2018. Available online.
---. 2017. 2016 American Community Survey. Access from Steven Ruggles, Katie Genadek, Ronald Goeken, Josiah Grover, and Matthew Sobek. Integrated Public Use Microdata Series: Version 7.0 [dataset]. Minneapolis: University of Minnesota, 2017. Available online.
U.S. Citizenship and Immigration Services (USCIS). 2018. DACA Population Data, January 31, 2018. Available online.
U.S. Department of Homeland Security (DHS) Office of Immigration Statistics. 2017. 2016 Yearbook of Immigration Statistics. Washington, DC: DHS Office of Immigration Statistics. Available online.
World Bank Prospects Group. 2017. Annual Remittances Data, October 2017 update. Available online.