

The “Trump Effect” on Legal Immigration Levels: More Perception than Reality?

President Donald Trump speaks at an event in Arizona. (Photo: Gage Skidmore)
President Donald Trump has had a singular focus on restricting immigration, and his administration has issued more than 400 executive actions that have reshaped the U.S. immigration system. Yet for all its efforts, the administration’s success in actually reducing the number of legal immigrants admitted to the United States has been notably limited. The overall number of admissions—both on a permanent and temporary basis—declined only somewhat during most of the Trump years, remaining largely in line with broader trends that predated it. This changed with the COVID-19 pandemic, which brought about a dramatic reduction in immigration unlike anything seen in years.
To be sure, the Trump administration has made it much harder for many individuals to enter the United States. Indeed, it has been nearly impossible for people of certain nationalities to travel to the country, and refugee resettlement has declined precipitously. Further, the policy course set by the administration through a restrictive set of administrative and structural reforms, including significantly expanding the definition of who might be deemed a public charge, could have sizeable effects in years ahead, if left unchanged. In fact, these changes and the administration’s rhetoric may have already led to decreased numbers of applications for various immigration benefits for which individuals might be eligible.
But as the Trump tenure nears its end, analysis of immigration data shows that, despite public perception to the contrary, the administration’s policies have not led to a marked drop in the number of permanent immigrants, temporary foreign workers, international students, and those receiving asylum in the United States—at least not yet. In other words, with the exception of refugee admissions, there has not been a dramatic, across-the-board “Trump effect” attributable either to the administration’s policies or rhetoric on immigration levels.
Instead, the most significant drop in U.S. immigration during the president’s term came from COVID-19. As the pandemic affected migration globally, permanent and temporary immigration to the United States reached a record low in fiscal year (FY) 2020, a trend that could continue into FY 2021. The number of immigrant visas issued abroad in FY 2020 dipped 45 percent from a year earlier, and the number of temporary (nonimmigrant) visas issued decreased 54 percent. However, without the public-health crisis, it seems unlikely that immigrant and nonimmigrant visa issuance would have fallen this low. And while Trump acted to limit mobility in response to the coronavirus outbreak, trends suggest that immigration was dropping in advance of his proclamations.
This article examines how three distinct categories of legal immigrant flows—permanent, temporary, and humanitarian—have changed over the course of the Trump administration and how they compare to past trends. Despite the unprecedented number and pace of White House actions that have led to public perceptions of deep reductions, levels of immigration through FY 2019 remained relatively in line with previous years. While full data on FY 2020 admissions are not yet available, immigration flows in various categories were severely reduced during the pandemic.
Permanent Immigration
The number of people receiving green cards, either through adjustments of status of immigrants already in the United States or through visa processing abroad, has remained remarkably steady for the past ten years (see Figure 1). There have been two exceptions: an uptick in FY 2016, occurring in a relatively unchanged policy landscape from previous years, and a sharp decline in FY 2020, in the midst of the coronavirus outbreak. While FY 2020 numbers cannot yet be definitively compared with past years, as full-year data on green cards issued within the United States has not yet been released, significant drops are already apparent. The number of green cards issued within the country in the first three quarters of FY 2020 (October 2019 through June 2020) dropped 25 percent compared with the same period in FY 2019. And the 62,000 issued in the third quarter of FY 2020, at the height of COVID-19 lockdowns, was less than half the 153,000 issued during the third quarter of FY 2019. As mentioned above, the number of green cards issued abroad in the full year dropped 45 percent.
Figure 1. Number of Green Cards Issued, FY 2009-19
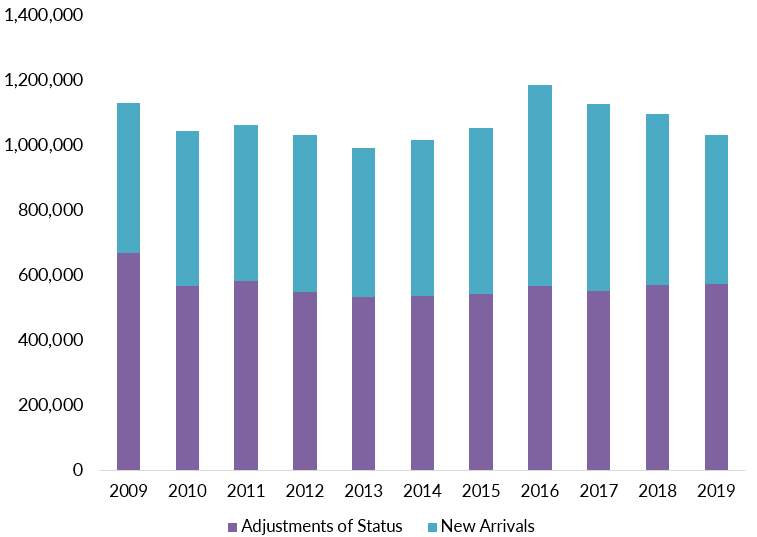
Sources: Department of Homeland Security (DHS), “Yearbook of Immigration Statistics—Table 6,” multiple years, accessed November 13, 2020, available online.
Not counting FY 2020, the most notable shift is that permanent immigration reached a historic peak of nearly 1.2 million green cards in FY 2016 and has been declining since. However, this gradual decline is not outside the normal range of the past decade and cannot be attributed to Trump administration policies alone. As a comparison, permanent immigration declined for almost five straight years between FYs 2009 and 2013, which was most likely a function of the aftermath of the 2008 recession rather than any policies of the administration of President Barack Obama. Similarly, it would be misleading to set the high level of FY 2016 as the benchmark against which the Trump administration’s admissions should be measured; rather, the apparent decline since then might be considered a reversion to the norm of the last decade. Additionally, approval rates for green cards did not decline meaningfully before FY 2020. In FY 2016, 92 percent of green-card applications were approved, compared with 88 percent in FY 2019.
The timeline of the administration’s polices helps assess whether or not a Trump effect on immigration exists. Permanent immigration decreased in 2017, during the president’s first year in office. Yet aside from the travel ban, which at the time affected seven countries that have historically low levels of permanent immigration to the United States, that year saw fewer restrictive policies on immigration. Some have attributed the small immigration decline in the first three years of the Trump administration to the president’s rhetoric, which created a perception that the United States was inhospitable to immigrants. But this theory has limited credence, since many of those eligible to receive green cards had been waiting in backlogs for years, and thus were unlikely to be dissuaded by the changed U.S. political atmosphere surrounding immigration.
This is not to suggest that the Trump administration’s tone and policies have had no effect. Between FYs 2016 and 2019, new applications for green cards decreased by 17 percent. This shift could be a reaction to Trump administration policy and rhetoric. But it could also be that fewer people chose to join inordinately long visa application backlogs. In either case, it did not lead to an extreme reduction in the number of green cards issued over this period, though it could affect the number issued in future years.
More than any earlier actions by the administration, closures of U.S. consulates and changes in global migration amid COVID-19 had the most dramatic effect on permanent immigration. Just over 250,000 immigrant visas were granted abroad in FY 2020, compared to 459,000 in FY 2019 (notably similar to the 463,000 granted a decade earlier, in FY 2009). To be sure, Trump has taken advantage of the pandemic to restrict immigration, issuing proclamations on April 22 and June 22 that prevent certain categories of permanent and temporary immigrants from entering the country. However, the drop in permanent immigration preceded those actions, suggesting they were not the primary drivers of the change.
Immigrant visa issuance abroad declined 35 percent between February and March, and 94 percent between March and April, when U.S. consulates closed because of the pandemic. Moreover, global migration fell by 46 percent during the first half of 2020. So it seems likely that permanent immigration to the United States would have been severely affected in the first part of the year even if the Trump administration had not made restrictive policy changes. Since then, however, the April and June proclamations have been effective in continuing to limit visa issuances in certain categories even as consulates reopen.
It is impossible to say what would have happened in FY 2020 had the pandemic not taken place. There is a chance that the number of green cards issued would have declined somewhat all the same, possibly due to other policy changes such as the implementation of the public-charge rule and more intensive vetting of applications, resulting in fewer approvals. But it seems unlikely that immigration levels would have dropped as sharply as they did.
Naturalizations
The administration has taken high-profile actions to denaturalize some people who may have attained citizenship fraudulently, yet these moves remain extremely rare. On the other hand, the number of people naturalized as U.S. citizens per year has risen during the Trump years, at least up through FY 2019, the last year for which data are available (see Figure 2). Similar to green cards, the approval rate for citizenship applications was reasonably steady under Trump and consistent with prior years. In FY 2019, 90 percent of applications were approved; since 2010, approval rates have stayed between 89 and 92 percent.
Figure 2. Total Naturalizations, FY 2009-19
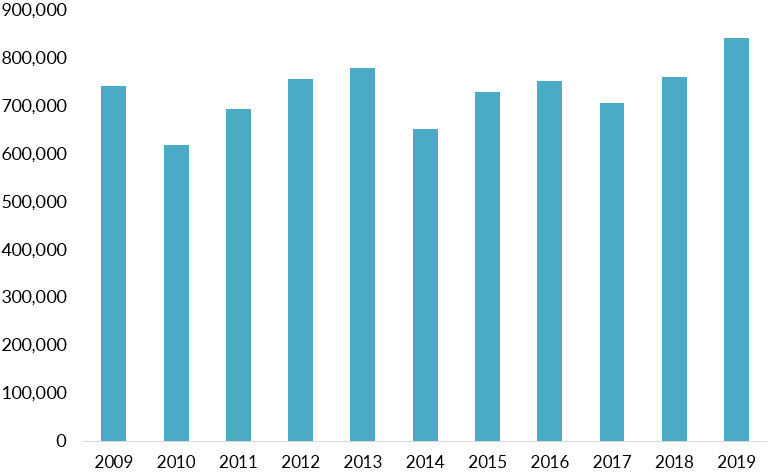
Source: DHS, “Yearbook of Immigration Statistics—Table 20,” multiple years, accessed November 13, 2020, available online.
The one exception to this trend is fewer grants of citizenship to immigrants serving in the U.S. military (see Figure 3). This is likely due to the Trump administration’s policies delaying naturalization for noncitizen members of the military. On average, however, these account for only approximately 1 percent of the total pool of naturalizations, so do not have a significant impact.
Figure 3. Military Naturalizations, FY 2009-19
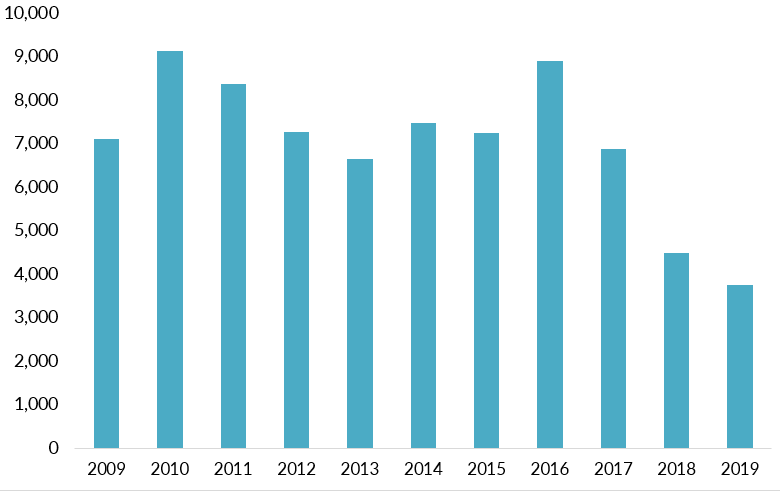
Source: DHS, “Yearbook of Immigration Statistics—Table 20,” multiple years, accessed November 13, 2020.
While approval rates have stayed steady and naturalizations have increased, the average processing time for naturalization applications has lengthened from six months in FY 2016 to ten in FYs 2018 and 2019. This is partly due to Trump administration policies changing the adjudication process and diverting U.S. Citizenship and Immigration Services (USCIS) resources elsewhere, including to heightened vetting for fraud.
Temporary Immigration
As with permanent immigration, FY 2020 saw a dramatic drop in the number of nonimmigrant visas issued, due to the pandemic. Before then, the total number of nonimmigrant visa grants decreased by 10 percent between FYs 2017 and 2019, but this was not evidence of the Trump effect at work. Rather, the decline was driven almost entirely by a drop in tourist and business visas, a trend that started before Trump, in FY 2016 (see Figure 4). Excluding tourist and business visas, the number of nonimmigrant visas issued was virtually flat between FYs 2017 and 2019.
Figure 4. Total Nonimmigrant Visas Issued, and Total Issued Excluding Tourist and Business Visas, FY 2009-20
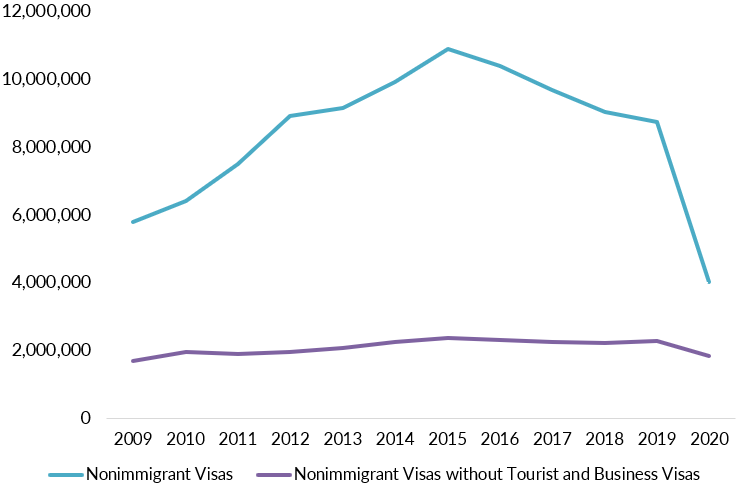
Sources: U.S. Department of State, “Monthly Nonimmigrant Visa Issuance Statistics,” multiple months, accessed November 14, 2020, available online; U.S. Department of State, “Report of the Visa Office,” multiple years, accessed November 14, 2020, available online.
However, drilling down further into the trends within the categories of visas for temporary workers and students shows that applicants for different types of nonimmigrant visas have fared differently.
Temporary Workers
The number of people approved to enter the United States to work temporarily has mostly increased. Approvals of petitions for temporary high-skilled workers on H-1B visas overall increased 6 percent between FYs 2017 and 2019. Approvals of petitions for new H-1B workers (as opposed to continuing workers) dropped in FY 2018 but then shot back up the following year, to the highest level since FY 2001 (see Figure 5).
The drop in FY 2018 was likely due in part to increased scrutiny of H-1B applications, which delayed final decisions because petitioners were required to submit additional evidence at considerably higher rates. However, approvals rebounded once these requests were resolved and petitioners and their lawyers have, perhaps, learned how to navigate the new scrutiny.
Figure 5. USCIS Approvals of Petitions for H-1B Workers, FY 2009-19
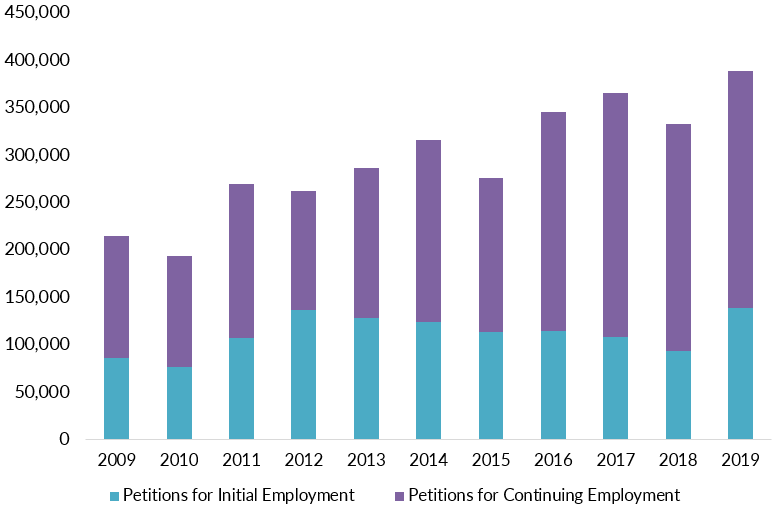
Sources: U.S. Citizenship and Immigration Services (USCIS), “Reports and Studies—Characteristics of Specialty Occupation Workers (H-1B),” multiple years, updated September 29, 2020, available online.
Approved L visas, for intracompany transferees, decreased 4 percent between FYs 2017 and 2019. However, approvals dropped in FY 2018 and then bounced back somewhat in FY 2019, despite new policies that were seen as making it more difficult for L visa applicants to qualify. As with H-1B visas, the dip and rebound likely reflect a period during which applications were more heavily scrutinized, and lawyers and applicants adjusted.
Approvals and admissions for other temporary worker programs also increased during the first three Trump years, continuing longer-running trends (see Figure 6). Approvals of H-2A visas, for seasonal agricultural workers, grew 27 percent between FYs 2017 and 2019, following a trend that has been ongoing since FY 2012. Agricultural businesses have increasingly turned to H-2A workers as the number of unauthorized immigrant farmworkers has decreased. Unlike many other types of immigration, approvals of H-2A visas continued to rise even in FY 2020.
The number of approved H-2B visas, for seasonal nonagricultural workers, increased 17 percent from FY 2017 to FY 2019, though it subsequently fell during the pandemic. This increase was due to the Trump administration's support for congressional appropriations bills with provisions allowing the Department of Homeland Security (DHS) to temporarily raise the statutory H-2B cap of 66,000 yearly visas (appropriations legislation has been used by multiple administrations to raise the cap in previous years).
Figure 6. Visas Approved for Seasonal Workers, FY 2009-20

Sources: U.S. Department of State, “Monthly Nonimmigrant Visa Issuance Statistics,” multiple months; U.S. Department of State, “Report of the Visa Office,” multiple years.
International Students
Unlike the other temporary visa categories discussed above, there has been a consistent decrease in the number of international student visas issued. These decreases began pre-Trump, in FY 2016, dropping from a peak of 678,000 in FY 2015 to 502,000 in FY 2016 and, most recently, 389,000 in FY 2019.
For several years, administrators of educational institutions surveyed by the Institute for International Education (IIE) have cited the “social and political environment” in the United States and visa delays and denials, among other factors, as a reason for the decline in international student enrollment. Visa denials indeed increased from FY 2013 through FY 2016, though they have since decreased. The Trump administration’s rhetoric could have contributed to the declining interest in coming to the United States to study. Other factors may also be at work, according to IIE, including the increasing cost of U.S. education and growing competition from institutions in other countries.
Additionally, the majority of student visas are issued to individuals from only a handful of countries. Therefore, policies that affect specific nationalities may have an outsize effect on the student visa program. In FY 2015, for example, at the peak of visa issuances, 58 percent of U.S. student visas were issued to nationals of China, India, and Saudi Arabia. Declines in student visas issued to these three countries accounted for 77 percent of the overall student visa decrease from FY 2015 to FY 2019 (see Figure 7).
A variety of factors has contributed to the decrease in visas being issued to students of these nationalities, only some of which can be tied to the Trump administration. In 2016, for example, the Saudi government made it more difficult for Saudi students to obtain government-funded scholarships to study abroad. Starting in 2018, the Trump administration heightened screening of visa applications from Chinese students in certain fields determined to be sensitive, and reduced the validity periods of some of these visas that were ultimately approved. However, the decline in Chinese student visas began in FY 2016, so this change does not appear to have been the sole driving factor. Furthermore, the difficulty in obtaining H-1B visas and the long backlogs for employment-based green cards may have been dissuading Indian nationals from seeking to enter the United States as foreign students.
Figure 7. Student Visas Issued to Nationals of China, India, Saudi Arabia, and All Other Countries, FY 2014-19
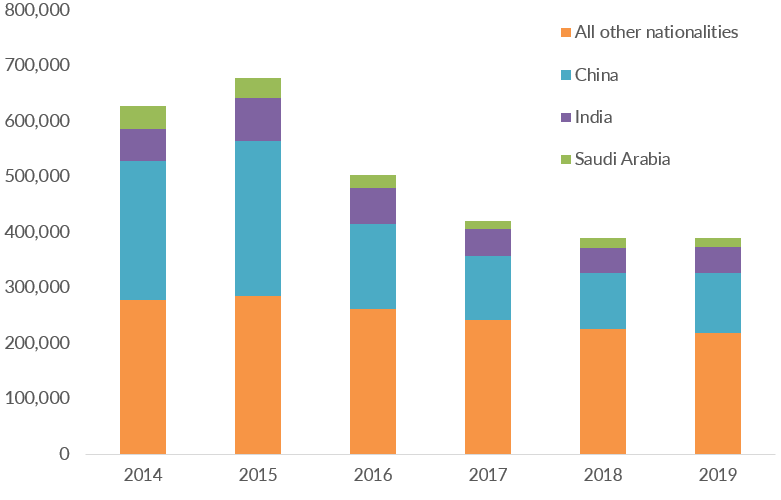
Sources: U.S. Department of State, “Report of the Visa Office,” multiple years.
Humanitarian Immigration
The administration’s policies on refugees and asylum seekers have received perhaps the most public scrutiny and media attention. Indeed, the changes in this area have had near immediate and dramatic effects. The administration has sharply lowered refugee admissions, arguing that refugees pose a national security threat and impose a significant financial burden on federal and local governments. In FYs 2018 and 2020, the Trump administration admitted the lowest numbers of refugees since the current U.S. refugee resettlement program began in 1980: 22,491 and 11,814 respectively. This was a significant drop compared to the 84,995 refugees resettled in FY 2016.
The administration has also significantly narrowed eligibility for asylum in the United States, for example by eliminating certain grounds for asylum and making it almost impossible to be granted asylum or, more recently, even apply for it at the border. These changes have led many to conclude that the prospects for receiving asylum in the United States have largely ended.
However, the number of asylum seekers whose claims were approved actually increased during the Trump years—to the highest level since at least 1990 (see Figure 8). This is partly because there have been many more asylum applicants in recent years, and the backlog has been growing for several years. In many instances, applications that were approved while Trump was in office were filed during the Obama administration. The Trump administration has also accelerated adjudications, resulting in more completed cases per year.
Figure 8. U.S. Grants of Asylum, FY 1990-2019
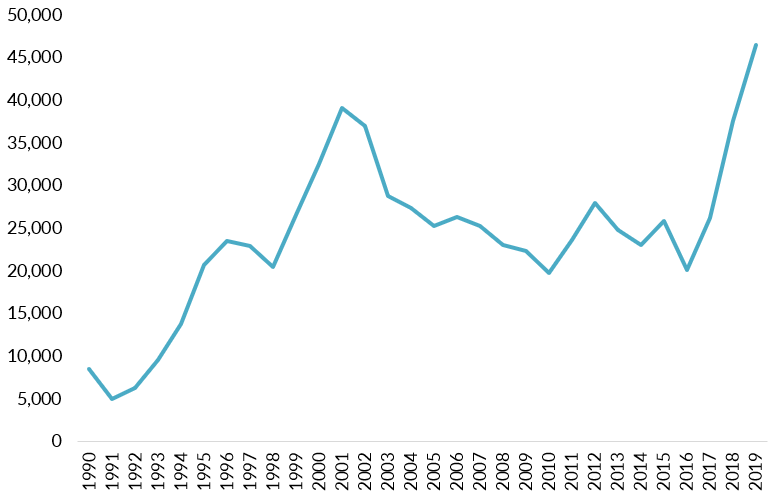
Source: DHS, “Table 16. Individuals Granted Asylum Affirmatively or Defensively: Fiscal Years 1990 to 2019,” updated October 28, 2020, available online.
At the same time, asylum denials have increased even more than approvals, meaning that although the number of asylum grants increased, the approval rate has concurrently decreased, from 43 percent in FY 2016 to 29 percent in FY 2019. Furthermore, the Trump administration’s dramatic narrowing of opportunities to apply for asylum has contributed to fewer new applications being filed. Since these applications can take a long time to process, it is likely that, absent major policy reversals, the number of approved asylum cases will fall substantially in coming years.
What Might Lie Ahead?
Trump's tenure underscores the limitations of affecting legal immigration levels through executive actions—even when undertaken by the most activist administration on immigration in the modern era. President-elect Joe Biden has promised to roll back many of Trump’s immigration policies upon taking office in January. Even if Biden reverses some of the more consequential of his predecessor’s policies and can overcome the inherent sluggishness of the immigration system, his administration similarly will have to contend with the COVID-19 pandemic and other external factors affecting immigration, including the changing global demand for U.S. higher education.
At the same time, the fact that Trump’s policies did not meaningfully reduce legal immigration levels during the first three years of his presidency does not mean they will prove to be toothless in the longer run. Due to the slow-moving nature of immigration processes, there can be a significant lag between enacting policy and realizing its effects. How the trends hold over the coming years remains to be seen. It may turn out that, absent countermeasures that check the more extreme changes in both immigration policy and narrative, the Trump effect becomes evident only after he leaves office.
The authors thank Randy Capps, Julia Gelatt, and Doris Meissner for their significant contributions to this article.
Sources
Capps, Randy and Carlos Echeverría-Estrada. 2020. A Rockier Road to U.S. Citizenship? Findings of a Survey on Changing Naturalization Procedures. Washington, DC: Migration Policy Institute. Available online.
Chishti, Muzaffar, Austin Rose, and Stephen Yale-Loehr. 2019. Noncitizens in the U.S. Military: Navigating National Security Concerns and Recruitment Needs. Washington, DC: Migration Policy Institute. Available online.
Migration Policy Institute (MPI) Migration Data Hub. N.d. Refugee Admissions, 1980-2020. Accessed November 13, 2020. Available online.
Papademetriou, Demetrios G. 2020. Managing the Pandemic and Its Aftermath: Economies, Jobs, and International Migration in the Age of COVID-19. Washington, DC: Migration Policy Institute. Available online.
Pierce, Sarah and Jessica Bolter. 2020. Dismantling and Reconstructing the U.S. Immigration System: A Catalog of Changes under the Trump Presidency. Washington, DC: Migration Policy Institute. Available online.
Sanger, Jodi and Julie Baer. 2019. Fall 2019 International Student Enrollment Snapshot Survey. New York: Institute of International Education. Available online.
U.S. Department of Homeland Security. N.d. Yearbook of Immigration Statistics. Updated October 27, 2020. Available online.
U.S. Department of State. N.d. Monthly Immigrant Visa Issuance Statistics. Accessed November 13, 2020. Available online.
---. N.d. Monthly Nonimmigrant Visa Issuance Statistics. Accessed November 14, 2020. Available online.
---. N.d. Report of the Visa Office. Accessed November 14, 2020. Available online.