

Afghan Immigrants in the United States

A family of Afghan evacuees leaving Fort McCoy, Wisconsin. (Photo: Sgt. Robert P Wormley III/U.S. Army)
In the past decade, the Afghan immigrant population in the United States has grown dramatically, as the U.S. military presence in Afghanistan ended. Between 2010 and 2022, the Afghan immigrant population nearly quadrupled, from approximately 54,000 to 195,000, while the overall U.S. immigrant population grew by 16 percent. This substantial increase can be attributed to years of war and political instability in Afghanistan that generated a steady flow of humanitarian migrants, as well as the withdrawal of U.S. and allied troops in 2021.
The U.S. withdrawal marked a turning point for Afghan migrants globally, and particularly in the United States. The Biden administration launched Operation Allies Welcome (OAW) in 2021, which gave 76,000 evacuated Afghans humanitarian parole to enter the United States. Afghan immigrants residing in the United States in 2022 represented about 0.4 percent of the total 46.2 million U.S. immigrants. The United States is far from the top country for Afghan migrants. The UN High Commissioner for Refugees (UNHCR) estimated there were about 5.7 million Afghan refugees worldwide as of 2023, the large majority of whom were in Iran and Pakistan (3.4 million and 1.9 million, respectively).
Conflict drove migration from Afghanistan to the United States for decades before the 2021 U.S. withdrawal, including during the 1979 Soviet invasion of Afghanistan, subsequent turmoil after the fall of the Soviet Union, the civil war of the 1990s, and two decades of U.S. presence in the country. Since the U.S.-led invasion in 2001, many Afghans worked as interpreters, translators, and other professionals with or on behalf of the U.S. government.
In 2006, the United States created the Special Immigrant Visa (SIV) program, which provides a pathway to legal permanent residency (also known as getting a green card) for Afghan and Iraqi translators and interpreters employed by the U.S. military. The program originally issued a maximum of 50 SIVs per fiscal year, but it has been extended and amended multiple times to increase the threshold. Passage of the Afghan Allies Protection Act of 2009 expanded eligibility to include any Afghan national employed by the U.S. government. During the withdrawal of U.S. troops in 2021, the Averting Loss of Life and Injury by Expediting SIVs (ALLIES) Act sought to streamline the SIV application process.
However, most Afghans evacuated to the United States after the 2021 withdrawal were brought through humanitarian parole. Unlike those with an SIV, parolees have no pathway to a green card and have only temporary permission to be in the country. Congress has repeatedly declined to pass legislation allowing Afghan parolees to apply for permanent legal status and expanding those eligible for an SIV, which in fiscal year (FY) 2022 was the primary way Afghans became lawful permanent residents (LPRs).
Compared to other U.S. immigrants, Afghans are less likely to be proficient in English, have lower educational attainment, and lower labor force participation. Compared to both the native born and the overall foreign-born population, they are much more likely to be living in poverty and tend to be significantly younger.
This Spotlight provides information on the Afghan immigrant population in the United States, focusing on its size, geographic distribution, and socioeconomic characteristics.
Click on the bullet points below for more information:
- Size of Immigrant Population over Time
- Distribution by U.S. State and Key Cities
- English Proficiency
- Age, Education, and Employment
- Income and Poverty
- Immigration Pathways and Naturalization
- Health Coverage
- Diaspora
- Top Global Destinations
- Remittances
Size of Immigrant Population over Time
The Afghan immigrant population has grown substantially in recent decades. Between 1980 and 2000, the number of Afghans residing in the United States grew more than tenfold, and rose another 20 percent between 2000 and 2010. Even before the fall of Kabul in 2021, the U.S. Afghan immigrant population more than doubled between 2010 and 2019, going from 54,000 to 132,000.
Figure 1. Afghan Immigrant Population in the United States, 1980-2022
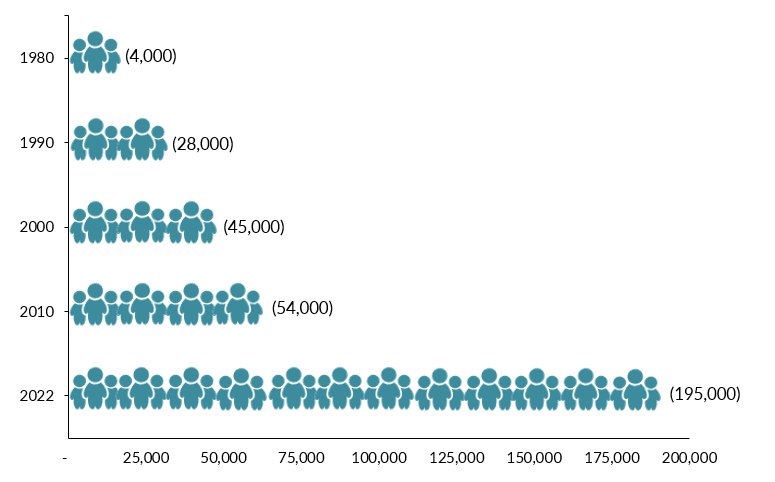
Sources: Data from U.S. Census Bureau 2010 and 2022 American Community Surveys (ACS), and Campbell J. Gibson and Kay Jung, "Historical Census Statistics on the Foreign-Born Population of the United States: 1850-2000" (Working Paper no. 81, U.S. Census Bureau, Washington, DC, February 2006), available online.
Distribution by U.S. State and Key Cities
Immigrants from Afghanistan were concentrated in California (39 percent), Virginia (14 percent), Texas (10 percent), and New York (6 percent) as of the 2018-22 period. The top counties by Afghan population were Sacramento and Alameda counties in California, Fairfax County in Virginia, and King County in Washington. Together, these four counties were home to 27 percent of Afghan immigrants in the United States.
Figure 2. Top States of Residence for Afghan Immigrants in the United States, 2018-22
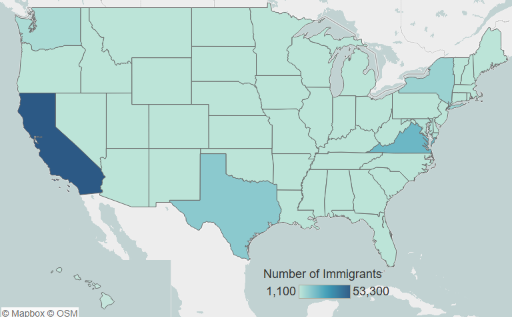
Notes: Pooled 20187-22 ACS data were used to get statistically valid estimates at the state level for smaller-population geographies. Not shown is the population in Alaska, which is small in size; for details, visit the Migration Policy Institute (MPI) Migration Data Hub for an interactive map showing geographic distribution of immigrants by state and county, available online.
Source: MPI tabulation of data from the U.S. Census Bureau's pooled 2018-22 ACS.
Click here for an interactive map that highlights the states and counties with the highest concentrations of immigrants from Afghanistan or other country.
The U.S. cities with the largest number of Afghans as of the 2018-22 period were the greater Washington, DC, Sacramento, San Francisco, Los Angeles, and New York metropolitan areas. These five metro areas accounted for almost 48 percent of Afghans residing in the United States.
Figure 3. Top Metropolitan Destinations for Afghan Immigrants in the United States, 2018-22
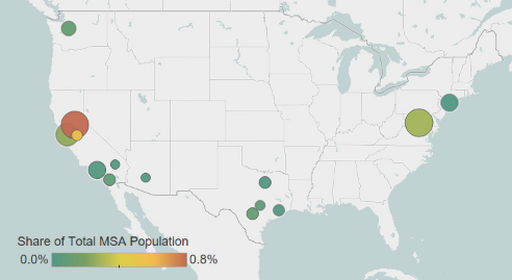
Notes: Pooled 2018-22 ACS data were used to get statistically valid estimates at the metropolitan statistical-area level for smaller-population geographies. Not shown are the populations in Alaska and Hawaii, which are small in size; for details, visit MPI’s Migration Data Hub for an interactive map showing geographic distribution of immigrants by metro area, available online.
Source: MPI tabulation of data from U.S. Census Bureau pooled 2018-22 ACS.
Click here for an interactive map that highlights the metro areas with the most immigrants from Afghanistan or other country.
Table 1. Top Concentrations by U.S. Metropolitan Area for the Foreign Born from Afghanistan, 2018-22
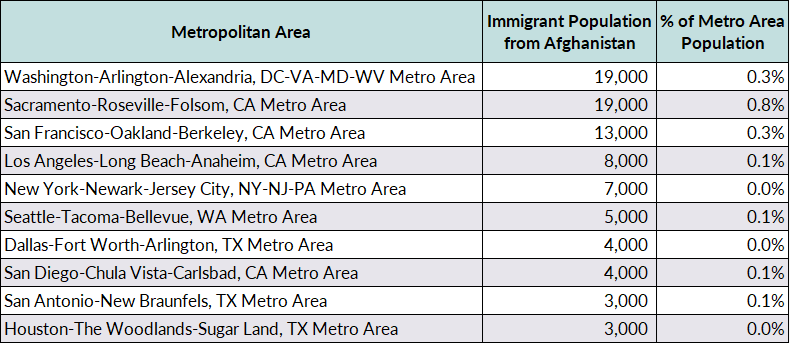
Source: MPI tabulation of data from the U.S. Census Bureau pooled 2018-22 ACS.
Afghan immigrants are less likely to be proficient in English than the overall foreign-born population. In 2022, about 56 percent of Afghans ages 5 and over reported speaking English less than “very well,” compared to 46 percent of all immigrants. Approximately 10 percent of Afghans spoke only English at home, versus 17 percent of the total foreign-born population.
English proficiency also varies by gender and period of arrival. While immigrant women and girls overall were only slightly more likely to lack proficiency in English than immigrant men and boys (46 percent versus 45 percent, respectively), 60 percent of Afghan women and girls lacked English proficiency, versus 53 percent of Afghan men and boys in 2022. Among those who arrived in the United States in 2012 or later, shares without proficiency in English were higher: 68 percent for Afghan women and girls and 59 percent for Afghan men and boys. For comparison, 52 percent of all recently arrived immigrant women and girls and 49 percent for their male counterparts reported limited proficiency in English as of 2022.
As to the languages other than English spoken at home, immigrants from Afghanistan were most likely to speak Pashto (32 percent), Persian (Farsi; 27 percent), and Dari (26 percent). Those who have arrived since 2012 are more likely to speak Pashto (37 percent), followed by Dari (30 percent) and Persian (Farsi; 20 percent).
Age, Education, and Employment
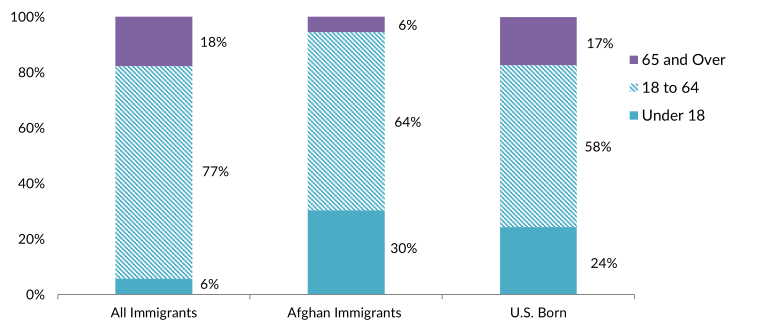
Afghan immigrants are on average much younger than both the overall foreign-born population and the U.S. born. Their median age in 2022 was 31 years, compared to 47 years for all immigrants and 37 years for the native born. This is due to the high share of Afghan children; 30 percent of Afghan immigrants were under 18, versus only 6 percent of the overall foreign-born population (see Figure 4). Compared to the U.S. born, Afghans were more likely to be of working age (18 to 64 years old): 64 percent versus 58 percent.
Figure 4. Age Distribution of the U.S. Population by Origin, 2022
Note: Percentages may not add up to 100 as they are rounded to the nearest whole number.
Source: MPI tabulation of data from the U.S. Census Bureau 2022 ACS
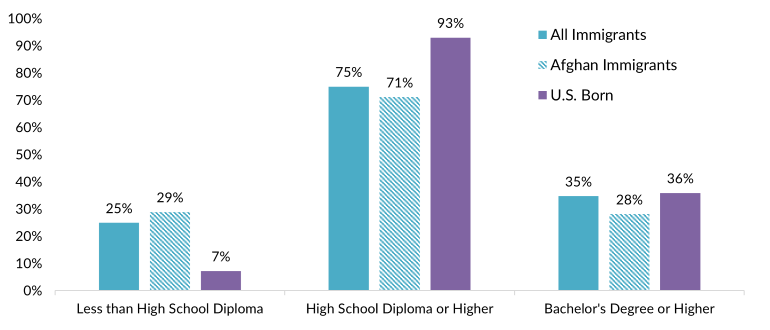
Overall, Afghans tend to have lower educational attainment than both the U.S.- and overall foreign-born populations. In 2022, 28 percent of Afghan immigrants ages 25 and older reported having at least a bachelor’s degree, compared to 36 percent of the U.S. born and 35 percent of all foreign born (see Figure 5). Twenty-nine percent of Afghan immigrant adults had less than a high school diploma, higher than all immigrant adults (25 percent). Among Afghans who arrived between 2020 and 2022, 36 percent held at least a four-year college degree, a rate much lower than that of all immigrants arriving in that period (48 percent).
Click here for data on immigrants’ educational attainment by country of origin and overall.
Figure 5. Educational Attainment of the U.S. Population (ages 25 and older) by Origin, 2022
Note: Percentages may not add up to 100 as they are rounded to the nearest whole number.
Source: MPI tabulation of data from the U.S. Census Bureau 2022 ACS
Afghan men tend to have higher educational attainment. Among men, 23 percent lacked a high school diploma as of 2022, versus 36 percent of women. Men were also more likely to have a college degree than women (32 percent versus 24 percent). The higher educational attainment of Afghan men can be explained partly by the channels though which they come to the United States. Many Afghan men were previously employed by the U.S. government as interpreters, translators, or medical staff, positions that required English proficiency, higher education, or both. Lower educational attainment among Afghan women meanwhile reflects longstanding educational barriers they face, particularly in rural areas of Afghanistan.
According to the Institute of International Education, 680 students from Afghanistan were enrolled in U.S. colleges and universities in the 2022-23 school year, comprising a tiny share of the more than 1 million international students in the United States.
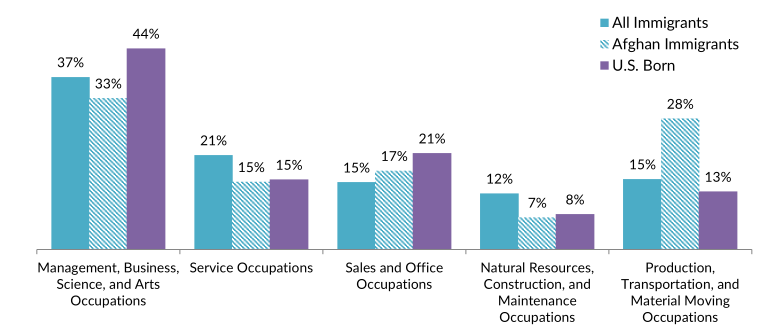
Afghans have a relatively low labor force participation rate. In 2022, 61 percent of Afghan immigrants 16 and older were in the civilian labor force, compared to 67 percent for all immigrants and 63 percent for the U.S. born. The same holds for women; 37 percent of those from Afghanistan were in the civilian labor force in 2022, compared to 57 percent of all foreign-born women. Employed Afghan immigrants are most likely to be in management, business, science, and arts occupations, followed by production, transportation, and material moving occupations (see Figure 6).
Figure 6. Employed Workers in the Civilian Labor Force (ages 16 and older) by Occupation and Origin, 2022
Note: Percentages may not add up to 100 as they are rounded to the nearest whole number.
Source: MPI tabulation of data from the U.S. Census Bureau 2022 ACS.
Afghan immigrants tend to have much lower incomes than the native- and overall foreign-born populations. In 2022, the median household income of Afghan immigrants was $48,000, lower than the $75,000 for both immigrant and U.S.-born households.
Afghan immigrants are much more likely to be in poverty than both the U.S.- and overall foreign-born populations. In 2022, 39 percent of Afghan immigrants were in poverty, compared to 12 percent for the native born and 14 percent for immigrants overall. (The U.S. Census Bureau defines poverty in 2022 as having an income below $29,700 for a family of four.)
Immigration Pathways and Naturalization
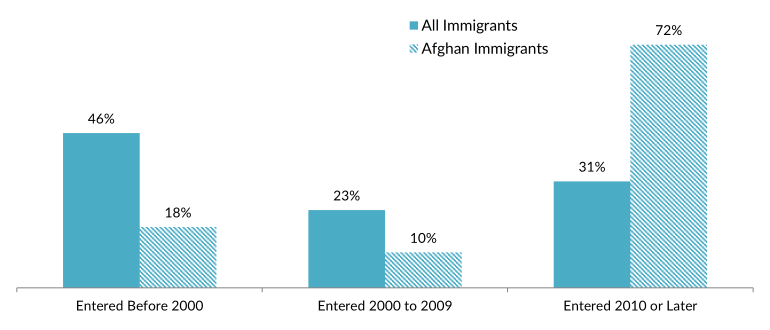
Compared to all immigrants, Afghans are more likely to have arrived in 2010 or later. Approximately 72 percent arrived in this period, versus 31 percent of all immigrants (see Figure 7). As a result, Afghans are less likely to be naturalized U.S. citizens than the overall foreign-born population (37 percent versus 53 percent, respectively).
Figure 7. Afghans and All Immigrants in the United States by Period of Arrival, 2022
Note: Percentages may not add up to 100 as they are rounded to the nearest whole number.
Source: MPI tabulation of data from the U.S. Census Bureau 2022 ACS
In FY 2022, 14,200 Afghans became LPRs, accounting for just 1 percent of all 1 million green card recipients that year. Eighty-one percent of Afghans and dependents receiving a green card did so through the SIV program, while about 10 percent did so through the family sponsorship pathway. Despite the decades of conflict in their origin country, Afghans are notably less likely than immigrants overall to come as refugees or asylum seekers.
Figure 8. Immigration Pathways of Afghans and All Lawful Permanent Residents in the United States, 2022
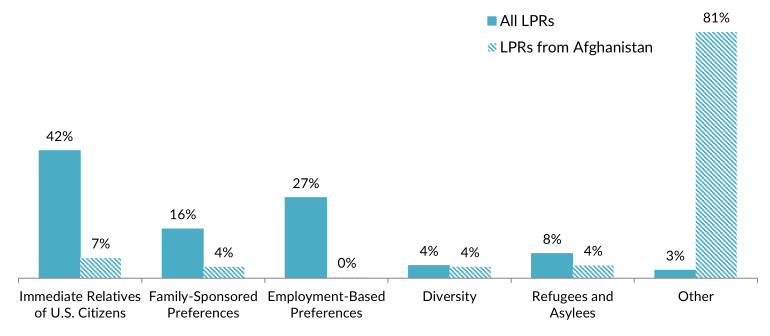
Notes: Immediate Relatives of U.S. Citizens: Includes spouses, minor children, and parents of U.S. citizens. Family-Sponsored Preferences: Includes adult children and siblings of U.S. citizens as well as spouses and children of green-card holders. The Diversity Visa lottery was established by the Immigration Act of 1990 to allow entry to immigrants from countries with low rates of immigration to the United States. The law states that 55,000 diversity visas in total are made available each fiscal year. Individuals born in Afghanistan were eligible for the 2025 lottery. Percentages may not add up to 100 as they are rounded to the nearest whole number.
Source: MPI tabulation of data from Department of Homeland Security (DHS), “Table 10D: Persons Obtaining Lawful Permanent Resident Status by Broad Class of Admission and Region and Country of Birth: Fiscal Year 2022,” updated August 21, 2023, available online.
Between October 1, 2023 and December 31, 2023 (the latest available data as of this writing), an additional 6,200 Afghans were resettled in the United States as SIV holders. California, Texas, Virginia, Washington, and Maryland were home to 67 percent of these new SIV immigrants.
In part because most Afghan immigrants are SIV recipients, refugees, or asylum seekers, they are more likely to have health insurance than the overall immigrant population. In 2022, 65 percent of Afghan immigrants had public health insurance while only 8 percent were uninsured (see Figure 8).
Figure 9. Health Coverage for Afghan Immigrants, All Immigrants, and the U.S. Born, 2022
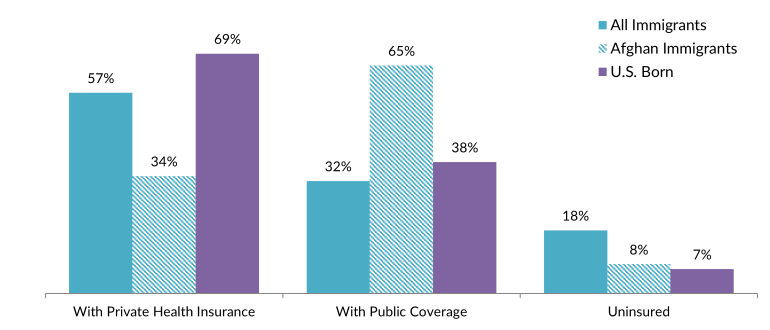
Note: The sum of shares by type of insurance is likely to be greater than 100 because people may have more than one type of insurance.
Source: MPI tabulation of data from the U.S. Census Bureau 2022 ACS.
The Afghan diaspora in the United States is comprised of approximately 250,000 individuals who were either born in Afghanistan or reported Afghan ancestry, according to tabulations from the U.S. Census Bureau 2022 ACS.
Approximately 5.9 million international refugees and other migrants from Afghanistan live outside the country, as of the most recent, mid-2020 United Nations Population Division Estimates, although due to the ongoing humanitarian crisis this number is likely an undercount. Iran is the top destination for Afghans living abroad, accounting for 46 percent of all emigrants from Afghanistan. Pakistan is home to the next largest population of Afghans (27 percent), followed by Saudi Arabia (8 percent), Germany (4 percent), and the United States and Turkey (2 percent each).
Click here to view an interactive map showing where migrants from countries from Afghanistan and other countries have settled worldwide.
Afghans abroad and others with connections to the country sent about $370 million in remittances to Afghanistan via formal channels in 2022, according to World Bank estimates (see Figure 10). That represents a nearly $261 million increase since 2008 but a $479 million decrease from 2019, the year of the highest volume of remittances. The dramatic decrease is likely caused by the COVID-19 pandemic combined with the Taliban’s takeover and subsequent international financial sanctions placed on the country. Remittances represented about 2 percent of the country’s gross domestic product (GDP) in 2021, the latest year for which data are available for this indicator.
Figure 10. Annual Remittance Flows to Afghanistan, 2008 to 2022
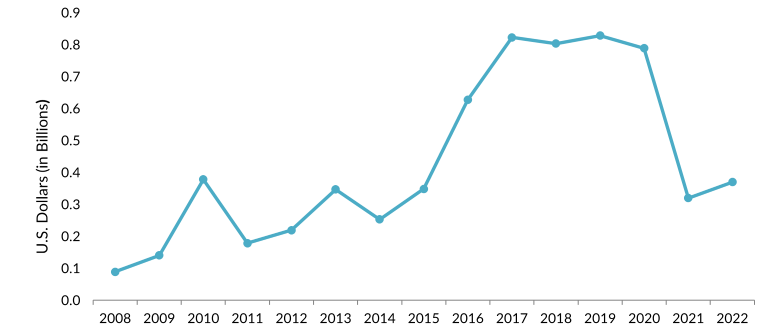
Source: MPI tabulations of data from the World Bank Global Knowledge Partnership on Migration and Development (KNOMAD), “Remittance Inflows,” December 2023 update, available online.
Click here to view an interactive chart showing annual remittances received by and sent to Afghanistan and other countries.
Sources
Chishti, Muzaffar and Jessica Bolter. 2022. Welcoming Afghans and Ukrainians to the United States: A Case in Similarities and Contrasts. Migration Information Source, July 13, 2022. Available online.
Chishti, Muzaffar and Kathleen Bush-Joseph. 2023. In the Twilight Zone: Record Number of U.S. Immigrants Are in Limbo Statuses. Migration Information Source, August 2, 2023. Available online.
Gibson, Campbell J. and Kay Jung. 2006. Historical Census Statistics on the Foreign-Born Population of the United States: 1850-2000. Working Paper no. 81, U.S. Census Bureau, Washington, DC, February 2006. Available online.
Institute of International Education (IIE). N.d. International Students: All Places of Origin. Accessed February 8, 2024. Available online.
Knowledge Partnership on Migration and Development (KNOMAD)/World Bank Group. 2023. Remittance Inflows. Updated December 2023. Available online.
Migration Policy Institute (MPI), Migration Data Hub. N.d. U.S. Immigrant Population by State and County. Accessed January 29, 2024. Available online.
---. N.d. Refugee and Asylum Seeker Populations by Country of Origin and Destination, 2000-2022. Accessed February 7, 2024. Available online.
Saydee, Farid and Durana Saydee. 2021. Afghan Backgrounder. N.p.: Cultural Orientation Resource Exchange. Available online.
United Nations Population Division. 2020. International Migrant Stock 2020: Destination and Origin. Available online.
U.S. Census Bureau. N.d. 2022 American Community Survey—Advanced Search: S0201 Selected Population Profile in the United States. Accessed January 22, 2024. Available online.
U.S. Department of Homeland Security (DHS). 2021. Fact Sheet on Operation Allies Welcome. Fact sheet, Washington, DC, November 10, 2021. Available online.
DHS, Office of Immigration Statistics. 2023. 2022 Yearbook of Immigration Statistics. Washington, DC: DHS Office of Immigration Statistics. Available online.
U.S. Office of Management and Budget (OMB), Executive Office of the President. 2021. Statement of Administration Policy. Washington, DC: OMB, July 19, 2021. Available online.
U.S. State Department, Bureau of Consular Affairs. N.d. Special Immigrant Visas for Afghans - Who Were Employed by/on Behalf of the U.S. Government. Accessed January 22, 2024. Available online.
---. N.d. Special Immigrant Visas (SIVs) for Iraqi and Afghan Translators/Interpreters. Accessed January 22, 2023. Available online.
U.S. State Department, Bureau of Population, Refugees, and Migration. 2021. Amerasian & SIV Arrivals by Nationality and State Fiscal Year 2024: October 1, 2020 through July 31, 2021. Updated August 18, 2021. Available online.