

The Recently Arrived Foreign Born in the United States in 2005
The U.S. Senate has begun debating the Secure Borders, Economic Opportunity and Immigration Reform Act of 2007. If passed, the bill would be the largest overhaul of U.S. immigrant admissions policies since the Immigration Act of 1990.
This Spotlight describes the characteristics of recently arrived immigrants to the United States — those who came between 1990 and 2005. The data used are from the U.S. Census Bureau's 2005 American Community Survey.
Click on the bullet points below for more information:
- Over half of the foreign born in the United States in 2005 were recent arrivals.
- Four of the top-five sending countries of recent arrivals to the United States saw the size of their U.S. communities more than double between 1990 and 2005.
- Eight in 10 recently arrived foreign born in 2005 were of working age.
- Among recently arrived foreign born, men slightly outnumbered women.
- More than half of recently arrived foreign-born men and women age 16 and older were married in 2005.
- Recently arrived foreign-born women were more likely to be naturalized U.S. citizens than their male counterparts.
- Forty-four percent of recent immigrants to the United States in 2005 completed at least some college.
- Nearly 84 percent of recently arrived foreign-born men were in the labor force.
- More than a quarter of recently arrived foreign-born men worked in construction, extraction, and transportation occupations.
- Younger immigrants were more than three times likely than older immigrants to speak English "very well" or better.
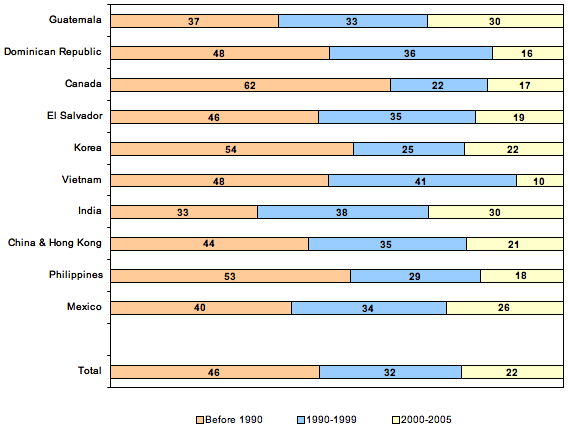
Over half of the foreign born in the United States in 2005 were recent arrivals.
Of the 35.7 million foreign born living in the United States in 2005, 32 percent (11,268,909) arrived in the 1990s and another 22 percent (8,023,516) arrived after 2000, although the shares varied by nationality group (see Figure 1). About 30 percent of the Indian born (421,259) and Guatemalan born (194,245) arrived in the last five years, compared with only 10 percent of the Vietnamese born (111,239).
|
|
||
|
Four of the top-five sending countries of recent arrivals to the United States saw the size of their U.S. communities more than double between 1990 and 2005.
The five largest foreign-born populations in the United States in 2005 were from Mexico, the Philippines, China and Hong Kong, India, and Vietnam. With the exception of the Philippines, more than 50 percent of each group arrived between 1990 and 2005 (see Figure 2).
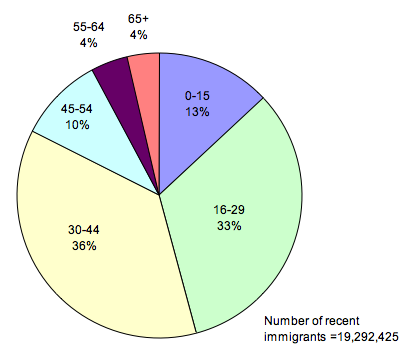
Eight in 10 recently arrived foreign born in 2005 were of working age.
In 2005, 83.4 percent (16,094,818) of the recently arrived foreign born were between the ages of 16 and 64 (see Figure 3). More than two-thirds of the recently arrived (69.7 percent) were between the ages of 16 and 44 (13,440,256) while only 3.6 percent (697,157) were over 65. Children under age 16 composed 13.0 percent (2,500,450) of recently arrived foreign born.
|
|
||
|
Among the recently arrived foreign born, men slightly outnumbered women.
The overall foreign-born population in the United States consists of nearly an even number of women (17,839,561) and men (17,930,042). However, 51.4 percent (9,913,334) of the recently arrived foreign born are men.
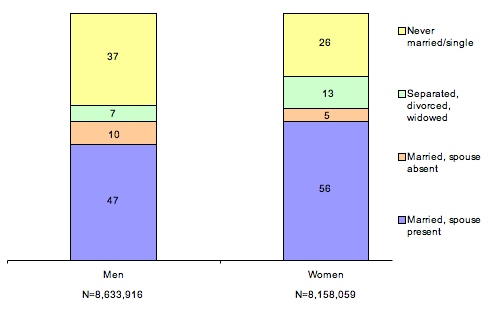
More than half of recently arrived foreign-born men and women age 16 and older were married in 2005.
Of the recently arrived foreign born, 56.5 percent (4,873,930) of men and 61.5 percent (5,019,593) of women age 16 and older were married. More than a third of men (3,199,191) were either never married or single (see Figure 4).
|
|
||
|
Recently arrived foreign-born women were more likely to be naturalized U.S. citizens than their male counterparts.
Among recently arrived foreign-born women, 21.7 percent (2,034,833) were naturalized citizens compared with 17.8 percent (1,764,360) of recently arrived foreign-born men.
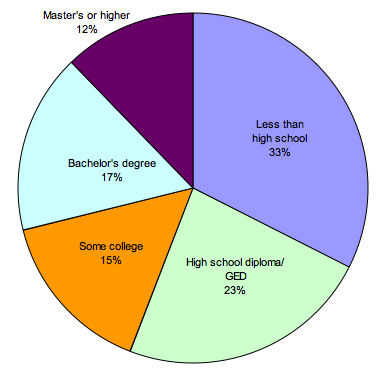
Forty-four percent of recent immigrants to the United States in 2005 completed at least some college.
Twenty-nine percent (3,863,114) of the recently arrived foreign born age 25 and older had a bachelor's degree or higher and 15 percent (2,068,366) completed some college. In contrast, 33 percent (4,351,901) had less than a high school education, while 23 percent (3,111,576) had a high school diploma or GED (see Figure 5).
|
|
||
|
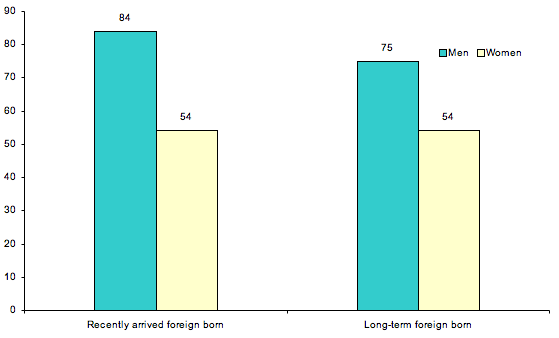
Nearly 84 percent of recently arrived foreign-born men were in the labor force.
In 2005, 83.9 percent (7,163,881) of recently arrived foreign-born men and 54.3 percent (4,432,917) of recently arrived foreign-born women, age 16 and older, were in the labor force (see Figure 6). The labor force participation rate for foreign-born men who arrived before 1990 (the long-term foreign born) was 74.9 percent (6,000,501), and the corresponding figure for women was still 54.3 percent (4,592,584).
|
|
||
|
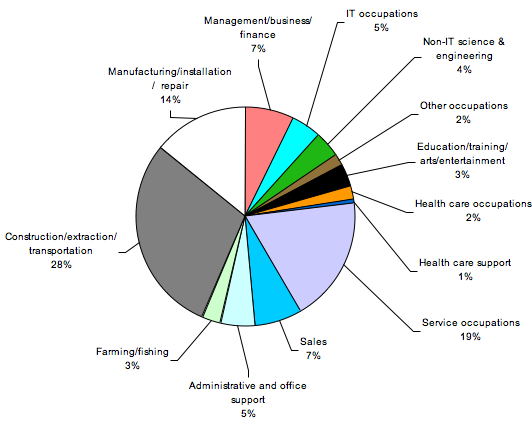
More than a quarter of recently arrived foreign-born men worked in construction, extraction, and transportation occupations.
Of recently arrived foreign-born men age 16 and older, the largest share, 29.4 percent (2,290,545), were in construction, extraction, and transportation occupations, followed by 18.6 percent (1,450,377) in service occupations and 14.2 percent (1,105,615) in manufacturing, installation, and repair occupations.
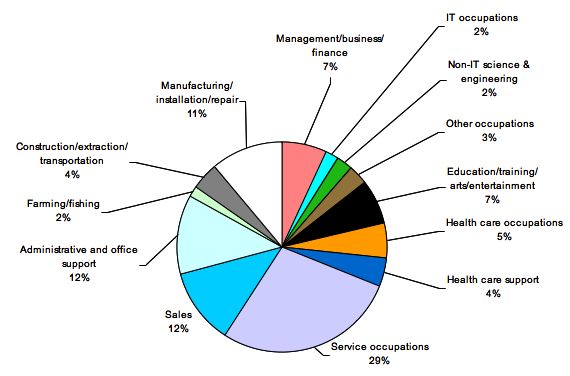
Among recently arrived foreign-born women age 16 and older, 28.2 percent (1,584,294) were in service occupations and 12.2 percent (682,569) were in administrative and office support.
In 2005, 10.8 percent of recently arrived foreign-born men (839,292) and 14.0 percent (786,603) of women were in information technology (IT) occupations, science and engineering, health care and health care support occupations (see Figures 7 and 8).
|
|
||
|
|
|
||
|
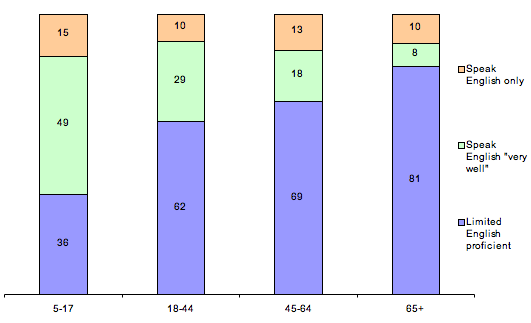
Younger immigrants were more than three times likely than older immigrants to speak English "very well" or better.
While 64 percent of recent immigrants age 5 to 17 either spoke only English or spoke it "very well," the corresponding figure for recent immigrants age 45 to 64 was 31 percent (see Figure 9). Among recent immigrants older than 65, only 18 percent spoke only English or spoke it "very well."
|
|
||
|
About the American Community Survey
These data are from the U.S. Census Bureau's 2005 American Community Survey (ACS). The ACS collects demographic, housing, social, and economic data every year for all states, as well as for all cities, counties, metropolitan areas, and population groups of 65,000 people or more. The 2005 ACS is based a sample of the U.S. population living in households but did not survey anyone living in group quarters such as college dormitories, prisons, or long-term care facilities.