
Immigrant-Origin Students in U.S. Higher Education: A Data Profile

Of the 19 million students at U.S. colleges and universities in 2018, 28 percent were either first-generation immigrants or the children of immigrants. Together, these immigrant-origin students play an important role in postsecondary enrollment across the country, accounting for 58 percent of the growth of the student population between 2000 and 2018. Examining the characteristics of this population can help institutions of higher education and state education policymakers as they pursue the goal of equipping students with the skills and knowledge to meet the changing demands of the U.S. and local economies.
Want More Nationwide and State Data?
Additional data on immigrant-origin and all postsecondary students, both nationwide and by state, can be found here:
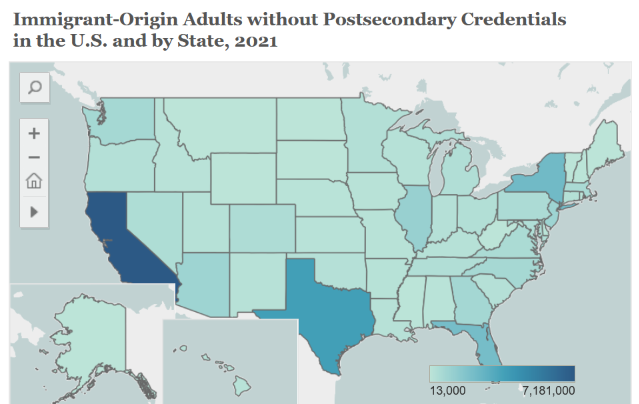
And to learn about immigrant-origin adults without a postsecondary credential, check out this data tool.
Using data from the U.S. Census Bureau and other sources, this fact sheet offers a first-of-its-kind profile of immigrant-origin students in higher education, focusing specifically on “domestic students” and excluding international students (those who come for the purpose of education) to get the best picture of those who are established U.S. residents and either current or future U.S. workers. This analysis looks at how this population has grown over time, the states in which they make up large numbers and shares of all students, characteristics such as race/ethnicity and immigration status, and enrollment trends.
Among the key findings of this analysis:
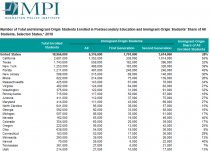
- The 5.3 million immigrant-origin students nationwide in 2018 were spread across traditional and newer immigrant-destination states. There were at least 20,000 such students in 32 states, and they made up more than 30 percent of students in nine states.
- Immigrant-origin students are a diverse group and accounted for notable shares of students who are racial and ethnic minorities. In 2018, they made up 85 percent of Asian American and Pacific Islander students, 63 percent of Latino students, and 24 percent of Black students, compared to 10 percent of White students.
- The vast majority of immigrant-origin students are U.S. citizens. As of 2018, 68 percent were citizens by birth and another 16 percent were citizens by naturalization.
1 Introduction
2 Demographic Profile of Immigrant-Origin Students
A. Population Size and Growth over Time
B. Race and Ethnicity
C. U.S. Citizenship and Legal Status for First-Generation Immigrant Students
3 Top States with Immigrant-Origin Students
4 Enrollment Characteristics
5 Conclusion

