

Indian Immigrants in the United States

A young girl celebrates the Indian festival of Diwali in California. (Photo: Jitze Couperus)
Indian migrants began arriving in the United States as early as 1820. Though few in number at the time, the Indian population has surged since the 1990s to become the second-largest immigrant group in the country after Mexicans, and ahead of those born in China, the Philippines, and Vietnam. As of 2013, more than 2 million Indian-born immigrants resided in the United States, accounting for 4.7 percent of the 41.3 million foreign-born population.
Similar to early Chinese and Japanese immigrants, Indian arrivals in the 19th century were largely unskilled and uneducated farmers. Most came to work in agriculture in California. The restrictive Immigration Acts of 1917 and 1924, which effectively banned immigration from Asia, brought the already low levels of migration from India to a halt. As of 1960, there were only 12,000 Indian immigrants in the United States, representing less than 0.5 percent of the 9.7 million foreign-born population at the time.
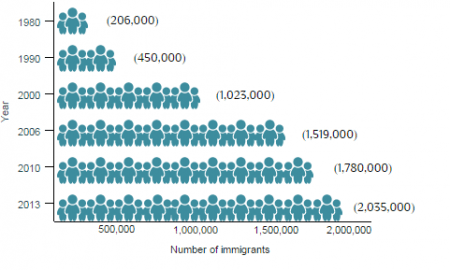
The 1965 Immigration and Nationality Act, which removed origin-country quotas and created employment-based immigration channels, as well as subsequent legislation emphasizing highly skilled immigration provided an entry pathway for a growing number of professionals and students from India. The Immigration Act of 1990, which further refined temporary skilled worker categories and increased the number of permanent work-based visas, contributed to a rapid increase in the size of the Indian-born population. In contrast to the initial wave, the majority of post-1965 arrivals from India were young, educated urban dwellers, with strong English language skills. From 1980 to 2013, the Indian immigrant population increased ten-fold, from 206,000 to 2.04 million, roughly doubling every decade (see Figure 1).
Today, Indian citizens are the top recipients of temporary high-skilled worker H-1B visas, accounting for 70 percent of the 316,000 H-1B petitions (initial and continuing employment) approved by U.S. Citizenship and Immigration Services (USCIS) in fiscal year (FY) 2014. India is also the second-largest sending country of international students to the United States after China: Close to 103,000 Indian-born students were enrolled in U.S. educational institutions in the 2013-14 school year.
|
Figure 1. Indian Immigrant Population in the United States, 1980-2013
|
|
Sources: Data from U.S. Census Bureau 2006, 2010, and 2013 American Community Surveys (ACS), and Campbell J. Gibson and Kay Jung, "Historical Census Statistics on the Foreign-born Population of the United States: 1850-2000" (Working Paper no. 81, U.S. Census Bureau, Washington, DC, February 2006), www.census.gov/population/www/documentation/twps0081/twps0081.html. |
There are 14.2 million Indian migrants worldwide; after the United Arab Emirates (2,852,000), the United States (2,061,000) is the second-most common destination. Other popular destinations include Saudi Arabia (1,762,000), Pakistan (1,396,000), Nepal (810,000), and the United Kingdom (756,000), according to mid-2013 estimates by the United Nations Population Division. Click here to view an interactive map showing where migrants from India and other countries have settled worldwide.
More than half of Indian immigrants in the United States obtain lawful permanent residence (also known as receiving a “green card”) through the employment-based preference. Compared to the overall foreign- and native-born populations, Indian immigrants are significantly higher educated, more likely to be employed, and have a higher household income.
Using data from the U.S. Census Bureau (the most recent 2013 American Community Survey [ACS], pooled 2009-13 ACS data, and the 2014 Current Population Survey [CPS]), the Department of Homeland Security’s Yearbook of Immigration Statistics, and the World Bank's annual remittance data, this Spotlight provides information on the Indian immigrant population in the United States, focusing on its size, geographic distribution, and socioeconomic characteristics.
|
Definitions
|
|
|
Click on the bullet points below for more information:
- Distribution by State and Key Cities
- English Proficiency
- Educational and Professional Attainment
- Income and Poverty
- Immigration Pathways and Naturalization
- Health Coverage
- Diaspora
- Remittances
Distribution by State and Key Cities
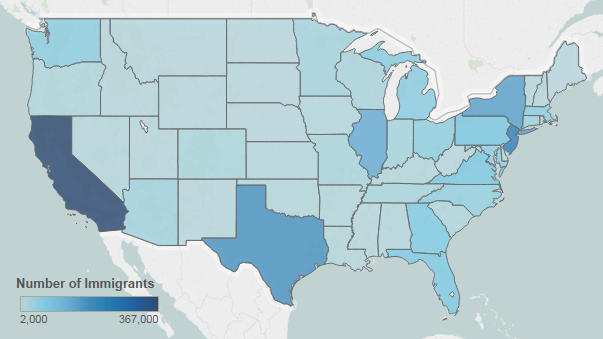
The largest populations of Indian immigrants have settled in California (19 percent), New Jersey (11 percent), and Texas (9 percent). The top four counties with Indian immigrants in the 2009-13 period were Santa Clara County in California, Middlesex County in New Jersey, Cook County in Illinois, and Alameda County in California. Together, these four counties accounted for about 15 percent of the total Indian immigrant population in the United States.
|
Figure 2. Top Destination States for Indian Immigrants in the United States, 2009-13
|
|
Source: Migration Policy Institute (MPI) tabulation of data from U.S. Census Bureau pooled 2009-13 ACS. |
Click here for an interactive map that shows the geographic distribution of immigrants by state and county. Select India from the dropdown menu to see which states and counties have the most Indian immigrants.
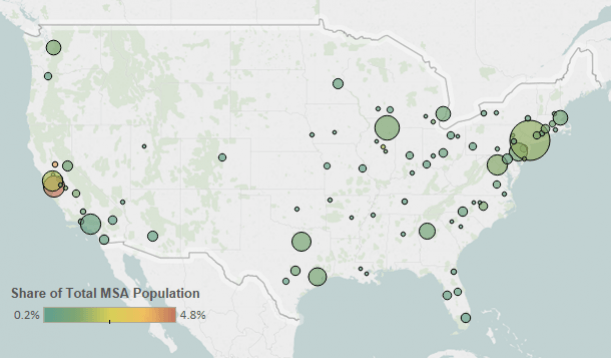
In the 2009-13 period, the U.S. cities with the largest number of Indian immigrants were the greater New York City, Chicago, and San Jose metropolitan areas. These three metropolitan areas accounted for about 27 percent of Indian immigrants in the United States.
|
Figure 3. Top Metropolitan Destinations for Indian Immigrants in the United States, 2009-13
|
|
Note: Pooled 2009-13 ACS data were used to get statistically valid estimates at the metropolitan statistical-area level for smaller-population geographies. |
|
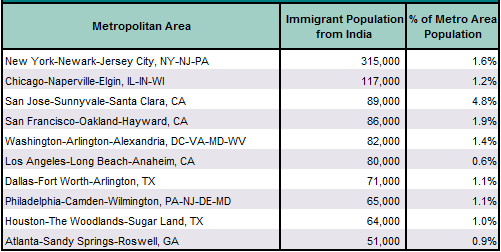
Table 1. Top Concentrations by Metropolitan Area for the Foreign Born from India, 2009-13
|
|
Source: MPI tabulation of data from the U.S. Census Bureau pooled 2009-13 ACS. |
Click here for an interactive map that highlights the metropolitan areas with the highest concentrations of immigrants. Select India from the dropdown menu to see which metropolitan areas have the most Indian immigrants.
Indian immigrants were much more likely to be proficient in English and speak English at home than the overall foreign-born population. In 2013, only 26 percent of Indian immigrants (ages 5 and over) reported limited English proficiency, compared to 50 percent of the total foreign-born population. Approximately 10 percent of Indian immigrants spoke only English at home (versus 16 percent of all immigrants), while the rest spoke a variety of languages, including Hindi, Gujarati, Telugu, Panjabi, and Tamil (the top five languages spoken by this population).
Note: Limited English proficiency refers to those who indicated on the ACS questionnaire that they spoke English less than “very well.”
Educational and Professional Attainment
Indian immigrants tend to have much higher educational attainment compared to both the foreign- and native-born populations. In 2013, 76 percent of Indian immigrants (ages 25 and over) had a bachelor’s degree or higher, compared to 28 percent of all immigrants over 25 and 30 percent of native-born adults. Notably, among college-educated Indian immigrants, more than half had a graduate or professional degree. Indian students accounted for 14 percent of all temporary visa holders earning doctorates at U.S. colleges and universities, with the majority (84 percent) intending to stay in the United States after receiving their degrees, according to the National Science Foundation’s Survey of Earned Doctorates.
The Indian immigrant population was younger than the overall foreign-born population and older than the native-born population. The median age of Indian immigrants was 39 years—compared to 43 for all foreign born and 36 for native born. In 2013, 83 percent of Indian immigrants were of working age (18 to 64), 11 percent were ages 65 and over, and 6 percent were under 18. In comparison, 80 percent of all foreign born in the United States were of working age, 14 percent were 65 and over, and 6 percent were under 18. Meanwhile, 60 percent of the native-born population was of working age, 14 percent was 65 and over, and 26 percent was under 18.
Click here to view an interactive chart showing the age and sex distribution of the top origin immigrant groups, including those from India.
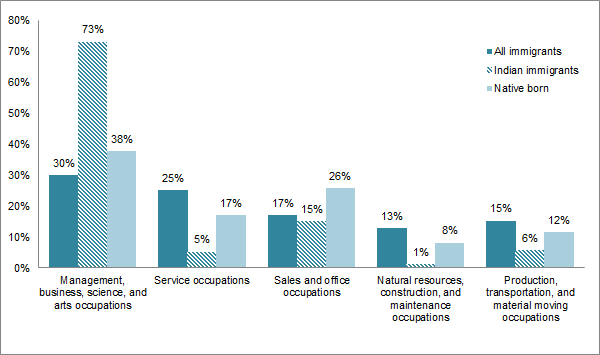
Indian immigrants participated in the labor force at a slightly higher rate than the overall immigrant and native-born populations. In 2013, about 70 percent of Indian immigrants ages 16 and over were in the civilian labor force, compared to 67 percent and 63 percent of the total foreign- and native-born populations, respectively. Indian immigrants were more than twice as likely to be employed in management, business, science, and arts occupations (73 percent) than both the overall foreign-born (30 percent) and native-born (38 percent) populations.
|
Figure 4. Employed Workers in the Civilian Labor Force (ages 16 and older) by Occupation and Origin, 2013
|
|
Source: MPI tabulation of data from the U.S. Census Bureau 2013 ACS. |
Indian immigrants have much higher incomes compared to the total foreign- and native-born populations. In 2013, the median income of households headed by an Indian immigrant was $103,000, compared to $48,000 and $53,000 for overall immigrant and native-born households, respectively.
In 2013, only 6 percent of Indian immigrants lived in poverty, a much lower rate than both the total immigrant (19 percent) and native-born populations (15 percent).
Immigration Pathways and Naturalization
In 2013, similar to the overall foreign-born population, 47 percent of the 2 million Indian immigrants residing in the United States were naturalized U.S. citizens.
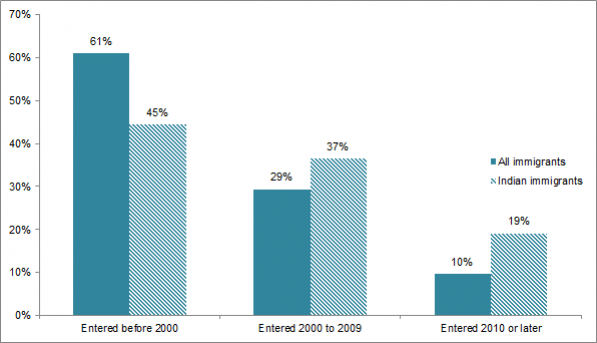
Indian immigrants were more likely to have entered the United States since 2000 than the overall immigrant population, as Figure 5 shows. Less than half of Indian immigrants (45 percent) arrived prior to 2000, followed by 37 percent who arrived between 2000 and 2009, and 19 percent in 2010 or later.
|
Figure 5. Immigrants from India and All Immigrants in the United States by Period of Arrival, 2013
|
|
Note: Numbers may not add up to 100 as they are rounded to the nearest whole number. |
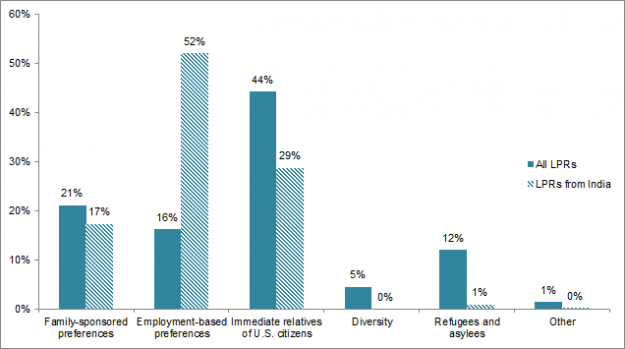
After China, India is the second-largest country of origin among new lawful permanent residents (LPRs): More than 68,000 or 7 percent of the 991,000 new green-card holders in FY 2013 were from India. More than half of Indian immigrants become LPRs via employment pathways (52 percent), compared to only 16 percent among the total LPR population (see Figure 6). Indian immigrants were less likely to gain green cards as immediate relatives of U.S. citizens (29 percent, compared to 44 percent for all LPRs), or through family-sponsored preferences (17 percent, compared to 21 percent).
|
Figure 6. Immigration Pathways of Indian Immigrants and All Immigrants in the United States, 2013
|
|
Notes: Family-sponsored: Includes adult children and siblings of U.S. citizens as well as spouses and children of green-card holders. Immediate relatives of U.S. citizens: Includes spouses, minor children, and parents of U.S. citizens. Diversity Visa Lottery: The Immigration Act of 1990 established the Diversity Visa (DV) Lottery to allow entry to immigrants from countries with low rates of immigration to the United States. The law states that 55,000 diversity visas in total are made available each fiscal year. Indian nationals are ineligible to participate in the DV Lottery. |
Although the vast majority of Indian immigrants in the United States are legally present, there were approximately 284,000 unauthorized Indian immigrants in the 2009-13 period, according to MPI estimates, comprising around 2.6 percent of the total 11 million unauthorized in the United States. MPI’s 2014 estimates suggested that approximately 11,000 Indian youth were immediately eligible for the 2012 Deferred Action for Childhood Arrivals (DACA) program. However, as of December 31, 2014 (the latest data available from the U.S. government), only 3,349 Indian youth had applied for the DACA program, and 2,814 had been approved.
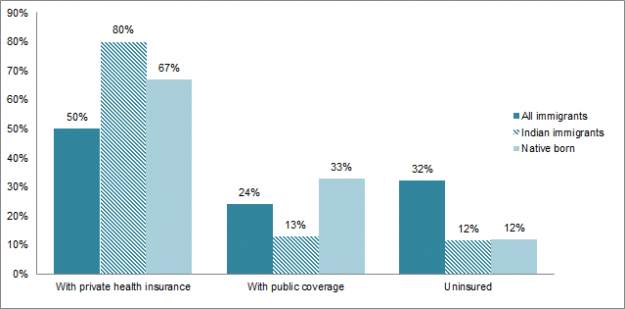
Indian immigrants were as likely as the native-born population to be uninsured (12 percent), but much less likely to be uninsured than the overall immigrant population (32 percent). Indian immigrants were more likely to have private health insurance (80 percent) than both the total foreign- and native-born populations (50 percent and 67 percent, respectively).
|
Figure 7. Health Coverage for Indian Immigrants, All Immigrants, and the Native Born, 2013
|
|
Note: The sum of shares by type of insurance is likely to be greater than 100 because people may have more than one type of insurance. |
The Indian diaspora population in the United States is comprised of approximately 3.8 million individuals who were either born in India or reported Indian ancestry or race, according to tabulations from the U.S. Census Bureau 2013 ACS.
Click here to read an in-depth profile of the Indian diaspora in the United States.
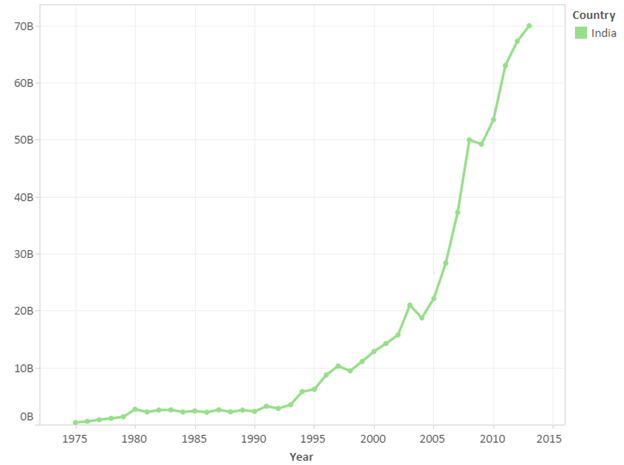
Global remittances sent to India via formal channels equaled nearly USD $70 billion in 2013, though this represented less than 4 percent of the country’s gross domestic product (GDP), according to data from the World Bank. Remittances sent to India have seen an 11-fold increase since 1995.
|
Figure 8. Annual Remittance Flows to India, 1975-2013
|
|
Source: MPI tabulations of data from the World Bank Prospects Group, “Annual Remittances Data,” October 2014 update. |
Visit the Data Hub’s collection of interactive remittances tools, which track remittances by inflow and outflow, between countries, and over time.
Click here to read an article about the rise in remittances to India.
Sources
Batalova, Jeanne, Sarah Hooker, and Randy Capps with James D. Bachmeier. 2014. DACA at the Two-Year Mark: A National and State Profile of Youth Eligible and Applying for Deferred Action. Washington, DC: Migration Policy Institute. Available Online.
Department of Homeland Security (DHS), Office of Immigration Statistics. 2014. 2013 Yearbook of Immigration Statistics. Washington, DC: DHS Office of Immigration Statistics. Available Online.
Gibson, Campbell J. and Kay Jung. 2006. Historical Census Statistics on the Foreign-born Population of the United States: 1850-1990. Working Paper No. 81, U.S. Census Bureau, Washington, DC, February 2006. Available Online.
Gonzales Jr., Juan L. 1986. Asian Indian Immigration Patterns: The Origins of the Sikh Community in California. International Migration Review, 20 (1): 40-54.
Institute of International Education. 2014. Open Doors 2014. Washington, DC: Institute of International Education.
Jacoby, Harold S. 1979. Some Demographic and Social Aspects of Early East Indian Life in the United States. In Sikh Studies: Comparative Perspectives on a Changing Tradition, eds. Mark Juergensmeyer and N. Gerald Barrier. Berkeley, CA: Graduate Theological Union: 159-71.
National Science Foundation (NSF) and the National Center for Science and Engineering Statistics (NCSES). 2014. Doctorate Recipients from U.S. Universities: 2013. Arlington, VA: NSF and NCSES, December 2014. Available Online.
Naujoks, Daniel. 2009. Emigration, Immigration, and Diaspora Relations in India. Migration Information Source, October 15, 2009. Available Online.
United Nations Population Division. 2013. International migrant stock by destination and origin. Available Online.
U.S. Census Bureau. 2013. 2013 American Community Survey. American FactFinder. Available Online.
---. 2010. 2008-2012 ACS. Accessed from Steven Ruggles, J. Trent Alexander, Katie Genadek, Ronald Goeken, Matthew B. Schroeder, and Matthew Sobek. Integrated Public Use Microdata Series: Version 5.0 [Machine-readable database]. Minneapolis: University of Minnesota, 2010. Available Online.
U.S. Citizenship and Immigration Services (USCIS). 2015. Characteristics of H-1B Specialty Occupation Workers: Fiscal Year 2014 Annual Report to Congress. Washington, DC: USCIS. Available Online.
---. Citizenship Through Naturalization. Last updated January 22, 2013. Available Online.
---. 2015. Deferred Action for Childhood Arrivals Process (Through Fiscal Year 2015, 1st Qtr), January 2015. Available Online.
U.S. Department of State, Bureau of Consular Affairs. N.d. Nonimmigrant Visa Issuances by Visa Class and by Nationality, FY 2013. Available Online.
World Bank Prospects Group. 2013. Annual Remittances Data, October 2014 update. Available Online.