

Korean Immigrants in the United States

Korean women perform in the annual Korean Day Parade in New York City, which has one of the highest concentrations of Koreans in the United States. (Photo: Young Sok Yun)
Historically, Korean immigration to the United States has been driven by political, economic, and military relations between the two countries, opening up after restrictions on immigration from Asia to the United States were lifted in 1965. In 2015, approximately 1 million Korean immigrants (overwhelmingly from South Korea) resided in the United States, representing 2.4 percent of the 43.3 million U.S. immigrants.
The number of Korean immigrants in the United States grew rapidly after the Immigration Act of 1965 removed restrictions on Asian migration: The population increased seven-fold from 39,000 in 1970 to 290,000 in 1980, then nearly doubled to 568,000 in 1990 and again to 1.1 million in 2010 (see Figure 1). While the earlier waves consisted largely of unskilled laborers and their families, contemporary Korean immigration boasts high socioeconomic standing and Koreans are generally considered among the most successful immigrant groups.
In recent years, the Korean immigrant population in the United States has been stagnant. As economic and political conditions in South Korea have improved, fewer people have been interested in emigrating. Between 2010 and 2015, the Korean population in the United States decreased slightly from 1.1 million to 1 million (or by about 4 percent). The number of Korean students enrolling in U.S. higher education institutions also dropped 4 percent, from 64,000 in school year (SY) 2014-15 to 61,000 in SY 2015-16. While South Korean students used to represent the third largest group of international students, they were surpassed in SY 2015-16 by students from Saudi Arabia (61,300). At the same time, some immigrants have returned to South Korea to take advantage of economic and business opportunities, particularly as the country makes an effort to court return migration.
Figure 1. Korean Immigrant Population in the United States, 1980-2015
Source: Data from U.S. Census Bureau 2006, 2010, and 2015 American Community Surveys (ACS), and Campbell J. Gibson and Kay Jung, "Historical Census Statistics on the Foreign-born Population of the United States: 1850-2000" (Working Paper no. 81, U.S. Census Bureau, Washington, DC, February 2006), available online.
However, in 2015 the United States was still home to the largest South Korean immigrant population in the world, followed by Japan (522,000), China (187,000), and Canada (144,000). Meanwhile, the majority of North Korean emigrants lived in Kazakhstan (62,000), the United Kingdom (19,000), Russia (11,000), and the Philippines (6,000), according to mid-2015 estimates by the United Nations Population Division. Click here to view an interactive map showing where migrants from the Korean peninsula and elsewhere have settled worldwide.
Most Korean immigrants (from either South or North Korea) who obtain lawful permanent residence in the United States (also known as receiving a green card) qualify through employment sponsorship or as immediate relatives of U.S. citizens. Compared to the total foreign-born population, Korean immigrants had higher education and income levels, experienced less poverty, and were less likely to lack health insurance, but were more likely to be Limited English Proficient (LEP).
Using data from the U.S. Census Bureau (the most recent 2015 American Community Survey [ACS] as well as pooled 2011-15 ACS data), the Department of Homeland Security Yearbook of Immigration Statistics, and World Bank annual remittance data, this Spotlight provides information on the Korean immigrant population in the United States, focusing on its size, geographic distribution, and socioeconomic characteristics.
Click on the bullet points below for more information:
- Distribution by State and Key Cities
- English Proficiency
- Age, Education, and Employment
- Income and Poverty
- Immigration Pathways and Naturalization
- Unauthorized Immigrants
- Health Coverage
- Diaspora
- Remittances
Distribution by State and Key Cities
As of 2011-15, almost half of all Korean immigrants resided in three states: California (31 percent), New York (9 percent), and New Jersey (7 percent). The top four counties with Korean immigrants were Los Angeles County and Orange County in California, Queens County in New York, and Bergen County in New Jersey. Together, the four counties accounted for about 29 percent of the total Korean immigrant population in the United States.
Figure 2. Top Destination States for Korean Immigrants in the United States, 2011-15
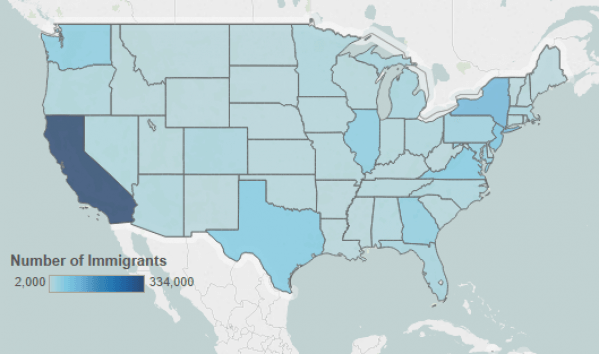
Note: Pooled 2011-15 ACS data were used to get statistically valid estimates at the state and metropolitan statistical area levels, for smaller-population geographies. Not shown are populations in Alaska and Hawaii, which are small in size; for details, visit the Migration Policy Institute (MPI) Data Hub for an interactive map showing geographic distribution of immigrants by state and county, available online.
Source: MPI tabulation of data from U.S. Census Bureau pooled 2011-15 ACS.
Click here for an interactive map that shows the geographic distribution of immigrants by state and county. Select Korea from the dropdown menu to see which states and counties have the highest distributions of Korean immigrants.
In the 2011-15 period, the U.S. cities with the greatest number of Korean immigrants were the Los Angeles, New York, and Washington, DC metropolitan areas, accounting for 40 percent of Korean immigrants.
Figure 3. Top Destination Metropolitan Areas for Korean Immigrants in the United States, 2011-15
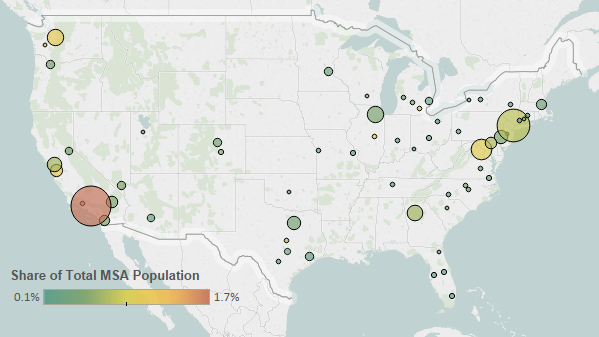
Source: MPI tabulation of data from the U.S. Census Bureau pooled 2011-15 ACS.
Table 1. Top Concentrations by Metropolitan Area for the Foreign Born from Korea, 2011-15
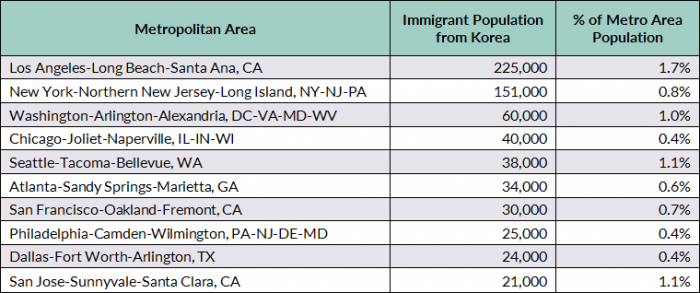
Source: MPI tabulation of data from the U.S. Census Bureau pooled 2011-15 ACS.
Click here for an interactive map that highlights the metropolitan areas with the highest concentrations of immigrant groups. Select Korea from the dropdown menu to see which metropolitan areas have the highest concentrations of Korean immigrants.
In 2015, about 52 percent of Korean immigrants (ages 5 and older) reported limited English proficiency, compared to 49 percent of the overall foreign-born population. However, Korean immigrants were slightly more likely to speak only English at home (18 percent) than U.S. immigrants overall (16 percent).
Note: Limited English proficiency refers to those who indicated on the ACS questionnaire that they spoke English less than “very well.”
Age, Education, and Employment
Korean immigrants have much higher educational attainment than the overall foreign- and native-born populations. In 2015, more than half (53 percent) of Korean immigrants ages 25 and over had a bachelor’s degree or higher, compared to 29 percent of the total U.S. foreign-born population and 31 percent of the native-born population.
The Korean immigrant population was older than the overall U.S. immigrant population and the native-born population. The median age of Korean immigrants was 46 years, compared to 44 for the foreign-born population overall and 36 for the native-born population. In 2015, 77 percent of Korean immigrants were of working age (18 to 64), a slightly lower share than among the overall foreign-born population (80 percent) but higher than the native-born population (60 percent; see Table 2).
Table 2. Age Distribution by Origin, 2015
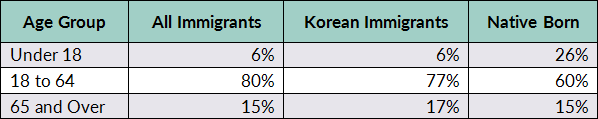
Source: MPI tabulation of data from the U.S. Census Bureau 2015 ACS.
Korean immigrants participate in the labor force at a lower rate than the overall immigrant and native-born populations. In 2015, about 60 percent of Korean immigrants (ages 16 and over) were in the civilian labor force, compared to 66 percent and 62 percent of the overall foreign-born and native-born populations, respectively. Lower workforce participation by Korean women (52 percent, versus 70 percent for Korean men) is one reason behind the lower rate.
More than half of Korean immigrants were employed in management, business, science, and arts occupations (51 percent), a level significantly higher than the overall foreign- and native-born populations. Koreans were also much less likely to be employed in natural resources, construction, and maintenance occupations (3 percent) or production, transportation, and material moving occupations (8 percent) compared to the other two groups (see Figure 4).
Figure 4. Employed Workers in the Civilian Labor Force (ages 16 and Older) by Occupation and Origin, 2015
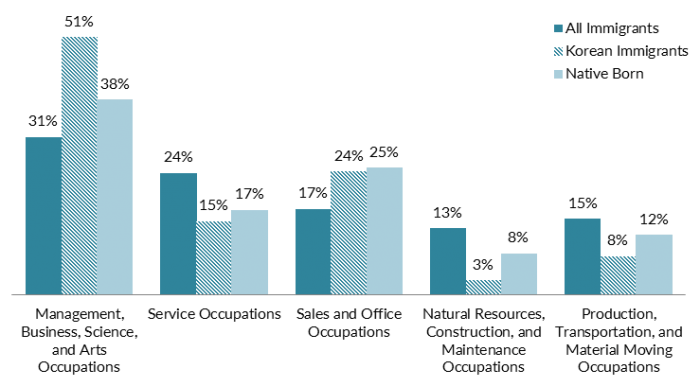
Source: MPI tabulation of data from the U.S. Census Bureau 2015 ACS.
Korean immigrants had higher incomes than the total foreign- and native-born populations. In 2015, median household income among Korean immigrants was $62,000, compared to $51,000 and $56,000 for the immigrant and native-born populations, respectively.
Korean immigrants were less likely than the overall foreign-born population to experience poverty. In 2015, 14 percent of Korean immigrants lived in poverty (the same rate as for the U.S. born), compared to 17 percent for the overall foreign-born population.
Immigration Pathways and Naturalization
In 2015, 61 percent of the 1 million Korean immigrants in the United States were naturalized U.S. citizens—a share much higher than the 48 percent share for the overall foreign-born population.
Korean immigrants were more likely than immigrants overall to have entered the United States before 2000. Most Korean immigrants (63 percent) arrived before 2000, followed by 24 percent who arrived between 2000 and 2009, and 14 percent in 2010 and after. Meanwhile, 57 percent of all immigrants in the United States arrived prior to 2000 (see Figure 5).
Figure 5. Korean Immigrants and All Immigrants in the United States by Period of Arrival, 2015
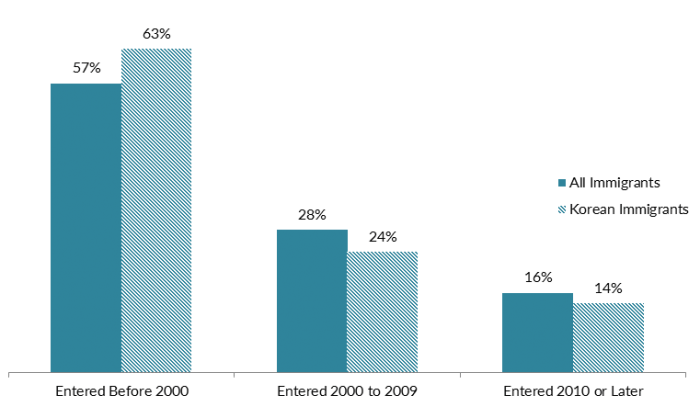
Source: MPI tabulation of data from the U.S. Census Bureau 2015 ACS.
In fiscal year (FY) 2015, the majority of the 17,000 Korean immigrants who became lawful permanent residents (LPRs) in the United States were sponsored by employers (56 percent) or immediate relatives of U.S. citizens (38 percent). Virtually no Koreans became LPRs in 2015 via the Diversity Visa Lottery or as refugees.
Figure 6. Immigration Pathways of Korean Immigrants and All Immigrants in the United States, 2015
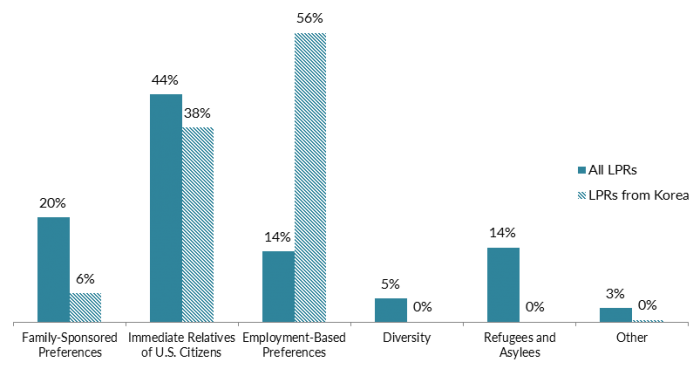
Notes: Family-sponsored: Includes adult children and siblings of U.S. citizens as well as spouses and children of green-card holders. Immediate relatives of U.S. citizens: Includes spouses, minor children, and parents of U.S. citizens. Diversity Visa Lottery: The Immigration Act of 1990 established the Diversity Visa Lottery to allow entry to immigrants from countries with low rates of immigration to the United States. The law states that 55,000 diversity visas are made available each fiscal year. Nationals of North Korea are eligible to apply for the diversity visa, but nationals of South Korea are not.
Source: MPI tabulation of data from Department of Homeland Security (DHS), 2015 Yearbook of Immigration Statistics (Washington, DC: DHS Office of Immigration Statistics, 2016), available online.
Approximately 198,000 Korean immigrants resided in the United States without authorization in the 2010-14 period, representing 2 percent of the total 11 million unauthorized population, according to MPI estimates.
Click here for an interactive data tool showing top states and counties of residence for unauthorized immigrants in the United States by country or region of origin.
Furthermore, as of 2016, an estimated 52,000 unauthorized youth from Korea were eligible for work authorization and relief from deportation through the Deferred Action for Childhood Arrivals (DACA) program, launched in 2012. At the end of September 2016, 7,693 South Korean unauthorized youth had applied for the program and a total of 7,069 petitions had been approved, according to the most recent data available from U.S. Citizenship and Immigration Services.
Click here for two interactive data tools showing estimates of DACA-eligible unauthorized immigrant populations for top states and counties, and application rates by country of origin.
In 2015, Korean immigrants were less likely to be uninsured (13 percent) than the overall immigrant population (22 percent). In terms of the source of coverage, Korean immigrants and the native born were covered by private health insurance at the same rate (69 percent), but Korean immigrants were less likely than both the native- and foreign-born populations to have public coverage (see Figure 7).
Figure 7. Health Insurance Coverage by Origin, 2015
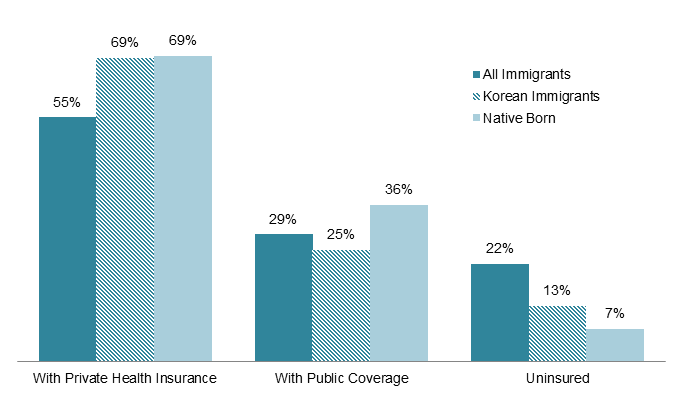
Note: The sum of shares by type of insurance is likely to be greater than 100 because people may have more than one type of insurance.
Source: MPI tabulation of data from the U.S. Census Bureau 2015 ACS.
In addition to the 1 million immigrants born in Korea who now reside in the United States, an almost equal number (900,000) were born outside of Korea (including in the United States) but report Korean ancestry. Together, the two groups comprise the 1.9 million Korean diaspora in the United States, according to tabulations from the U.S. Census Bureau 2015 ACS.
Global remittances sent to South Korea via formal channels equaled $6.5 billion in 2015, down slightly from $6.6 billion in 2014, about 0.5 percent of the country’s gross domestic product (GDP). Remittances received by the South Koreans have nearly tripled since 1990, according to data from the World Bank. In 2015, the United States was the top source of remittances sent to South Korea, sending $2.9 billion to the country.
Figure 8. Annual Remittance Flows to South Korea, 1970-2014
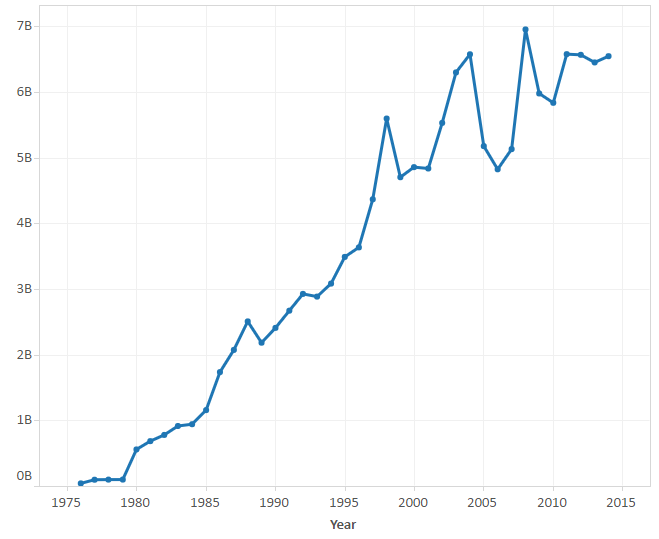
Source: MPI tabulations of data from the World Bank Prospects Group, “Annual Remittances Data,” April 2016 update.
Visit the Data Hub’s collection of interactive remittances tools, which track remittances by inflow and outflow, between countries, and over time.
Sources
Department of Homeland Security (DHS), Office of Immigration Statistics. 2016. 2015 Yearbook of Immigration Statistics. Washington, DC: DHS Office of Immigration Statistics. Available online.
Gibson, Campbell J. and Kay Jung. 2006. Historical Census Statistics on the Foreign-born Population of the United States: 1850-2000. Working Paper no. 81, U.S. Census Bureau, Washington, DC, February 2006. Available online.
Institute of International Education (IIE). 2016. Open Doors Report on International Educational Exchange. Washington, DC: IIE. Available online.
U.S. Census Bureau. 2016. 2015 American Community Survey. American FactFinder. Available online.
---. 2010. 1850-2000 Decennial Census and 2000-2015 ACS. Accessed from Steven Ruggles, J. Trent Alexander, Katie Genadek, Ronald Goeken, Matthew B. Schroeder, and Matthew Sobek, Integrated Public Use Microdata Series: Version 5.0 [Machine-readable database]. Minneapolis: University of Minnesota, 2016. Available online.
U.S. Citizenship and Immigration Services (USCIS). 2016. Number of I-821D, Consideration of Deferred Action for Childhood Arrivals by Fiscal Year, Quarter, Intake, Biometrics and Case Status: 2012-2016 (September 30). Available online.
World Bank Prospects Group. 2016. Annual Remittances Data, April 2016 update. Available online.