

Refugees and Asylees in the United States

Refugees from conflict in the eastern Democratic Republic of the Congo leave the Nyakabande transit camp in Uganda. (Photo: Andy Wheatley/DFID)
The United States has historically led the world in terms of formal refugee resettlement, accepting more refugees annually than any other country. With significant cuts in refugee admissions by the Trump administration, however, the United States fell behind Canada in 2018 as the top resettlement country. Approximately 22,500 refugees were resettled in the United States during fiscal year (FY) 2018. Beyond accepting refugees for resettlement, the United States also grants humanitarian protection to asylum seekers who present themselves at U.S. ports of entry or claim asylum from within the country; in FY 2017 (the most recent data available), the United States granted asylum status to 26,568 individuals.
Global displacement reached a record high of 68.5 million people by the end of 2017, according to the United Nations High Commissioner for Refugees (UNHCR). Approximately 25.4 million of these individuals were formally designated as refugees, 40 million were internally displaced persons (IDPs), and 3.1 million were asylum seekers.
In 2017, the Trump administration implemented increased vetting for refugees, citing security concerns; this slowed the process of admissions. Furthermore, President Trump reduced the number of refugees the United States accepts annually—first reducing the 110,000 level originally set for FY 2017 by the Obama administration to 50,000, then to 45,000 for FY 2018, and to a record low of 30,000 for FY 2019. Approximately 15,000 refugees had been resettled during the first seven months of FY 2019 (October 1, 2018 through April 30, 2019).
Using the most recent data available, including refugee arrival figures from the State Department and asylum data from the Department of Homeland Security’s 2017 Yearbook of Immigration Statistics, this Spotlight examines characteristics of the U.S. refugee and asylee populations, including top countries of origin and top states for resettled refugees. It also provides the numbers of refugees and asylees who have become lawful permanent residents (LPRs), which refugees (but not asylees) are required to do within a year of arrival.
Note: All yearly data are for the government's fiscal year (October 1 through September 30).
Click on the bullet points below for more information:
- Refugee Admission Ceiling
- Refugee Arrivals and Countries of Origin
- Top Refugee-Receiving States
- Religious Composition of Refugees
- Age and Gender for Top Refugee Groups
- Asylees
- Adjusting to Lawful Permanent Resident Status
At the beginning of each fiscal year, the president, in consultation with Congress, sets caps on the number of refugees to be accepted from five global regions, as well as an unallocated reserve if a country goes to war or more refugees need to be admitted regionally. In the case of an unforeseen emergency, the total and regional allocations may be adjusted.
Once granted U.S. protection, refugees and asylees are authorized to work. They may also qualify for assistance, including cash, medical, housing, educational, and vocational services, to facilitate their economic and social integration.
After the most recent peak annual refugee admissions ceiling of 142,000 in 1993 (largely a response to the Balkan wars) the annual ceiling steadily declined, ranging from 70,000 to 91,000 between 1999 and 2016. In response to the worsening global humanitarian crisis, the Obama administration raised the admission ceiling to 85,000 in FY 2016 and 110,000 in FY 2017. (Click here for a data tool showing annual refugee resettlement ceilings and actual admissions from 1980, when the modern refugee resettlement program formally began, through the most recent full fiscal year.)
However, the Trump administration has significantly lowered the admissions ceiling each year and suspended the resettlement program for 120 days in 2017 to review and strengthen vetting procedures. The Department of Homeland Security (DHS) announced additional screening for nationals of 11 high-risk countries in January 2018. These countries were never officially delineated but are believed to be Egypt, Iran, Iraq, Libya, Mali, North Korea, Somalia, South Sudan, Sudan, Syria, and Yemen. Refugee admissions from these countries fell from 43 percent of all refugee resettlement in FY 2017 to 3 percent in FY 2018.
Figure 1. Annual Refugee Resettlement Ceiling and Number of Refugees Admitted, FY 1980-2019*
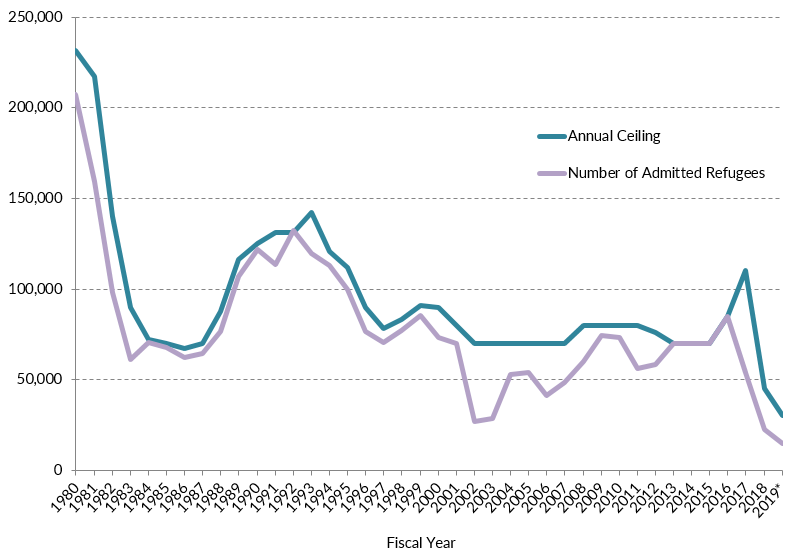
* Data for FY 2019 are partial and refer to resettlement between October 1, 2018 and April 30, 2019.
Sources: U.S. Department of State, Bureau of Population, Refugees, and Migration, “Proposed Refugee Admissions for Fiscal Year,” various years; Migration Policy Institute (MPI) analysis of Worldwide Refugee Admissions Processing System (WRAPS) data from the State Department, Bureau of Population, Refugees, and Migration, available online.
Click here for a fact sheet on U.S. refugee resettlement.
Click here for an explainer on the Trump administration’s immigration policy during its first two years, including with regards to refugee and asylum policy.
Refugee Arrivals and Countries of Origin
In 2018, 22,491 individuals arrived in the United States as refugees, according to data from the State Department’s Worldwide Refugee Admissions Processing System (WRAPS). This represents a 58 percent decrease from the 53,716 admitted in 2017 (see Figure 2). It also represents just half of the 45,000 placements allotted for 2018—a 74 percent decrease in admissions from the final year of the Obama administration (84,994 in 2016). In the first seven months of the2019 fiscal year, 14,808 refugees were admitted.
About three-quarters of the refugees admitted in the first seven months of FY 2019 were from Africa or East Asia.
Figure 2. U.S. Refugee Arrivals by Region of Nationality, FY 2000-19*
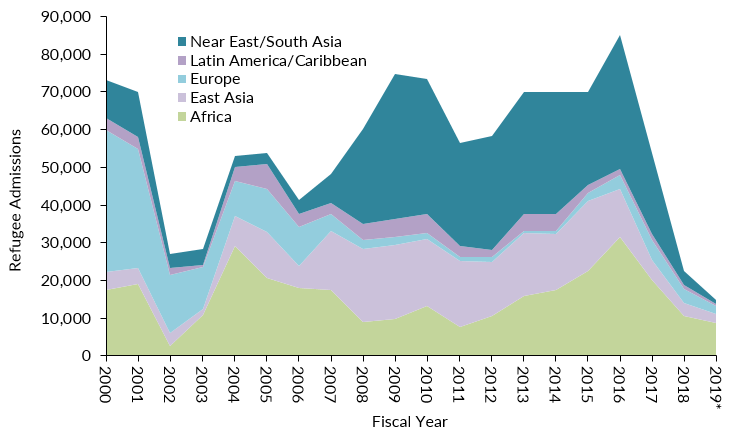
* Data for FY 2019 are partial and refer to resettlement between October 1, 2018 and April 30, 2019. Notes: Eligible family members granted follow-to-join refugee status are included in the refugee admissions data. In contrast, Special Immigrant Visa (SIV) recipients who received refugee program reception and placement benefits are not included.
Source: MPI analysis of State Department WRAPS data.
Nationals of the Democratic Republic of Congo (DRC) and Burma (also known as Myanmar) were the top two origin groups for the first seven months of FY 2019; they represented 64 percent (9,478 individuals) of all arrivals (see Table 1). Congolese refugees are fleeing decades of armed conflict that has killed more people than any war since World War II. Tens of thousands of the ethnic Chin, Karen, and more recently Muslim Rohingya, who have fled severe persecution at the hands of their own government were resettled in the United States, making Burma the second-largest origin country of refugees. Nationals of Ukraine were the third-largest group, representing 12 percent of all arrivals during the first seven months of FY 2019.
Table 1. Top Ten Origin Countries of Refugee Arrivals, FY 2017-19*
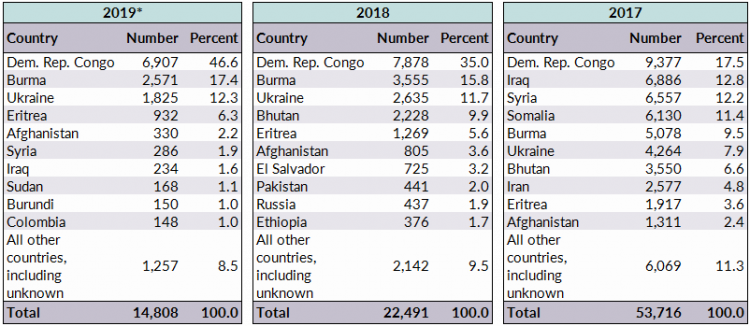
*Data for FY 2019 are partial and refer to resettlement between October 1, 2018 and April 30, 2019.
Source: MPI analysis of State Department WRAPS data.
Click here to read an article on Syrian refugees resettled in the United States.
Over the past decade, refugees from Burma have been the largest group resettled to the United States, representing 21 percent (138,861) of the 648,482 refugees admitted between FY 2009 and through April 30, 2019. Iraqis were next at 20 percent (127,478 individuals), followed by the Bhutanese at 14 percent (90,841 refugees). In 2014, UNHCR closed its resettlement program in Thailand for refugees from Burma. Later, in 2018, it did the same in Nepal. The closures dramatically stemmed the flow of Burmese and Bhutanese refugees who relied on these programs for resettlement. Between 2016 and 2017, 59 percent fewer refugees arrived from Burma. And although flows from Bhutan have been slowly decreasing for a decade, just 19 Bhutanese refugees had been admitted in the first seven months of FY 2019.
Figure 3. Number of Admitted Burmese and All Other Refugees, FY 2009-19*
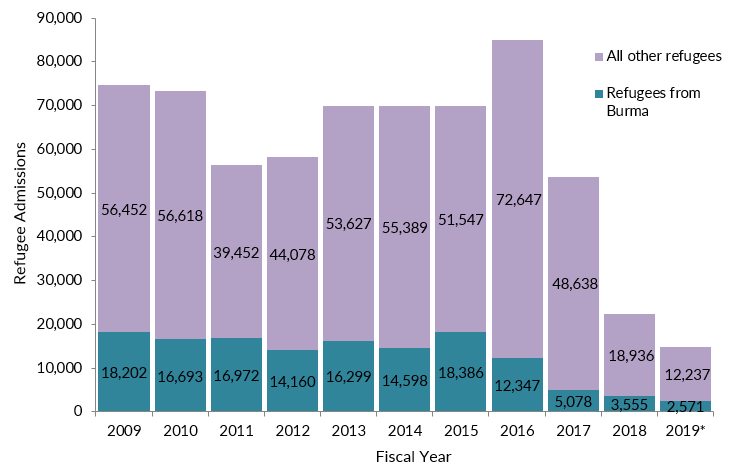
* Data for FY 2019 are partial and refer to resettlement between October 1, 2018 and April 30, 2019.
Source: MPI analysis of State Department WRAPS data.
Though the number of Central American migrants seeking asylum has risen, admission of refugees through formal resettlement channels from this region has been relatively low. In December 2014, the Obama administration established the Central American Minors (CAM) program, an in-country refugee and parole program in El Salvador, Guatemala, and Honduras for children under age 21 whose parents are lawfully present in the United States. The Trump administration eliminated it entirely by the end of January 2018. Under a court settlement announced in April 2019, the administration agreed to allow approximately 2,700 Central American children to reunite with their parents in the United States, ending litigation filed after the administration terminated the CAM program.
Click here to read a report on in-country processing in Central America.
During the first seven months of FY 2019, roughly consistent with prior years, the top initial resettlement states were Texas (9 percent, or 1,389 individuals) and New York (6 percent, 932). Other major receiving states included California (6 percent, 848), Washington (6 percent, 827), and 4 percent for each of the following states: North Carolina (662), Ohio (651), Kentucky (649), Georgia (589), Michigan (584), and Arizona (536). Fifty-two percent of all refugees resettled during the period were in one of ten states (see Figure 4).
Figure 4. Refugee Arrivals by Initial State of Residence, FY 2019*
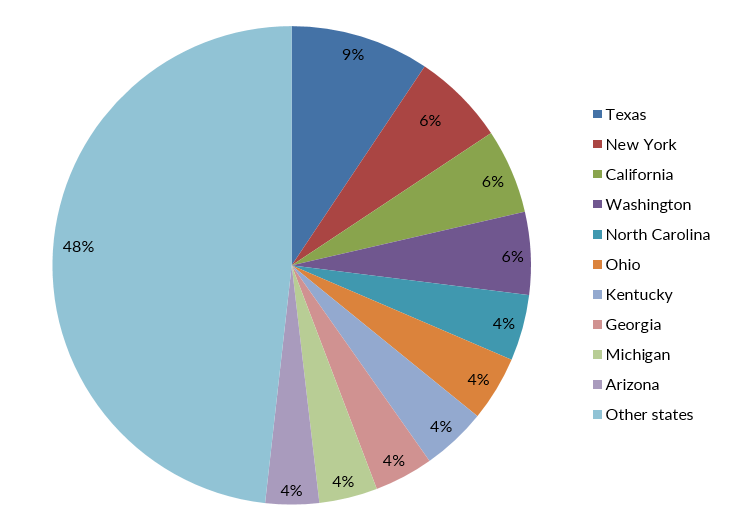
* Data for FY 2019 are partial and refer to resettlement between October 1, 2018 and April 30, 2019.
Source: MPI analysis of State Department WRAPS data.
States also differ quite significantly by refugee country of origin. For instance, although Burmese refugees have been the largest group admitted to the United States since 2007, representing 170,896 of the 756,953 refugees resettled between 2007 and the end of April 2019, they were the top group in just 19 states. Twelve states, including California and Michigan, resettled more Iraqis than any other nationality in the past decade; meanwhile, Florida and Nevada have received more Cuban refugees than any other group (see Figure 5).
Figure 5. Largest Resettled Refugee Groups by State of Initial Resettlement, FY 2009-19*
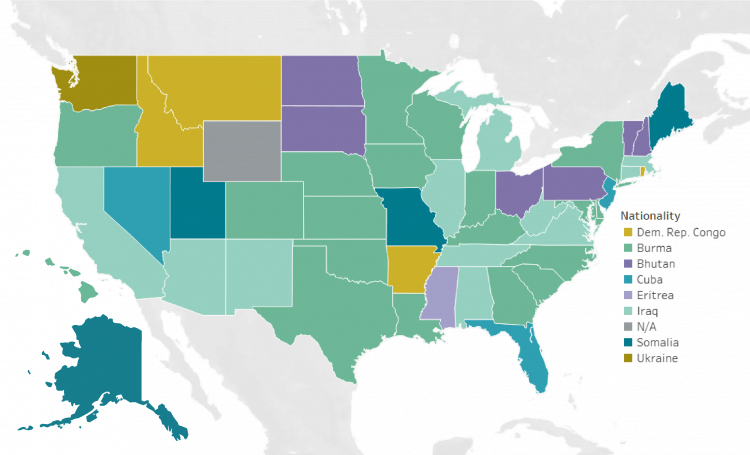
* Data for FY 2019 are partial and refer to resettlement between October 1, 2018 and April 30, 2019.
Source: MPI analysis of State Department WRAPS data.
Arriving refugees are placed in communities based on their needs, factors including family ties, and the receiving community’s language services, health care and housing availability, educational and job opportunities, and cost of living.
Since 2015, citing concerns ranging from limited federal funding, use of local resources, and potential national-security threats, states and localities have become increasingly vocal about having greater say so in the resettlement process, and a number have ended state involvement in the provision of refugee services, leaving them to local nongovernmental resettlement agencies.
Note: The figures presented here do not account for secondary migration of refugees who move between states after they are initially resettled.
Religious Composition of Refugees
Overall, the United States admitted more Christian refugees in the past decade than Muslim ones. Between October 2009 and April 2019, Christians represented 46 percent (301,420) of the 648,482 refugees resettled during this period. In comparison, 33 percent (211,844) of refugees admitted during the same period were Muslim. More than half of these Muslim refugees were from Iraq (39 percent) or Somalia (27 percent).
Figure 6. Religious Composition of Refugees Admitted to the United States, FY 2009-19*
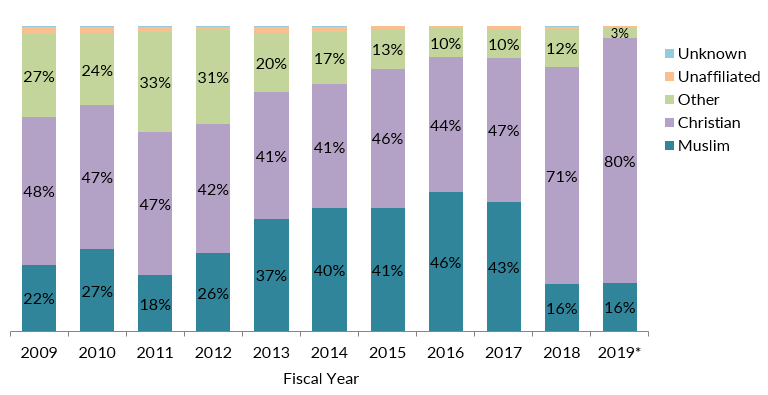
* Data for FY 2019 are partial and refer to resettlement between October 1, 2018 and April 30, 2019.
Source: MPI analysis of State Department WRAPS data.
2016 marked the only time since 2009 when the United States resettled more Muslim refugees than Christians. In that year, 84,994 refugees were admitted; of these, 46 percent (38,900) were Muslim and 44 percent (37,521) were Christian (see Figure 6). More than half of Muslim refugees in 2016 were from Syria (32 percent) or Somalia (23 percent).
Since the Trump administration travel ban and additional vetting procedures were implemented in 2017, Muslim refugees represented just 16 percent (3,495 individuals) of all those resettled in 2018. The first seven months of FY 2019 have followed a similar pattern, and Muslim refugees made up 16 percent (2,375 refugees) of the 14,808 resettled as of April 30, 2019.
Age and Gender for Top Refugee Groups
The U.S. refugee resettlement program focuses on the most vulnerable populations and those with the best prospects for long-term integration. Individuals with critical medical conditions or disabilities, and families with young children, are typically prioritized for resettlement. In the first seven months of FY 2019, children under age 14 and women made up 70 percent of refugees from the DRC, 68 percent of those from Burma, 66 percent from Ukraine, 63 percent from Eritrea, and 54 percent from Afghanistan. Women and children under age 14 from these top five resettlement origin countries comprised 58 percent (8,521 refugees) of the total individuals resettled during the first seven months of FY 2019.
In 2017 (the most recent data available), 26,568 persons were granted asylum either affirmatively or defensively—a 31 percent increase from the 20,340 granted asylum in 2016, according to the DHS Yearbook of Immigration Statistics. Of these, 60 percent (16,045) were granted asylum affirmatively, while the remaining 40 percent, or 10,523 cases, were granted asylum defensively. (See Box for explanation of the differences between affirmative and defensive asylum.)
An additional 7,566 individuals who resided both outside and inside the United States were approved for derivative status as immediate family members of principal asylum applicants. (Note: this number reflects travel documents issued to the 3,831 family members residing abroad, not their actual arrival to the United States.)
Nationals of China, El Salvador, and Guatemala accounted for 45 percent (12,013) of those granted affirmative or defensive asylum status in 2017 (see Table 2). Notably, the number of Central Americans from the Northern Triangle countries of El Salvador, Guatemala, and Honduras who received asylum status grew from 1,007 in 2012 to 8,480 in 2017. However, a significant number of applications are still under review due to processing backlogs.
Click here for a report on the state of the U.S. asylum system and the impact of flows from Central America.
Table 2. Affirmative, Defensive, and Total Asylees by Country of Nationality, 2017
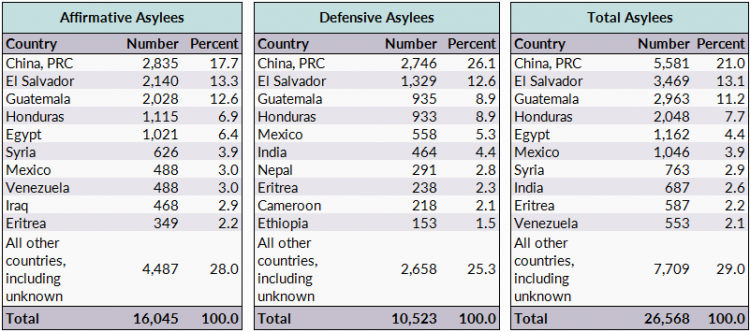
Source: Department of Homeland Security (DHS), Office of Immigration Statistics, 2017 Yearbook of Immigration Statistics, available online.
Adjusting to Lawful Permanent Resident Status
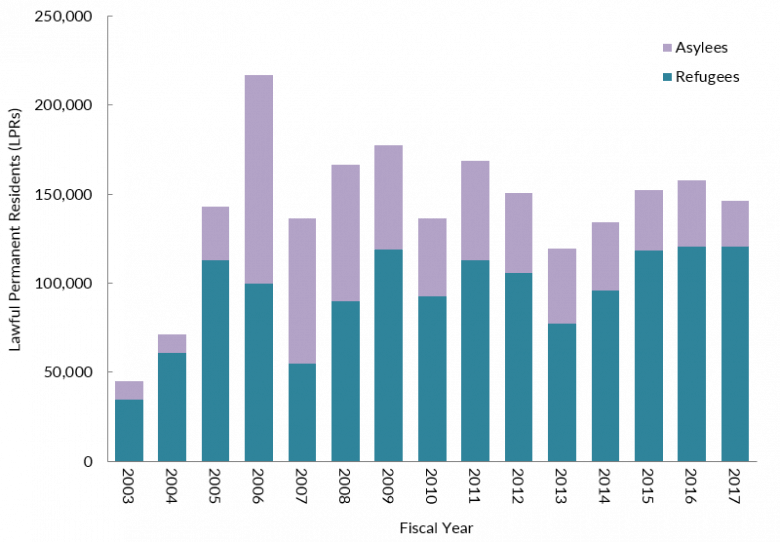
In 2017, 146,003 refugees and asylees adjusted their status to lawful permanent resident, of whom 120,356 (82 percent) were refugees and the remainder, 25,647 (18 percent), were asylees (see Figure 7).
Figure 7. Refugees and Asylees Granted Lawful Permanent Residence, FY 2003-17
Source: DHS, Office of Immigration Statistics, Yearbook of Immigration Statistics, various years.
Refugees must apply for lawful permanent resident (LPR) status—also known as getting a green card—one year after being admitted to the United States. Asylees become eligible to adjust to LPR status after one year of residence, but are not required to do so. As lawful permanent residents, refugees and asylees have the right to own property, attend public schools, join certain branches of the U.S. armed forces, and travel internationally without an entry visa. They may also apply for U.S. citizenship five years after being admitted.
Until 2005, there was an annual limit of 10,000 on the number of asylees authorized to adjust to LPR status. The REAL ID Act eliminated that cap. No annual limit exists on the number of refugees eligible to adjust to LPR status.
Sources
Beech, Eric and David Alexander. 2019. Court Settlement Paves Way to Reunite Central American Children with Parents in U.S. Reuters, April 12, 2019. Available online.
Capps, Randy and Michael Fix. 2015. Ten Facts about U.S. Refugee Resettlement. Washington, DC: Migration Policy Institute. Available online.
Chishti, Muzaffar and Jessica Bolter. 2019. The Travel Ban at Two: Rocky Implementation Settles into Deeper Impacts. Migration Information Source, January 31, 2019. Available online.
Chishti, Muzaffar and Sarah Pierce. 2016. U.S. Meets 2016 Syrian Refugee Admission Goal; Opposition to New Resettlement Mounts. Migration Information Source, September 28, 2016. Available online.
Congressional Research Service (CRS). 2017. Refugee Admissions and Resettlement Policy. Washington, DC: CRS. Available online.
---. 2018. Refugee Admissions and Resettlement Policy. Washington, DC: CRS. Available online.
Falconer, Robert. 2019. Global Refugee Resettlement and Canada. Available online.
Harris, Gardiner. 2017. U.S. Quietly Lifts Limit on Number of Refugees Allowed In. The New York Times, May 26, 2017. Available online.
Hoffman, Meredith. 2017. Far Fewer Refugees Entering US Despite Travel Ban Setbacks 2017. Associated Press, May 10, 2017. Available online.
Kennedy, Merrit. 2016. Texas Pulls Out of Federal Refugee Resettlement Program. National Public Radio, September 30, 2016. Available online.
Park, Haeyoun and Larry Buchanan. 2017. Refugees Entering the U.S. Already Face a Rigorous Vetting Process. The New York Times, January 29, 2017. Available online.
Pierce, Sarah. 2019. Immigration-Related Policy Changes in the First Two Years of the Trump Administration. Washington, DC: Migration Policy Institute. Available online.
Ratwatte, Indrika. 2019. Presentation to the 74th Meeting of the Standing Committee. UN High Commissioner for Refugees (UNHCR), March 5, 2019. Available online.
Robles, Frances and Kirk Semple. 2017. Trump’s New Ban Leaves Few Spots for Refugees, Even the Hunted. The New York Times, March 7, 2017. Available online.
Tan, Vivian. 2014. US Wraps up Group Resettlement for Myanmar Refugees in Thailand. UN High Commissioner for Refugees blog, January 29, 2014. Available online.
Donald J. Trump et al. v. International Refugee Assistance Project et al. 2017. Docket No. 16–1436, U.S. Supreme Court, June 26, 2017. Available online.
United Nations High Commissioner for Refugees (UNHCR). 2018. Global Trends: Forced Displacement in 2017. Geneva: UNHCR. Available online.
---. N.d. Resettlement. Accessed May 30, 2019. Available online.
U.S. Department of Homeland Security (DHS). 2016. U.S. Expands Initiatives to Address Central American Migration Challenges. Washington, DC: DHS. Available online.
DHS, Office of Immigration Statistics. 2019. 2017 Yearbook of Immigration Statistics. Washington, DC: DHS, Office of Immigration Statistics. Available online.
---. 2019. Annual Flow Report: Refugees and Asylees: 2017. Washington, DC: DHS, Office of Immigration Statistics. Available online.
U.S. Department of State, Bureau of Population, Refugees, and Migration. N.d. Refugee Processing Center - Admissions & Arrivals. Accessed May 28, 2019. Available online.
---. N.d. Refugee Processing Center – Interactive Reporting. Accessed May 28, 2019. Available online.
Zong, Jie and Jeanne Batalova. 2017. Syrian Refugees in the United States. Migration Information Source, January 12, 2017. Available online.