

South American Immigrants in the United States

A couple celebrating carnival at home. (Photo: iStock.com/klebercordeiro)
Immigrants from South America comprise a small share of the total U.S. immigrant population. However, arrivals from the region have increased in recent years and flows are diversifying. Many of the 3.4 million South Americans living in the United States as of 2019 immigrated during the Cold War era, from the 1960s to the 1980s. Authoritarian regimes, poor economic conditions, and internal armed conflicts drove migration from countries including Argentina and Chile, and a shift in U.S. policies made immigration more feasible. In the 1990s and 2000s, social and economic crises fueled further departures from the region.
More recently, the United States has become an emerging destination for Venezuelans. Most of the nearly 6 million Venezuelans who make up Latin America’s largest exodus in recent years remain in other countries in South America, particularly Colombia, Peru, Chile, and Ecuador. However, economic devastation amid the COVID-19 pandemic coupled with changing political winds in some of these host countries has prompted a small but growing number of Venezuelans to move onward again, often towards the United States. The U.S. Border Patrol encountered Venezuelan nationals nearly 25,000 times at the U.S.-Mexico border in December 2021, a record high and 29-fold increase over December 2020. Similar economic factors have also driven emigration of nationals of other countries in the region, mainly Ecuador and Brazil.
Overall, South American immigrants in the United States represented close to 8 percent of the 44.9 million foreign born in the United States in 2019, up from 1 percent in 1960. They account for a fraction of all immigrants from Latin America, with populations from Mexico and Central America significantly larger.
Figure 1. South American Immigrant Population in the United States, 1980–2019
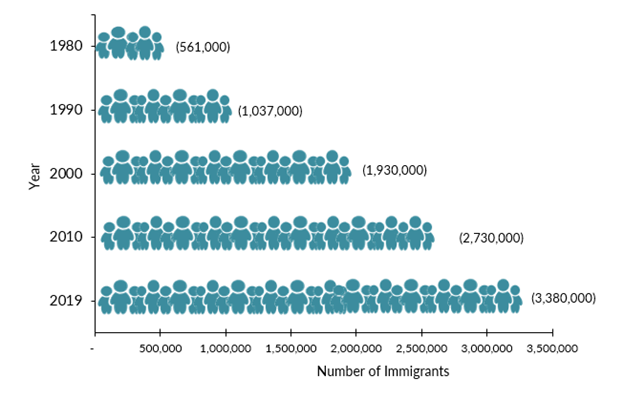
Sources: Data from U.S. Census Bureau 2010 and 2019 American Community Surveys (ACS); Campbell J. Gibson and Emily Lennon, "Historical Census Statistics on the Foreign-Born Population of the United States: 1850-2000" (Working Paper no. 81, U.S. Census Bureau, Washington, DC, February 2006), available online.
In 2019, the South American countries accounting for the largest number of nationals in the United States were Colombia (808,000, or 24 percent of all South American immigrants), Brazil (502,000, or 15 percent), Venezuela (465,000, or 14 percent), Peru (446,000, or 13 percent), and Ecuador (431,000, or 13 percent). Together, these five countries accounted for nearly 80 percent of the total South American immigrant population in the United States.
Since the onset of the political and humanitarian crisis in Venezuela in 2014, the number of Venezuelans residing in the United States has more than doubled, from 216,00 to 465,000, with Venezuela moving from sixth to third place in size of the immigrant population from South America.
Table 1. South American Immigrants in the United States by Country of Origin, 2019
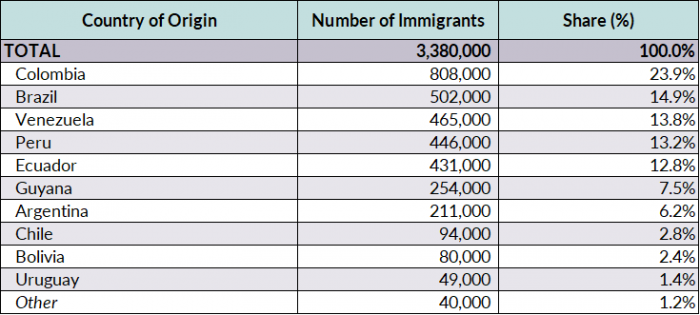
Note: Percentages may not add up to 100 as they are rounded to the nearest tenth.
Source: Migration Policy Institute (MPI) tabulation of data from the U.S. Census Bureau, 2019 ACS.
In 2020, 17.6 million South Americans resided outside their country of birth, including 5.4 million Venezuelans, 3 million Colombians, and 1.9 million Brazilians, according to mid-2020 estimates by the United Nations Population Division. Of these, about 8.6 million (or 49 percent) lived elsewhere within the region. Outside the region, the United States is by far the top destination for South Americans, followed by Spain (2.2 million), Italy (545,000), Canada (343,000), and Japan (258,000).
Click here to view an interactive map showing where migrants from South America and other countries have settled worldwide.
On average, most South American immigrants obtain lawful permanent residence in the United States (also known as receiving a green card) through family ties. By and large, South American immigrants mirror the sociodemographic characteristics of the overall U.S. immigrant population with a few exceptions: They tend to be slightly more educated and more likely to participate in the labor force.
Using data from the U.S. Census Bureau (the 2019 American Community Survey [ACS] as well as pooled 2015–19 ACS data) and the Department of Homeland Security’s Yearbook of Immigration Statistics, this Spotlight provides information on the South American population in the United States, focusing on its size, geographic distribution, and socioeconomic characteristics.
Click on the bullet points below for more information:
- Distribution by State and Key Cities
- English Proficiency
- Age, Education, and Employment
- Income and Poverty
- Immigration Pathways and Naturalization
- Unauthorized Immigrant Population
- Health Coverage
- Diaspora
- Remittances
Distribution by State and Key Cities
More than half of South American immigrants resided in just three states: Florida (27 percent), New York (18 percent), and New Jersey (10 percent). The five counties with the most South Americans were Miami-Dade County in Florida, Queens County in New York, Broward County in Florida, Los Angeles County in California, and Kings County in New York. Together, these counties accounted for 28 percent of the South American immigrant population in the United States.
Figure 2. Top States of Residence for South Americans in the United States, 2015–19
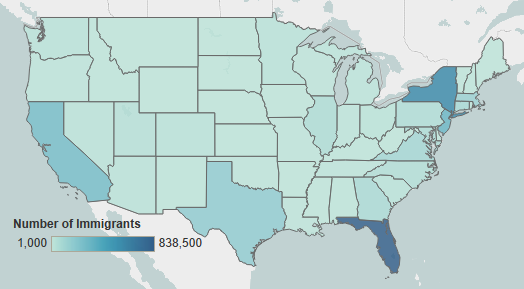
Note: Pooled 2015–19 ACS data were used to get statistically valid estimates at the state level for smaller-population geographies. Not shown are the populations in Alaska and Hawaii, which are small in size; for details, visit the MPI Data Hub for an interactive map showing geographic distribution of immigrants by state and county, available online.
Source: MPI tabulation of data from U.S. Census Bureau pooled 2015–19 ACS.
The U.S. cities with the largest number of South Americans were the greater New York, Miami, and Washington, DC metropolitan areas. Just under half (48 percent) of South American immigrants lived in these three metro areas.
Figure 3. Top Metropolitan Areas of Residence for South Americans in the United States, 2015–19
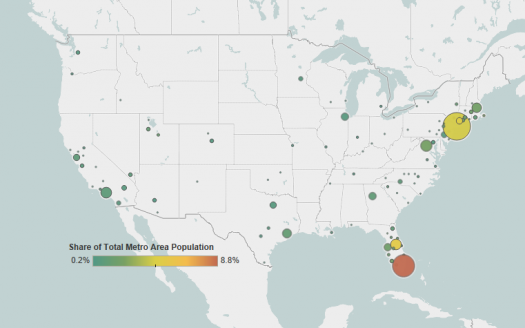
Note: Pooled 2015–19 ACS data were used to get statistically valid estimates at the metropolitan statistical-area level for smaller-population geographies. Not shown are the populations in Alaska and Hawaii, which are small in size.
Source: MPI tabulation of data from U.S. Census Bureau pooled 2015–19 ACS.
Click here for an interactive map highlighting the metropolitan areas with the highest concentrations of immigrants from South American and other countries.
Table 2. Top Concentrations of South Americans by Metropolitan Area, 2015–19
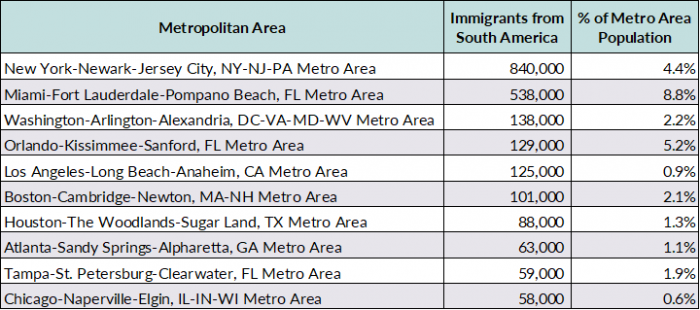
Source: MPI tabulation of data from the U.S. Census Bureau pooled 2015–19 ACS.
South American immigrants have a similar level of English proficiency as the overall foreign-born population. In 2019, approximately 44 percent of South American immigrants (ages 5 and over) reported limited English proficiency, compared to 46 percent of all immigrants. English proficiency level varies by country of origin: About half or more of Ecuadorans (56 percent), Colombians (51 percent), and Peruvians (50 percent) reported limited English proficiency, whereas immigrants from Brazil (43 percent), Bolivia (41 percent), Chile (36 percent), and Argentina (33 percent) were less likely to be Limited English Proficient (LEP). Very few immigrants from English-speaking Guyana (less than 4 percent) were LEP.
Note: Limited English proficiency refers to those who indicated on the ACS questionnaire that they spoke English less than “very well.”
Age, Education, and Employment
In 2019, South American immigrants had the same median age as the overall foreign-born population (46 years) but were older than the U.S.-born population (37 years).
South American immigrants are about as likely as the overall foreign-born population to be of working age (18 to 64; see Figure 4). Most immigrants from Brazil (85 percent), Ecuador (82 percent), and Bolivia (80 percent) were of working age, while a not-insignificant share of those from Chile (25 percent), Argentina (23 percent), and Guyana (22 percent) were seniors (ages 65 and older).
Figure 4. Age Distribution of the U.S. Population by Origin, 2019
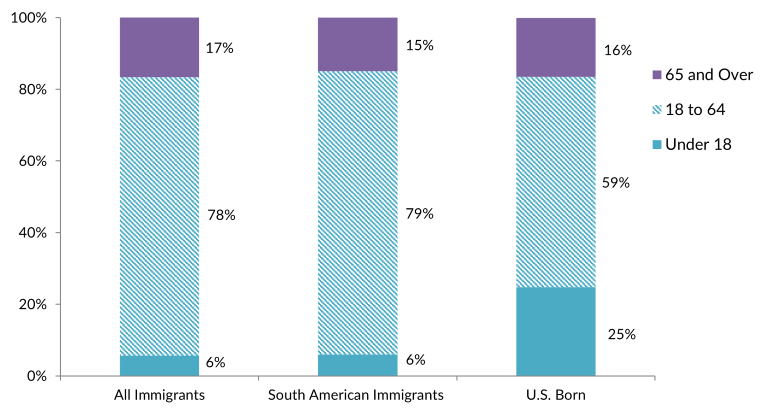
Note: Percentages may not add up to 100 as they are rounded to the nearest whole number.
Source: MPI tabulation of data from the U.S. Census Bureau 2019 ACS.
South American immigrant adults (ages 25 and older) tend to have higher levels of education than the overall immigrant adult population. In 2019, just 13 percent of South Americans in the United States had not finished high school, compared to 26 percent of all immigrants and 8 percent of U.S.-born adults. Approximately 36 percent of South American adults had a bachelor’s degree or higher, slightly higher than both the total immigrant and native-born adult populations (33 percent each).
More than half of immigrants from Venezuela (56 percent), 44 percent from Brazil, and 41 percent apiece from Argentina and Chile were college graduates, compared to 20 percent of immigrants from Ecuador and 21 percent from Guyana.
In school year (SY) 2020-21, nearly 40,500 South American students were enrolled in U.S. higher educational institutions, representing 4 percent of all 914,100 international students studying in the United States. Brazil (14,000), Colombia (7,100), and Venezuela (6,100) were the top origin countries of international students from the region.
South Americans participate in the labor force at a higher rate than both the native- and overall foreign-born populations. About 70 percent of South American immigrants ages 16 and over were in the civilian labor force in 2019, compared to 67 percent of all immigrants and 62 percent of the U.S. born. South Americans largely work in similar occupations as immigrant workers overall. Both groups are less likely than their U.S.-born counterparts to be in management, business, science, and arts occupations, and more likely to be in service occupations (see Figure 5). However, likely owing to their higher levels of college education and better English skills, a significant share of immigrant workers from Argentina (47 percent), Chile (45 percent), and Venezuela and Brazil (38 percent each) were employed in management, business, science, and arts occupations.
Figure 5. Employed Workers in the Civilian Labor Force (ages 16 and older) by Occupation and Origin, 2019
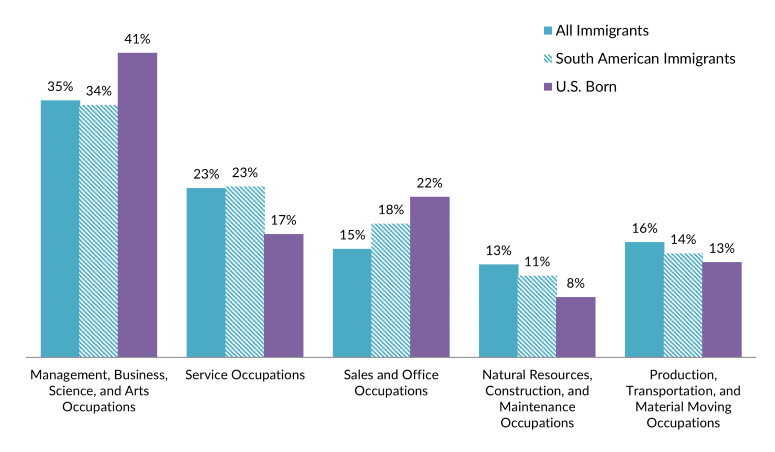
Source: MPI tabulation of data from the U.S. Census Bureau 2019 ACS.
On average, household incomes of South Americans are similar to those of the total immigrant population. In 2019, households headed by a South American immigrant had a median income of $63,000, compared to $64,000 for all foreign born and $66,000 for U.S.-born households.
Households headed by immigrants from Bolivia ($74,000), Brazil ($68,000), and Chile and Argentina (about $67,00 each) had the highest median incomes, while Venezuelan ($56,000) households had the lowest median incomes.
In 2019, approximately 12 percent of South American immigrants lived in poverty (defined as earning less than $25,750 for a family of four), the same rate as the U.S. born and slightly lower rate than the overall foreign-born population (14 percent). Brazilians and Venezuelans were more likely to be living in poverty (15 percent each), followed by immigrants from Peru (12 percent). In contrast, just 8 percent of immigrant families from Bolivia were living below the poverty line.
Immigration Pathways and Naturalization
In 2019, South American immigrants were about as likely as the overall foreign-born population to be naturalized U.S. citizens (53 percent and 52 percent, respectively).
Immigrants from Guyana (78 percent), Colombia (62 percent), and Argentina and Peru (60 percent each) had the highest naturalization rates, while those from Brazil (35 percent) and Venezuela (34 percent) were the least likely to be naturalized U.S. citizens.
The largest share of South American immigrants (44 percent) arrived prior to 2000; 27 percent arrived between 2000 and 2009, and 30 percent since 2010 (see Figure 6). Some groups settled in the United States long ago. Sixty-four percent of immigrants from Guyana and 60 percent of those from Chile entered before 2000. About half of immigrants from Peru (51 percent), Argentina and Ecuador (50 percent each), and Bolivia (49 percent) arrived prior to 2000. By contrast, 59 percent of Venezuelans and 47 percent of Brazilians arrived in 2010 or later.
Figure 6. South Americans and All Immigrants in the United States by Period of Arrival, 2019

Note: Percentages may not add up to 100 as they are rounded to the nearest whole number.
Source: MPI tabulation of data from the U.S. Census Bureau 2019 ACS.
Most South Americans who obtain green cards do so through family reunification channels. Sixty-eight percent of the approximately 62,200 South Americans who became lawful permanent residents (LPRs) in fiscal year (FY) 2020 did so as either immediate relatives or other family members of U.S. citizens or LPRs, a higher share than the 63 percent of new LPRs from all countries. South American immigrants were also more likely to gain green cards via employment pathways (25 percent) than the overall LPR population (21 percent; see Figure 7).
Figure 7. Immigration Pathways of South American and All Lawful Permanent Residents in the United States, 2020
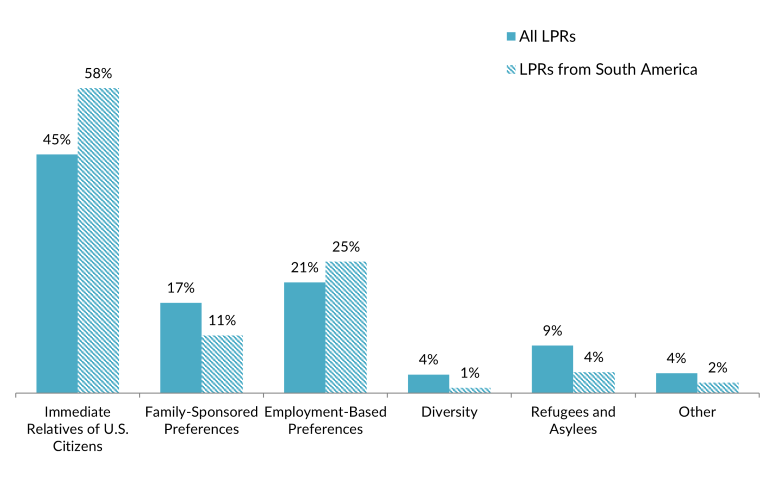
Notes: Immediate relatives of U.S. citizens include spouses, minor children, and parents of U.S. citizens. Family-sponsored preferences include adult children and siblings of U.S. citizens as well as spouses and children of green-card holders. The Diversity Visa lottery was established by the Immigration Act of 1990 to allow entry to immigrants from countries with low rates of immigration to the United States. The law states that 55,000 diversity visas in total are to be made available each fiscal year. Individuals born in Brazil, Colombia, and Venezuela are not eligible for the most recent DV 2023 lottery.
Source: MPI tabulation of data from Department of Homeland Security (DHS), 2020 Yearbook of Immigration Statistics (Washington, DC: DHS Office of Immigration Statistics, 2022), available online.
In the past decade, the number of new LPRs from Venezuela increased from about 9,200 in FY 2011 to 15,700 in FY 2019, followed by a drop to 12,100 in FY 2020. These individuals represented 20 percent of all South Americans who received a green card in 2020, up from 11 percent in 2011. Venezuelans were less likely than the overall LPR population to obtain a green card based on family ties (57 percent in FY 2020). They were much more likely to have been admitted as refugees and asylees (14 percent) than the total South American immigrant population (4 percent) or all LPRs (9 percent).
Unauthorized Immigrant Population
The Migration Policy Institute (MPI) estimates that as of 2019, approximately 907,000 (8 percent) of the estimated 11 million unauthorized immigrants in the United States were from South America. Their top South American countries of birth were Venezuela (189,000), Brazil (178,000), Colombia (171,000), Ecuador (142,000), and Peru (102,000).
Approximately 28,600 unauthorized immigrants from South America were active participants in the Deferred Action for Childhood Arrivals (DACA) program, which provides temporary deportation relief and work authorization, according to September 2021 data from U.S. Citizenship and Immigration Services (USCIS). These individuals represented approximately 5 percent of the 611,000 DACA participants.
The top five South American countries by DACA participation were Peru (5,800 recipients), Brazil (4,700), Ecuador (4,400), Colombia (3,900), and Argentina (3,100).
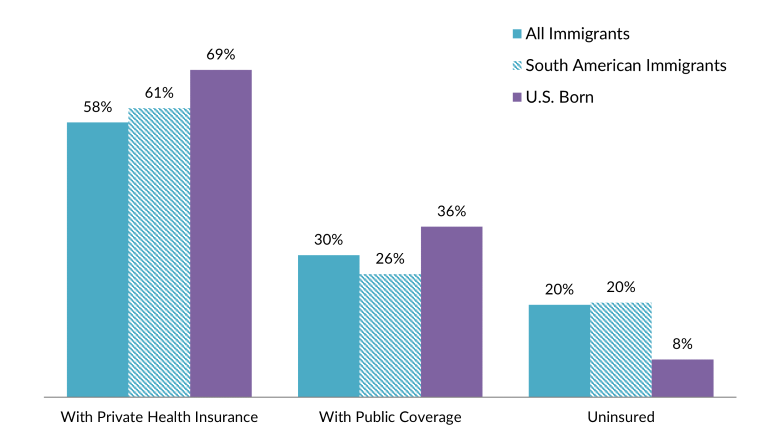
South American immigrants were as likely to be uninsured as the overall foreign-born populations (20 percent) compared to 8 percent of the native born (see Figure 8). South Americans were slightly more likely to have private health insurance coverage (61 percent) and less likely to have public coverage (26 percent) than the overall foreign-born population.
Brazilians (26 percent), Ecuadorians (25 percent), and Bolivians and Venezuelans (22 percent each) were more likely to lack health insurance than immigrants from Guyana (10 percent), Chile (14 percent), and Argentina (16 percent).
Figure 8. Health Coverage for South Americans, All Immigrants, and the Native Born, 2019
Note: The sum of shares by type of insurance is likely to be greater than 100 because people may have more than one type of insurance.
Source: MPI tabulation of data from the U.S. Census Bureau 2019 ACS.
The South American diaspora in the United States is comprised of approximately 5.6 million individuals who were either born in South America or reported ancestry of a given country in South America, according to tabulations from the 2019 ACS.
Remittances sent to South America have grown rapidly since 2000. In 2020, remittances sent via formal channels to countries in the region equaled $19.9 billion, up 28 percent from $15.5 billion in 2015.
Four countries received 84 percent of all remittances sent to South America in 2020: Colombia ($6.9 billion or 35 percent), Brazil ($3.6 billion, or 18 percent), Ecuador ($3.3 billion, or 17 percent), and Peru ($2.9 billion, or 15 percent). For a number of South American countries, remittances accounted for under 2 percent of gross domestic product (GDP), although remittance dependence was higher in Guyana (6 percent of GDP), Ecuador (4 percent), and Colombia and Bolivia (3 percent each).
Figure 9. Annual Remittance Flows to South America, 1990–2020

Note: The 2020 figure represents preliminary estimates by the World Bank.
Source: MPI tabulations of data from the World Bank Prospects Group, “Annual Remittances Data,” May 2021 update, available online.
Sources
Gibson, Campbell J. and Kay Jung. 2006. Historical Census Statistics on the Foreign-Born Population of the United States: 1850-2000. Working Paper No. 81, U.S. Census Bureau, Washington, DC, February 2006. Available online.
Goodman, Joshua. 2021. Driven by Pandemic, Venezuelans Uproot Again to Come to US. Associated Press, June 28, 2021. Available online.
Hackman, Michelle. 2021. Growing Share of Migrants from Outside Mexico, Central America Poses Challenge for Biden. The Wall Street Journal, August 16, 2021. Available online.
Institute of International Education (IIE). 2021. International Students: All Places of Origin. Washington, DC: IIE. Available online.
Migration Data Portal. 2021. Migration Data in South America. Updated October 26, 2021. Available online.
Migration Policy Institute (MPI). 2015. The Colombian Diaspora in the United States Washington, DC: MPI. Available online.
Miroff, Nick. 2021. Venezuelan Migrants Are New Border Challenge for Biden Administration. The Washington Post, November 23, 2021. Available online.
Montes, Juan, Ryan Dube, and Kejal Vyas. 2021. Latin American Migration, Once Limited to a Few Countries, Turns into a Mass Exodus. The Wall Street Journal, September 22, 2021. Available online.
United Nations Population Division. 2020. International Migrant Stock 2020: Destination and Origin. Available online.
U.S. Census Bureau. 2020. 2019 American Community Survey. Accessed from Steven Ruggles, Katie Genadek, Ronald Goeken, Josiah Grover, and Matthew Sobek. Integrated Public Use Microdata Series: Version 11.0 [dataset]. Minneapolis: University of Minnesota. Available online.
---. N.d. 2019 American Community Survey—Advanced Search. Accessed February 5, 2022. Available online.
U.S. Citizenship and Immigration Services (USCIS). 2021. Count of Active DACA Recipients by Month of Current DACA Expiration as of September 30, 2021. Available online.
U.S. Department of Homeland Security (DHS), Office of Immigration Statistics. 2022. 2020 Yearbook of Immigration Statistics. Washington, DC: DHS Office of Immigration Statistics. Available online.
World Bank Prospects Group. 2021. Annual Remittances Data, May 2021 update. Available online.