

Ukrainian Immigrants in the United States

Opika Performance Group from Ukraine at the Smithsonian Folklife Festival in Washington, DC. (Photo: Peace Corps)
Amid the huge internal and international displacement of millions of Ukrainians after their country was invaded by Russia in February 2022, the United States is extending protection to as many as 180,000. In what has become Europe’s largest humanitarian crisis since World War II, nearly 8 million Ukrainians have been internally displaced and more than 6 million civilians (predominantly women and children) have fled the country—the vast majority seeking refuge in neighboring Poland, Moldova, Romania, Hungary, and Slovakia.
The Biden administration’s actions to welcome some Ukrainians began on March 3, when Homeland Security Secretary Alejandro Mayorkas announced the grant of Temporary Protected Status (TPS) for 18 months for certain Ukrainians already present in the United States. The Department of Homeland Security (DHS) estimated that 59,600 Ukrainians would be eligible for the program, which provides relief from deportation and work authorization. On April 21, the administration announced plans to welcome up to 100,000 Ukrainians through a combination of the Uniting for Ukraine program—a private sponsorship program that aims to temporarily bring displaced Ukrainians to the United States—and other, more permanent entry pathways. In more ad hoc fashion, the U.S. government admitted a reported 20,000 Ukrainians who arrived at the U.S.-Mexico border without authorization to enter; the practice was ended in late April.
The new Ukrainian arrivals are joining an existing Ukrainian diaspora in the United States that numbers more than 1.1 million. The Ukrainian diaspora includes close to 355,000 immigrants from Ukraine, who account for about 1 percent of the total 44.9 million immigrants living in the United States as of 2019. Beyond the 355,000 immigrants, the Ukrainian diaspora in the United States is comprised of people born in the United States or other countries who claim Ukrainian ancestry.
This article focuses on the population of Ukrainian immigrants in the United States pre-invasion of Ukraine, using the 2019 American Community Survey (ACS), which is the most recent comprehensive dataset available from the U.S. Census Bureau given pandemic-related data-collection difficulties for the 2020 ACS.
Ukrainians began migrating to the United States in the late 19th century over successive waves. An estimated 254,000 arrivals who came between 1899 and 1914 consisted mainly of agricultural laborers seeking economic and employment opportunities. Many initially settled on the East coast but gradually moved to Midwestern states such as Ohio and North Dakota. About 12,000 largely high educated and urban Ukrainians who fought for Ukrainian independence during a war with the Soviet Union between 1917 and 1921 left for the United States following defeat. The destruction caused by World War II led to another significant exodus of Ukrainians: About 80,000 migrated to the United States between 1947 and 1955, when the Soviet government restricted most forms of emigration.
After the collapse of the Soviet Union in 1991, Ukrainians were able to emigrate again, and 108,000 moved to the United States between 1992 and 1997. Many were economic and family migrants; others, for example Evangelical Christians and Jews, were beneficiaries of the Lautenberg Program that allows nationals of former Soviet republics to immigrate through the refugee resettlement program on grounds of religious persecution. The program is a key reason why more than 1,900 Ukrainians were granted refugee status in the United States in 2020, making them the third largest number of resettled refugees that year after nationals from the Democratic Republic of the Congo and Myanmar.
As of 2019, an estimated 355,000 Ukrainian immigrants lived in the United States, a nearly one-third increase over the 275,000 who were in the country as of 2000 (see Figure 1).
Figure 1. Ukrainian Immigrant Population in the United States, 2000-19
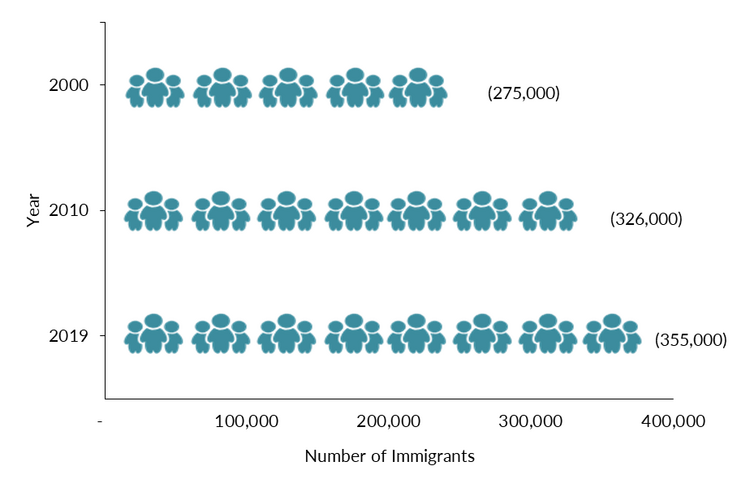
Note: The 2000 Census is the first year for which Ukrainians can be disaggregated in census data because Ukraine was part of the Union of the Soviet Socialist Republics (USSR) until the latter was dissolved in 1991.
Sources: Data from U.S. Census Bureau 2010 and 2019 American Community Surveys (ACS), and Campbell J. Gibson and Kay Jung, "Historical Census Statistics on the Foreign-born Population of the United States: 1850-2000" (Working Paper no. 81, U.S. Census Bureau, Washington, DC, February 2006), available online.
The United States is now home to the second largest Ukrainian population in the world, outnumbered by Russia (3,268,000), according to mid-2020 estimates from the United Nations Population Division (UNDP). The Ukrainian immigrant population in Kazakhstan is similar in size to the U.S. one. (Note: Russia and Kazakhstan were once part of the Soviet Union along with Ukraine. The high number of Ukrainian-born persons in Russia and Kazakhstan reflects both internal migration during the Soviet era and international migration after the former Soviet republics became independent nations.) Large numbers of Ukrainians also resided in Germany (290,000), Poland (273,000), and Italy (248,000) as of the 2020 UNDP estimates.
Click here to view an interactive map showing where migrants from Ukraine and other countries have settled worldwide.
Most Ukrainian immigrants in the United States are naturalized U.S. citizens and most gain legal permanent residence status either through family sponsorship or admittance via refugee and asylum channels. Compared to the overall U.S. immigrant population, Ukrainians have higher incomes and higher levels of educational attainment while experiencing lower levels of poverty.
Using data from the U.S. Census Bureau (the 2019 ACS as well as pooled 2015-19 ACS data), the Department of Homeland Security’s 2020 Yearbook of Immigration Statistics, and World Bank annual remittance data, this Spotlight provides information on the Ukrainian immigrant population in the United States, focusing on its size, geographic distribution, and socioeconomic characteristics.
Click on the bullet points below for more information:
- Distribution by State and Key Cities
- English Proficiency
- Age, Education, and Employment
- Income and Poverty
- Immigration Pathways and Naturalization
- Unauthorized Immigrant Population
- Health Coverage
- Diaspora
- Remittances
Distribution by State and Key Cities
Almost half of Ukrainian immigrants lived in three states as of the 2015-19 period: New York (22 percent), California (16 percent), and Washington (9 percent). The five counties that are home to the largest number of Ukrainian immigrants were Kings County in New York, Cook County in Illinois, Los Angeles and Sacramento counties in California, and King County in Washington. Together, these five counties accounted for about 31 percent of the total Ukrainian immigrant population in the United States.
Figure 2. Top States of Residence for Ukrainian Immigrants in the United States, 2015-19
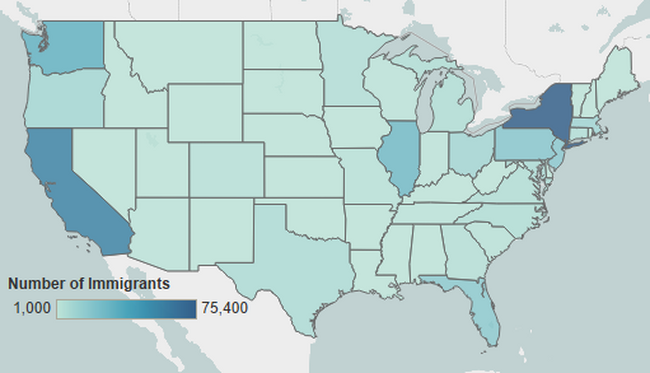
Note: Pooled 2015-19 ACS data were used to get statistically valid estimates at the state level for smaller-population geographies. Not shown are the populations in Alaska and Hawaii, which are small in size; for details, visit the Migration Policy Institute’s (MPI) Migration Data Hub for an interactive map showing geographic distribution of immigrants by state and county, available online.
Source: MPI tabulation of data from U.S. Census Bureau pooled 2015-19 ACS.
Click here for an interactive map that shows the geographic distribution of immigrants by state and county. Select Ukraine from the dropdown menu to see which states and counties have the highest distributions of Ukrainian immigrants.
Thirty-seven percent of Ukrainian immigrants in the United States resided in the greater metropolitan areas of New York, Chicago, and Seattle.
Figure 3. Top Metropolitan Areas of Residence for Ukrainian Immigrants in the United States, 2015-19
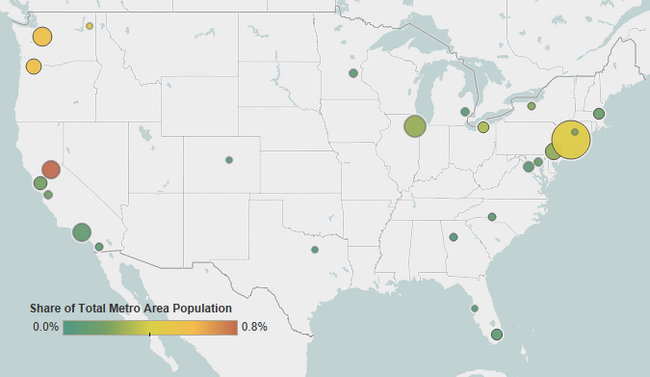
Note: Pooled 2015-19 ACS data were used to get statistically valid estimates at the metropolitan statistical area level for smaller-population geographies.
Source: MPI tabulation of data from the U.S. Census Bureau pooled 2015-19 ACS.
Click here for an interactive map that highlights the metropolitan areas with the highest concentrations of immigrants from Ukraine and elsewhere.
Table 1. Top Concentration of Ukrainian Immigrants by Metropolitan Area, 2015-19
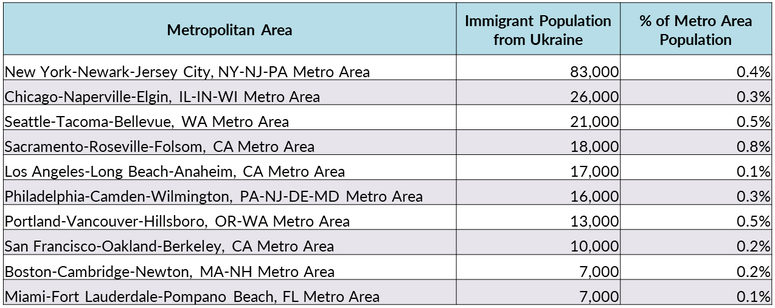
Source: MPI tabulation of data from the U.S. Census Bureau pooled 2015-19 ACS.
In 2019, 47 percent of Ukrainian immigrants (ages 5 and older) reported having limited English proficiency, a rate similar to the overall immigrant population (46 percent). A slightly smaller share of Ukrainian immigrants stated they spoke only English at home (13 percent) compared to 16 percent of the overall foreign-born population.
Note: Limited English proficiency refers to individuals who responded to the ACS questionnaire that they speak English less than “very well.”
Age, Education, and Employment
In 2019, the median age of Ukrainian immigrants was 46, the same as for the overall immigrant population but higher than for the U.S.-born population (age 37). Ukrainian immigrants were less likely to be of working age (between ages 18 and 64) than the total foreign-born population. Both groups, however, were far more likely to be in the 18-64 age group than the U.S.-born population.
Figure 4. Age Distribution of the U.S. Population by Origin, 2019
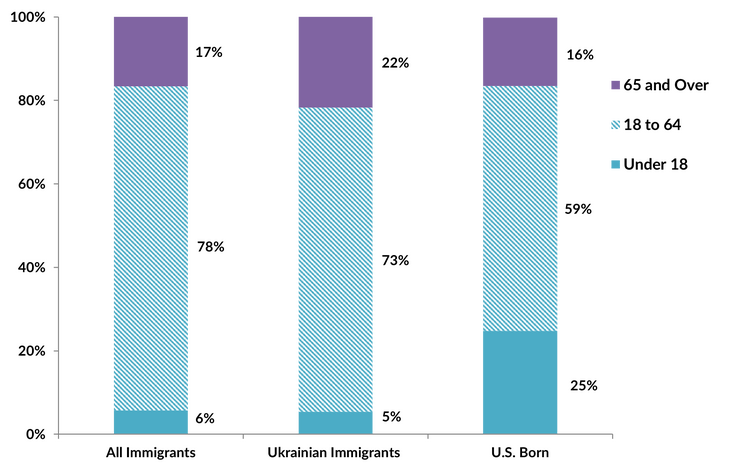
Source: MPI tabulation of data from the U.S. Census Bureau 2019 ACS.
Compared to the overall populations of foreign- and U.S.-born adults, Ukrainian immigrants have a higher level of educational attainment. In 2019, 56 percent of Ukrainian immigrant adults (25 and older) had a bachelor’s degree or higher, compared to 33 percent for both the total immigrant and U.S.-born populations.
About 1,700 international students from Ukraine were enrolled in U.S. higher education institutions in the 2020-21 school year, according to the Institute of International Education. While these students account for a tiny fraction of the 914,000 foreign nationals studying in the United States, they represent the second largest country of origin from Eastern Europe after Russia and the tenth largest from Europe overall.
Ukrainian immigrants participated in the U.S. labor market at a similar rate as the total foreign-born population (66 percent versus 67 percent) but at a higher level than the U.S.-born population (62 percent). Almost half of Ukrainians (48 percent) were employed in management, business, science, and arts occupations while 35 percent of the overall foreign born and 41 percent of U.S.-born individuals reported the same. Service occupations were the second largest occupation group for Ukrainian immigrants (see Figure 5).
Figure 5. Employed Workers in the U.S. Civilian Labor Force (ages 16 and older) by Occupation and Origin, 2019
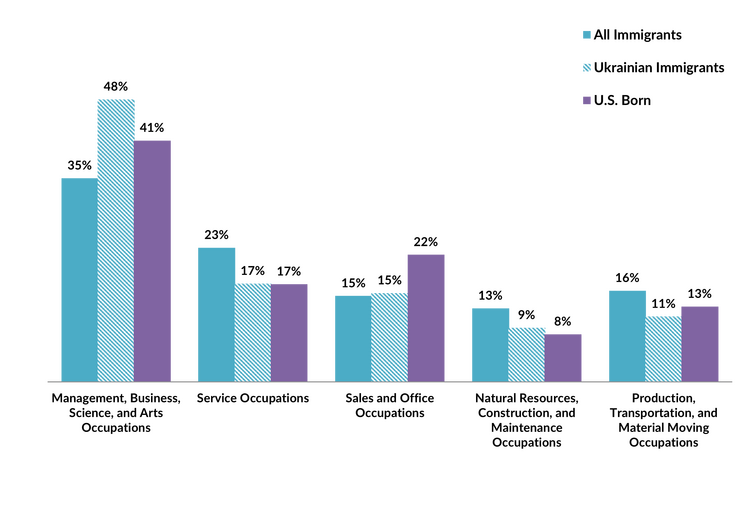
Source: MPI tabulation of data from the U.S. Census Bureau 2019 ACS.
Ukrainian immigrants tend to have higher median household incomes than both the overall immigrant and U.S.-born populations. In 2019, Ukrainian immigrants had a median household income of $68,000, while native-born households reported income of $66,000 and all immigrant households $64,000.
In 2019, Ukrainian immigrants’ poverty rate (13 percent) fell between that of the total immigrant population (14 percent) and the U.S.-born population (12 percent).
Immigration Pathways and Naturalization
Seventy-three percent of Ukrainian immigrants were naturalized U.S. citizens, a far higher share than the 52 percent share for all immigrants. Slightly more than half of Ukrainians arrived before 2000, with 21 percent coming between 2010 and 2019.
Figure 6. Ukrainian Immigrants and All Immigrants in the United States by Period of Arrival, 2019
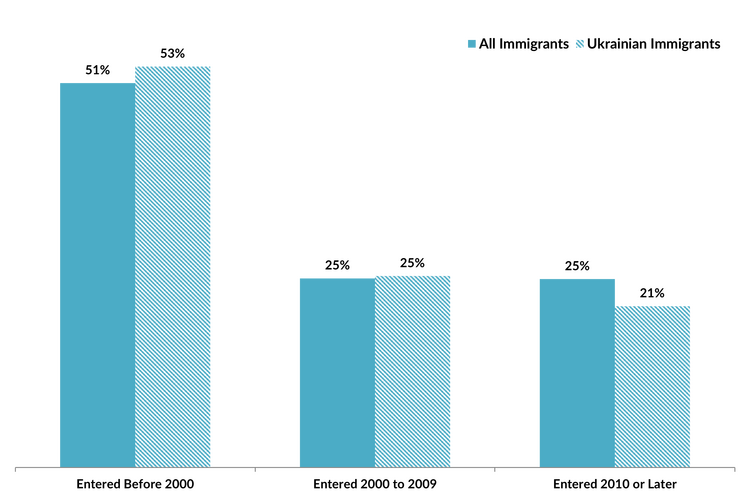
Source: MPI tabulation of data from the U.S. Census Bureau 2019 ACS.
In 2020, nearly 10,000 Ukrainians gained legal permanent residence (also known as getting a green card). Of this group, 39 percent obtained a green card after adjusting from refugee or asylee status and 36 percent became permanent residents through sponsorship by a family member who was a U.S. citizen or legal permanent resident. Sizeable numbers of Ukrainians also gained LPR status through the Diversity Visa lottery (see Figure 7).
Figure 7. Immigration Pathways of Ukrainian Immigrants and All Lawful Permanent Residents in the United States, FY 2020
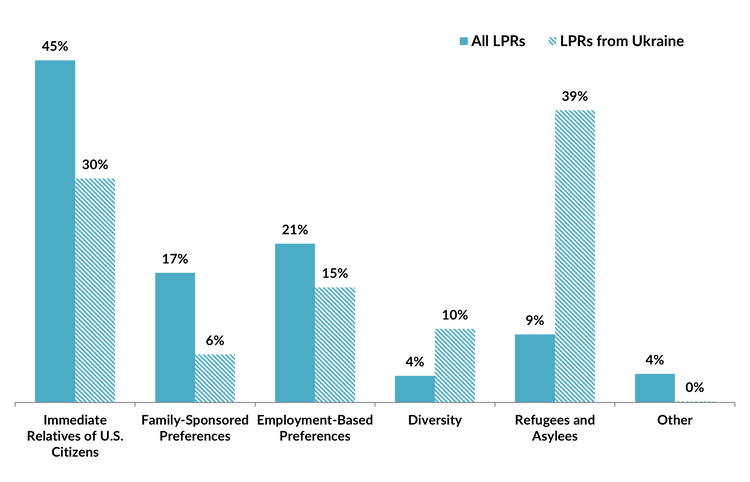
Notes: Immediate relatives of U.S. citizens include spouses, minor children, and parents of U.S. citizens. Family-sponsored preferences include adult children and siblings of U.S. citizens as well as spouses and children of green-card holders. The Diversity Visa lottery was established by the Immigration Act of 1990 to allow entry to immigrants from countries with low rates of immigration to the United States. The law states that 55,000 diversity visas in total are to be made available each fiscal year.
Source: MPI tabulation of data from Department of Homeland Security (DHS), 2020 Yearbook of Immigration Statistics (Washington, DC: DHS Office of Immigration Statistics, 2022), available online.
Unauthorized Immigrant Population
The Migration Policy Institute (MPI) estimates 17,000 Ukrainians resided in the United States without authorization in 2019. They represented just 0.2 percent of the 11 million unauthorized immigrants that MPI estimates are living in the United States.
Click here for an interactive data tool showing top states and counties of residence for unauthorized immigrants in the United States by country or region of origin.
U.S. Citizenship and Immigration Services (USCIS) reports 120 Ukrainians were beneficiaries of the Deferred Action for Childhood Arrivals (DACA) program, representing 0.02 percent of the 611,500 DACA recipients as of December 2021. The DACA program provides temporary protection from deportation and work authorization.
Click here for two interactive data tools showing MPI estimates of DACA-eligible unauthorized immigrant populations for top states and counties, and application rates by country of origin.
Ukrainian immigrants were less likely than the total foreign-born population to be uninsured, with 11 percent and 20 percent, respectively, but more likely to lack health insurance coverage than the U.S.-born population at 8 percent. Ukrainian immigrants were more likely to have private health coverage than the overall immigrant population but less likely than the native-born population (see Figure 8).
Figure 8. Health Insurance Coverage for Ukrainian Immigrants, All Immigrants, and the U.S. Born, 2019
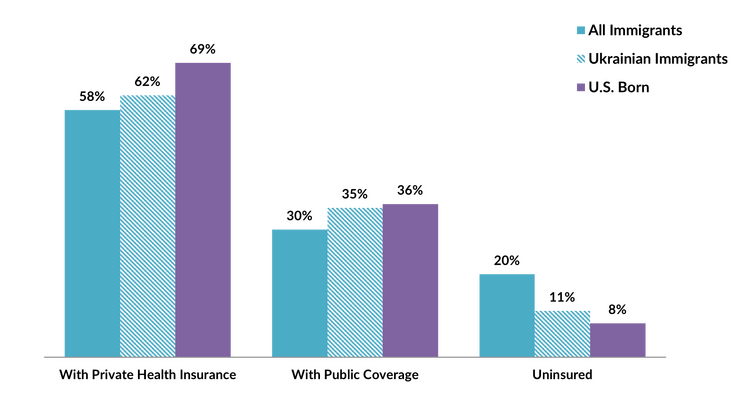
Note: The sum of shares by type of insurance is likely to be greater than 100 because people may have more than one type of insurance.
Source: MPI tabulation of data from the U.S. Census Bureau 2019 ACS.
The Ukrainian diaspora in the United States is comprised of approximately 1.1 million individuals who were born in Ukraine or reported Ukrainian ancestry, according to tabulations from the 2019 ACS. It is not among the top 20 diasporas in size.
Click here to see estimates of the top 20 diasporas groups in the United States in 2019.
In 2020, Ukraine received $15.1 billion in remittances from individuals in countries around the world through formal, measurable channels, a slight decline compared to $15.8 billion received in 2019. These remittances accounted for nearly 10 percent of Ukraine’s gross domestic product (GDP). The amount of remittances sent to Ukraine more than doubled in the past decade, according to World Bank data.
Figure 9. Annual Remittance Flows to Ukraine, 1996-2020
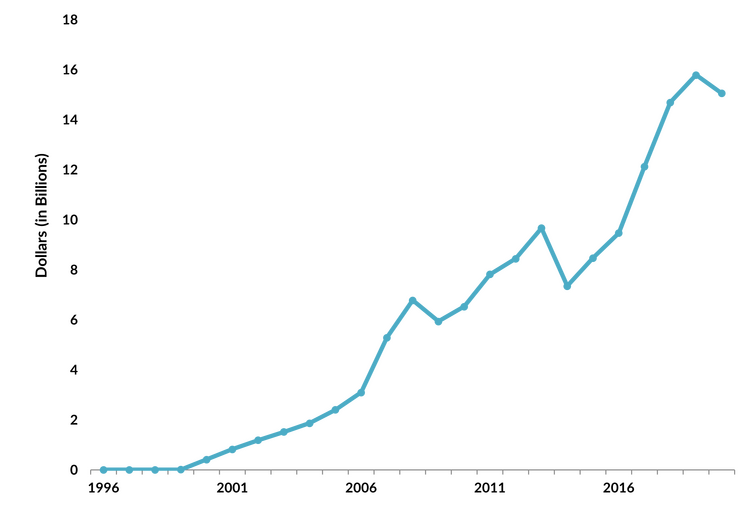
Note: The 2020 figure represents World Bank estimates. Data available beginning only in 1996.
Source: World Bank Prospects Group, “Annual Remittances Data,” May 2021 update, available online.
Visit the Migration Data Hub’s collection of interactive remittances tools, which track remittances by inflow and outflow, between countries, and over time.
Sources
Baugh, Ryan. 2022. Fiscal Year 2020 Refugees and Asylees Annual Flow Report. Washington, DC: Department of Homeland Security Office of Immigration Statistics. Available online.
Department of Homeland Security (DHS), Office of Immigration Statistics. 2022. 2020 Yearbook of Immigration Statistics. Washington, DC: DHS Office of Immigration Statistics. Available online.
---. 2022. Secretary Mayorkas Designates Ukraine for Temporary Protected Status for 18 Months. Press release, March 3, 2022. Available online.
Gibson, Campbell J. and Kay Jung. 2006. Historical Census Statistics on the Foreign-born Population of the United States: 1850-2000. Working Paper No. 81, U.S. Census Bureau, Washington, DC, February 2006. Available online.
Ohio History Central. N.d. Ukrainian Ohioans. Accessed May 19, 2022. Available online.
Rivera, Salvador. 2022. Ukrainians Told No More Crossings on Foot into U.S. Through Ports of Entry. Border Report, April 22, 2022. Available online.
---. 2022. New Rules in Effect for Ukrainians Trying to Enter U.S. Border Report, April 25, 2022. Available online.
Satzewich, Vic. 2002. The Ukrainian Diaspora. London: Routledge, 2002.
Ukrainian American Media, UAPOST.US. 2022. The History of Ukrainian Immigration to the US. May 5, 2022. Available online.
United Nations. 2022. Ukraine: Millions of Displaced Traumatised and Urgently Need Help, Say Experts. Press release May 5, 2022. Available online.
U.S. Census Bureau. 2020. 2019 American Community Survey. Accessed from Steven Ruggles, Katie Genadek, Ronald Goeken, Josiah Grover, and Matthew Sobek. Integrated Public Use Microdata Series: Version 11.0 [dataset]. Minneapolis: University of Minnesota. Available online.
---. 2020. 2019 American Community Survey. American FactFinder. Available online.
U.S. Citizenship and Immigration Services (USCIS). 2022. Count of Active DACA Recipients by Month of Current DACA Expiration as of December 31, 2021. Available online.
---. 2022. DHS Announces Registration Process for Temporary Protected Status for Ukraine and Sudan. News release, April 18, 2022. Available online.
---. 2022. Uniting for Ukraine. Updated May 6, 2022. Available online.
U.S. Customs and Border Protection (CBP). 2022. Nationwide Encounters. Available online.
White House. 2022. FACT SHEET: The Biden Administration Announces New Humanitarian, Development, and Democracy Assistance to Ukraine and the Surrounding Region. Fact sheet, March 24, 2022. Available online.
World Bank Prospects Group. 2021. Annual Remittances Data, May 2021 update. Available online.