

Temporary Visa Holders in the United States

Tourists in Times Square, New York City. Temporary visitors for pleasure are one of the largest groups of nonimmigrants in the United States. (Photo: Roy/Flickr)
Editor's Note: This article was revised on April 23, 2021, to clarify that the category of international students also included exchange visitors.
Foreign nationals who receive a visa to travel to the United States temporarily for a specific purpose, such as tourists, international students, temporary workers, and short-term business travelers are broadly classified as nonimmigrant visa holders. In fiscal year (FY) 2018, the U.S. State Department issued 9 million temporary visas to nonimmigrants, a 7 percent decrease from a year earlier.
Indeed, visa issuance has declined in recent years: after the U.S. government granted nearly 11 million temporary visas in FY 2015 (a record high since FY 2000), the number dropped by 17 percent in FY 2018 (see Figure 1). In addition, the number of visa applications that were initially refused has risen slightly: in FY 2018, 29 percent of visa applications were found ineligible, compared to 22 percent in FY 2015. Prior to FY 2015, sharp declines in nonimmigrant visas issued were recorded during the 2007-09 recession and following the September 11, 2001 terrorist attacks.
The recent decline may be explained in part by the Trump administration’s immigration priorities: a series of executive orders and policies have tightened admission and visa issuance criteria. Among them: additional vetting procedures for certain nonimmigrants seeking to obtain or extend their visa; restricted definitions of certain specialty occupations for temporary workers; a ban on visas for nationals of seven predominantly Muslim-majority countries deemed to represent security threats (often referred to as the “travel ban”); and visa sanctions against countries that fail or refuse to facilitate the return of their nationals ordered deported from the United States. The decline may also owe to a perception that the United States has become a less welcoming place, amid rapid policy change and at-times harsh rhetoric, including by leading government officials, against immigrants.
These changes have also been cited as one of the reasons for the decline in new international student enrollment at U.S. colleges and universities, which dropped for the third year in a row. Other factors include diminished government funding by countries such as Saudi Arabia and Brazil for their citizens to study abroad; changing policies in Australia, Canada, Japan, and China, among others, to increase recruitment of international students; and stepped-up efforts by traditional sending countries such as China, India, and Malaysia to offer higher-quality education at home.
Figure 1. Annual Number of Nonimmigrant Visas Issued, FY 2000-18
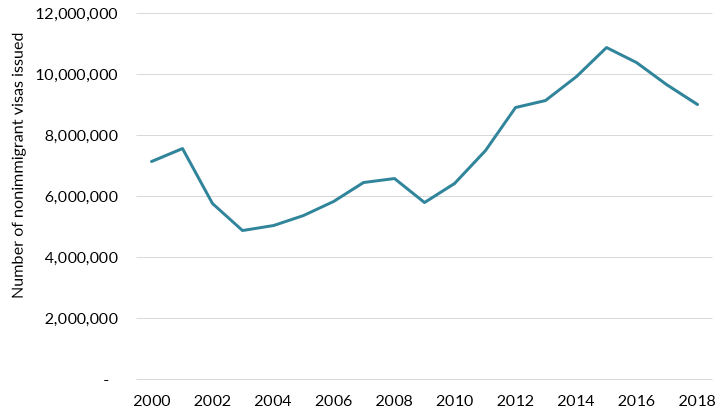
Source: U.S. State Department, Bureau of Consular Affairs, “Nonimmigrant Visa Statistics,” various years, accessed November 15, 2019, available online.
Drawing on data from the State Department and DHS, this Spotlight examines trends in visa issuance and admission, and provides information on temporary visa holders in the United States, including top countries of origin and the three top visa categories: visitors for pleasure or business, temporary workers, and international students and exchange visitors.
Note: All yearly data are for the government’s fiscal year (October 1 through September 30).
Click on the bullet points below for more information:
- Visa Issuance and Admission Trends
- Countries of Origin
- Temporary Visitors
- International Students and Exchange Visitors
- Temporary Workers
Visa Issuance and Admission Trends
State Department data on visas issued do not represent the total number of people entering the country or the overall nonimmigrant population in the United States in a particular year because the nonimmigrant’s arrival may not occur within the same year in which he or she received the visa. Also, visa data do not capture the arrival of nonimmigrants who are eligible for visa-free travel. Currently, nationals of 39 countries (including most European Union Member States, Australia, Brunei, Chile, and South Korea, to name a few) can enter the United States for up to 90 days for tourism or business purposes through the Visa Waiver Program. And finally, some nonimmigrant visas, such as the H-1B visa, are issued for periods of more than a year.
Visa issuance has steadily declined since 2015, even as overall nonimmigrant admissions have risen (compare Figures 1 and 2). The State Department issued 9 million temporary visas in FY 2018, down by 7 percent from 9.7 million issued in FY 2017. In contrast, 81 million I-94 nonimmigrant admissions were recorded by DHS in FY 2018, a 5 percent increase from FY 2017. This divergence can be explained in part by increased travel of nonimmigrants with issued visas and nationals from countries in the Visa Waiver Program.
Figure 2. Total and I-94 Nonimmigrant Admissions, FY 2000-18
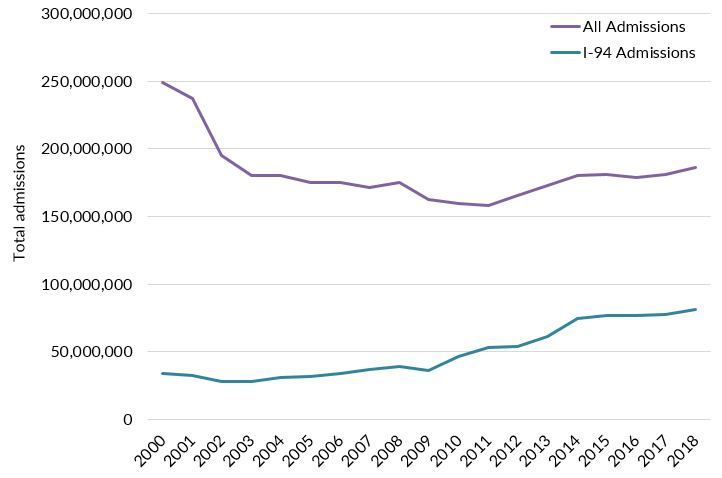
Note: I-94 admissions data collection changed in 2010, allowing land crossings that were previously excluded to be counted. Additionally, since 2013, I-94 automation at air and sea ports increased the number of admissions recorded in the I-94 data. Click here to learn more.
Source: U.S. Department of Homeland Security (DHS), Yearbook of Immigration Statistics (Washington, DC: DHS Office of Immigration Statistics, various years), accessed November 19, 2019, available online.
Nationals of mainland China, Mexico, and India made up approximately 43 percent of nonimmigrant visas issued by the State Department in FY 2018. Brazil, Argentina, the Philippines, Colombia, Israel, Ecuador, and Nigeria rounded out the top ten. The nationals of the top ten countries accounted for 64 percent of temporary visas issued in FY 2018.
Mexico was the top country for temporary visas from FY 2000 through FY 2013, after which it was overtaken by China, which has since remained the leading country for nonimmigrant visas. Chinese tourism has exploded in the last decade, with tourist visas issued to Chinese nationals peaking in 2015. Tourism from China to the United States has fallen somewhat in recent years as Chinese are increasingly visiting other countries.
The drop in temporary visa issuance seen since the peak in FY 2015 is reflected in the top countries whose nationals get visas. Brazil saw the largest absolute drop of 445,000 visas (41 percent) from FY 2014 to FY 2018, while Colombia experienced the largest proportional drop, decreasing by 49 percent (225,500 visas). Historic leading countries China and Mexico also saw decreases of 17 percent and 7 percent, respectively.
Between FY 2014 and FY 2018, temporary visas issued to Argentineans increased 47 percent and for Filipinos 33 percent. Indians witnessed a 25 percent increase during that time, but nearly all of that growth (19 percent) happened between 2014 and 2015. India has seen a slower increase in visas since FY 2015.
Figure 3. Annual Number of Temporary Visas Issued, Top Seven Sending Countries, FY 2014-18
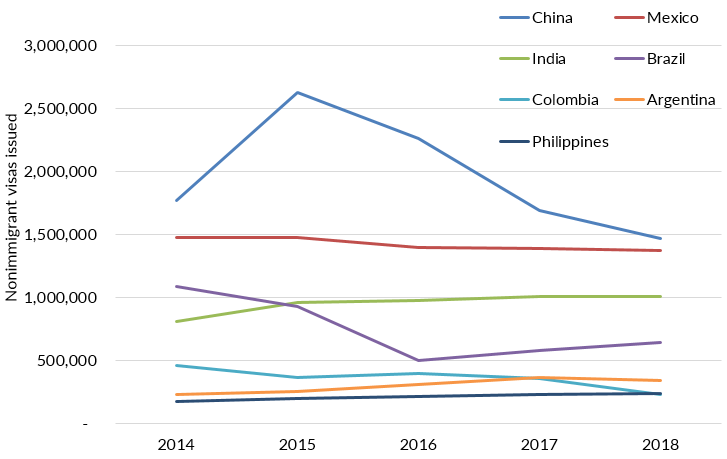
Source: U.S. State Department, Bureau of Consular Affairs, “Nonimmigrant Visa Issuances by Visa Class and by Nationality,” various years, accessed November 15, 2019, available online.
The Travel Ban Impact
Another change contributing to the overall FY 2018 drop in visas issued stems from the Trump administration’s 2017 travel ban, which affected Iran, Libya, North Korea, Somalia, Syria, Venezuela, and Yemen. The overall number of visas issued to nationals of these seven countries declined by 79 percent between FY 2016 and 2018 (from 204,500 to 43,700). Venezuela witnessed the largest drop in visas issued to their nationals following the travel ban: from 156,400 in FY 2016 to 28,500 in FY 2018, or 82 percent. Similarly, Iraq (80 percent), Yemen (78 percent), and Syria (77 percent) also saw a decline in U.S. temporary visas issued to their nationals. Chad, Iraq, and Sudan were left out of the final version of the ban, but as a group, these countries also experienced a decline in visas issued (32 percent between FY 2016-18).
Changes toward Cuban Nationals
FY 2018 saw the lowest numbers of visas issued to Cuban citizens in more than a decade, the result of the Trump administration’s rollback of the Obama administration’s efforts to normalize relations with Cuba. Amid new restrictions on travel by land and sea from Cuba, Cuban temporary visa issuance fell to just under 7,000 in FY 2018, down from 16,300 the year before and 41,000 in FY 2014.
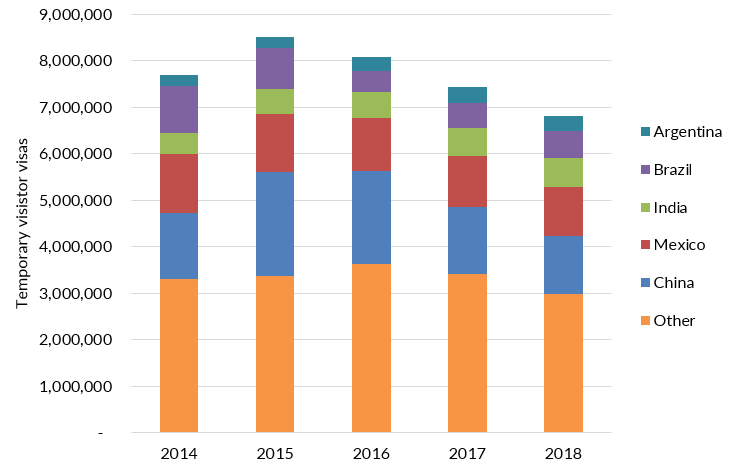
Temporary visitors to the United States for pleasure or for business have historically been the largest group of nonimmigrants. Most tourists and business travelers can enter the country with a B visa (or through the Visa Waiver Program, if their country is eligible). In FY 2018, 6.8 million temporary tourism or short-term business visitor visas were issued, representing 75 percent of the total 9 million visas issued.
One-third of these visas were issued to Chinese (18 percent of overall temporary visitor visas) and Mexicans (15 percent) in FY 2018. Combined, the top five countries receiving temporary visitor visas, which also include India, Brazil, and Argentina, made up more than half of all visas issued for tourists and business travelers that year.
The overall decline in temporary visas issued has been driven primary by the significant drop in the number of visas issued to tourists and business visitors, with a 20 percent decline between FY 2015 and 2018.
Figure 4. Annual Number of Temporary Visas Issued for Tourism/Business, Study, and Work, FY 2008-18
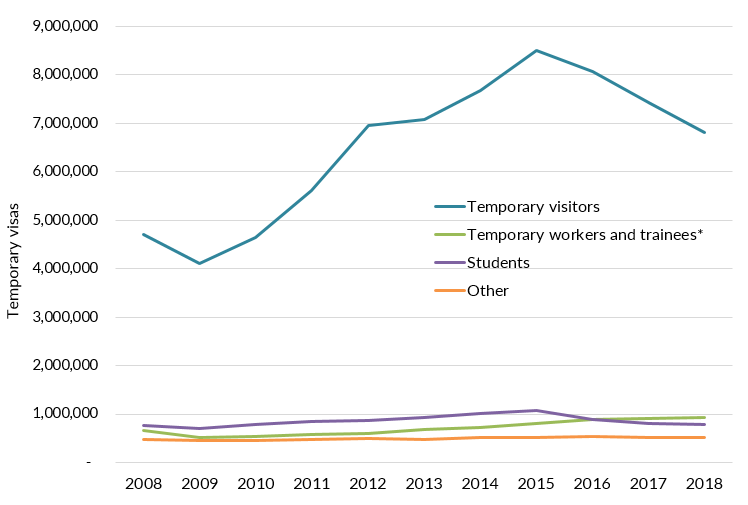
Source: U.S. State Department, Bureau of Consular Affairs, “Nonimmigrant Visa Issuances by Visa Class and by Nationality,” various years, accessed November 15, 2019, available online.
The number of visitor visas issued to Chinese nationals dropped by 44 percent between FY 2015 and 2018 (see Figure 5). Fewer visas were issued to Brazilians and Mexicans as well, with declines of 33 percent and 16 percent, respectively. In contrast, visitor visas issued to Argentine and Indian nationals went up (37 percent and 12 percent, respectively).
Figure 5. Annual Number of Temporary Visitor Visas Issued, Total and Top Five Nationalities, FY 2014-18
Source: U.S. State Department, Bureau of Consular Affairs, “Nonimmigrant Visa Issuances by Visa Class and by Nationality,” various years, accessed November 15, 2019, available online.
International Students and Exchange Visitors
Foreign students and exchange visitors are those enrolled in academic or language-training programs (F-1 visa), vocational students (M-1 visa), Mexicans or Canadians who commute to academic or language-training (F-3 visa) or vocational or nonacademic programs (M-3 visa), and exchange visitors (J-1 visa), as well as their spouses and minor children. The J visa category includes college and university students as well as physicians, summer work-travel visitors, visiting professors, research and short-term scholars, teachers, and au pairs.
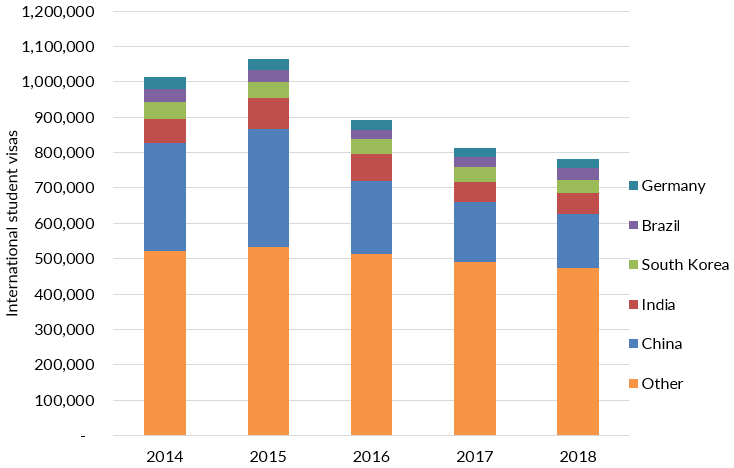
More than 781,000 international student and exchange visitor visas were issued in FY 2018 (including to students' spouses and minor children), representing 10 percent of all 9 million temporary visas issued. This marked a decline of 27 percent from the estimated 1 million student and exchange visitor visas issued just three years earlier.
The top five countries for international students and exchange visitors in the United States were mainland China, India, South Korea, Brazil, and Germany, representing 39 percent of all such visas issued in FY 2018. Prior to 2016, Saudi Arabia was regularly among the top five. But in both FY 2017 and 2018 Saudi student and exchange visitor visas lowered to a level not seen since 2009, largely because the Saudi government restricted the availability of government scholarships to study abroad.
Of the current top five, each of these countries saw a decline in student and exchange visitor visas between FY 2015 and FY 2018, ranging from a 54 percent drop for Chinese, 35 percent for Indians, and 1 percent for Brazilians.
Figure 6. Annual International Student and Exchange Visitor Visa Issuance, Total and Top Five Countries of Nationality, FY 2014-18
Source: U.S. State Department, Bureau of Consular Affairs, “Nonimmigrant Visa Issuances by Visa Class and by Nationality,” various years, accessed November 15, 2019, available online.
Other data confirm the drop in international students. New enrollment of foreign students at U.S. universities stood at about 269,400 in the 2018-19 school year, down 10 percent from 300,700 in 2015-16, according to the Institute of International Education’s Open Doors report. This marked the third year of declines in new enrollment, even as Australia, Canada, and other traditional destinations for international students have increased over the same period.
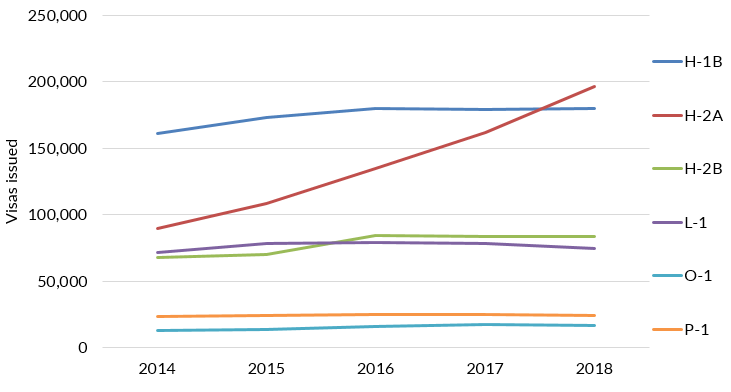
Temporary workers and trainees include workers in specialty occupations (H-1B visa), seasonal agricultural workers (H-2A), seasonal nonagricultural workers (H-2B and H-2R), workers with extraordinary ability or achievements (O-1 and O-2), athletes and artists (P-1, P-2, and P-3), intracompany transferees (L-1), treaty traders and investors (E-1, E-2, and E-3), people working for employers in the Commonwealth of the Northern Mariana Islands and their immediate families (CW-1 and CW2), representatives of foreign information media (I-1), workers in international cultural exchange programs (Q-1), workers in religious occupations (R-1), and TN visas reserved for Canadian and Mexican professionals, as well as their spouses and minor children.
While there is no cap for the total number of temporary workers, there are annual limits on two visa categories: H-1B visas are capped at 85,000 visas per fiscal year (with some exceptions; visas sought by universities and research organizations do not count against the cap) and the H-2B visa for seasonal and temporary nonagricultural work (such as landscapers, crab pickers, life guards, or resort workers) are limited to 66,000 visas annually.
Since 2016 the number of visas issued for these groups of foreign workers either has remained largely flat or increased slightly (see Figure 7). The only visa category that bucks this trend is the H-2A category that grew rapidly between 2014 and 2018.
Figure 7. Selected Temporary Worker Visas Issued, FY 2014-18
Source: State Department, “Table XVI (B) Nonimmigrant Visas Issued by Classification (Including Border Crossing Cards): Fiscal Years 2014 – 2018,” Report of the Visa Office 2018, available online.
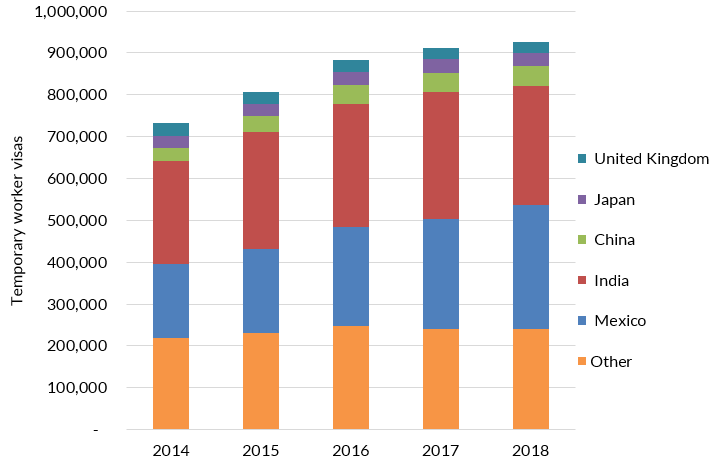
Unlike for temporary visitors and international students, temporary worker visa issuance has been on an upward trend: The number increased from 732,000 in FY 2014 to 911,000 in 2017 and to 925,000 in 2018. The small uptick in the total temporary worker visas issued between 2017 and 2018 is mostly due to the increase in visas issued to Mexican and Chinese workers, whose number increased by 13 percent and 6 percent, respectively (see Figure 8). In contrast, the number of temporary worker visas issued to Indians, Japanese, and nationals of the United Kingdom declined (by 6 percent, 5 percent, and 1 percent, respectively).
Figure 8. Annual Number of Temporary Worker Visa Issued, Total and Top Five Nationalities, FY 2014-18
Source: U.S. State Department, Bureau of Consular Affairs, “Nonimmigrant Visa Issuances by Visa Class and by Nationality,” various years, accessed November 15, 2019, available online.
Sources
Institute of International Education (IIE). 2018. Project Atlas: Infographics and Data. Washington, DC: IIE. Available online.
---. 2018. A World on the Move. Trends in Global Student Mobility, Issue 2, Washington, DC: IIE. Available online.
---. 2019. Open Doors 2019. Washington, DC: IIE. Available online.
Navarro, Waleed. 2019. U.S. Nonimmigrant Admissions: 2018, Annual Flow Report. Washington, DC: U.S. Department of Homeland Security, 2019. Available online.
Selyukh, Alina. 2019. Visits to the U.S. by Chinese Tourists Are Declining. National Public Radio, October 28, 2019. Available online.
U.S. Department of Homeland Security (DHS), Office of Immigration Statistics. 2017. Nonimmigrant Classes of Admission. Available online.
---. 2018. Definition of Terms. Available online.
---. Various years. Annual Flow Report: Nonimmigrant Admissions to the United States. Washington, DC: DHS, Office of Immigration Statistics. Available online.
---. Various years. Yearbook of Immigration Statistics. Washington, DC: DHS Office of Immigration Statistics. Available online.
U.S. State Department, Bureau of Consular Affairs. 2018. Nonimmigrant Visa Issuances by Visa Class and by Nationality. Available online.
---. Various years. Report of the Visa Office. Accessed December 3, 2019. Available online.
---. N.d. Visa Waiver Program. Accessed December 3, 2019. Available online.