
COVID-19 and Unemployment: Assessing the Early Fallout for Immigrants and Other U.S. Workers

Even as the pandemic-induced loss of tens of millions of jobs over a period of weeks dealt a devastating blow across the United States, its effects were most pronounced on certain demographic groups: Immigrant women and, regardless whether they were born in or outside the United States, Latinos and workers with less than a high school degree or under age 25.
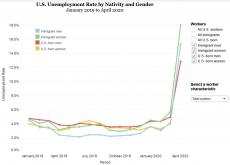
In April 2020, Latina immigrants had the highest jobless rate of all racial and ethnic groups: 22 percent. Overall, and regardless of their educational level, immigrant women of every major racial/ethnic group—with the exception of those who are Black—had higher unemployment rates than men.
Data Tool: Mapping Shifting Unemployment by Group
Check out this data tool to explore unemployment rates for immigrants and other U.S. workers before and since the COVID-19 pandemic began. In addition to nativity and gender, this tool allows you to break down trends by race/ethnicity, educational attainment, and industry, and to compare unemployment for different groups over time.
With the U.S. unemployment rate nearly hitting 15 percent in April, joblessness has been especially high among young workers and those without a high school degree, immigrant and U.S. born alike.
This fact sheet and an accompanying interactive data tool offer an analysis of unemployment by nativity, gender, race/ethnicity, age, education, and industry of employment, using U.S. Census Bureau data to compare unemployment rates before the COVID-19 outbreak and April 2020.
The fact sheet contrasts the coronavirus-related labor market dislocations with the last recession, in 2008-09. Then, as now, immigrants have been among the hardest hit early on because of their relative youth and lower levels of formal education. However, the MPI analysis finds a more significant reason for the current disproportionate impact on immigrants: Their concentration in hard-hit service industries such as retail trade and leisure and hospitality.
1 Introduction
2 Unemployment Trends by Nativity and Gender
3 Unemployment Trends by Race and Ethnicity
4 Unemployment Trends by Educational Attainment
5 Unemployment Trends by Age
6 Unemployment Trends by Industry
7 Conclusions


