

Green Card Holders and Legal Immigration to the United States
Source Spotlights are often updated as new data become available. Please click here to find the most recent version of this Spotlight.
Much of the discussion surrounding immigration and immigrants these days is focused on the negative: the issue of illegal immigration with roughly 11 million unauthorized immigrants residing across the nation, problems surrounding the immigrant detention system, and highly contested state-level immigration legislation, to name a few examples.
It's easy to forget, perhaps, that the majority of immigrants in the country are lawful permanent residents and U.S. citizens. As of January 2010, an estimated 12.6 million green card holders resided in the United States, about 8.1 million of whom were eligible to naturalize as citizens.
This Spotlight takes a close look at the 2010 statistics on foreign nationals admitted for and adjusted to lawful permanent residence (LPR).
This Spotlight uses data from The Yearbook of Immigration Statistics, one of the most commonly used publications on U.S. immigration statistics, published by the Department of Homeland Security's (DHS) Office of Immigration Statistics (OIS).
The Yearbook presents inflow statistics on foreign nationals who, during a fiscal year:
- were granted lawful permanent residence (i.e., immigrants);
- applied for and/or were granted refugee/asylee status;
- were admitted on a temporary basis (i.e., nonimmigrants);
- acquired U.S. citizenship (i.e., naturalized).
The Yearbook also presents information about Homeland Security's immigration law enforcement activities during the fiscal year. Note: all yearly data is for the government's fiscal year (October 1 through September 30). All data are from OIS unless otherwise noted.
Click on the bullet points below for more information:
- According to U.S. immigration law, immigrants are persons lawfully admitted for permanent residence in the United States.
- The law provides for three general immigrant categories: family reunification, employment sponsorship, and humanitarian cases (refugee and asylum adjustments).
- The total yearly inflow of immigrants in these categories is composed of both new arrivals to the United States and status adjusters.
- The number of new arrivals remained relatively stable at about 420,000 annually between 1986 and 2010.
- During 2010, more than 1 million people were granted lawful permanent resident status.
- Family reunification accounted for 66 percent of all lawful permanent immigration in 2010.
- Employment-preference immigrants made up 14 percent of all lawful permanent immigration in 2010.
- In 2010, about 13 percent of all lawful permanent residents were status adjusters who entered as refugees or asylees.
- There were about 67,000 "other immigrants" in 2010.
- The U.S. Department of State received more than 12.1 million qualified applications for the 2011 green card lottery.
- Mexico, China, India, the Philippines, and the Dominican Republic were the top five countries of birth of new lawful permanent residents in 2010.
- California, New York, Florida, Texas, New Jersey, and Illinois were the key destinations for LPRs in 2010.
- In 2010, an estimated 8,070,000 lawful permanent residents were eligible for naturalization.
According to U.S. immigration law, immigrants are persons lawfully admitted for permanent residence in the United States.
Also known as green-card holders, immigrants are persons lawfully admitted for permanent residence in the United States. The Department of Homeland Security Office of Immigration Statistics (OIS) also refers to immigrants as aliens who are granted lawful permanent residence (LPR), aliens admitted for lawful permanent residence, immigrants admitted, and admissions.
In contrast, foreign students, H-1B workers, and tourists are part of the large category of temporary nonimmigrant admissions.
The law provides for three general immigrant categories: family reunification, employment sponsorship, and humanitarian cases (refugee and asylum adjustments).
The majority of people who wish to obtain lawful permanent residence or a green card in the United States qualify because they are a family member of a U.S. citizen or lawful permanent resident, the employee of a U.S. company, or a refugee or asylum seeker who has been granted protection in the United States.
The total yearly inflow of immigrants in these categories is composed of both new arrivals to the United States and status adjusters.
The number of all immigrants admitted to the country shown in the immigration statistics tables consists of two different flows. One is newly arrived lawful permanent residents — people who were issued immigrant visas by the Department of State overseas. The other is status adjusters — people who enter the United States with one legal status and then adjust or change to permanent residence while in the country.
A person, for example, might arrive in the United States on an H-1B temporary worker visa. If her company chooses to sponsor her for permanent residence, the employer can petition U.S. Citizenship and Immigration Services (USCIS) for a green card on behalf of the worker under an employment-preference visa. If she meets the criteria and if annual, numerical ceilings for employment-preference visas have not been met, she would receive a card stating she is lawfully admitted for permanent residence. She would then be counted as a status adjuster for that year.
The number of new arrivals remained relatively stable at about 420,000 annually between 1986 and 2010.
Although the number of adjustments has greatly varied between 1986 and 2010, the number of new arrivals has remained relatively stable with about 420,000 on average per year (see Figure 1). Changes in immigration legislation, application and visa processing times, and backlogs at the former Immigration and Naturalization Service (INS) and the current USCIS are primarily responsible for wide fluctuations in the total numbers.
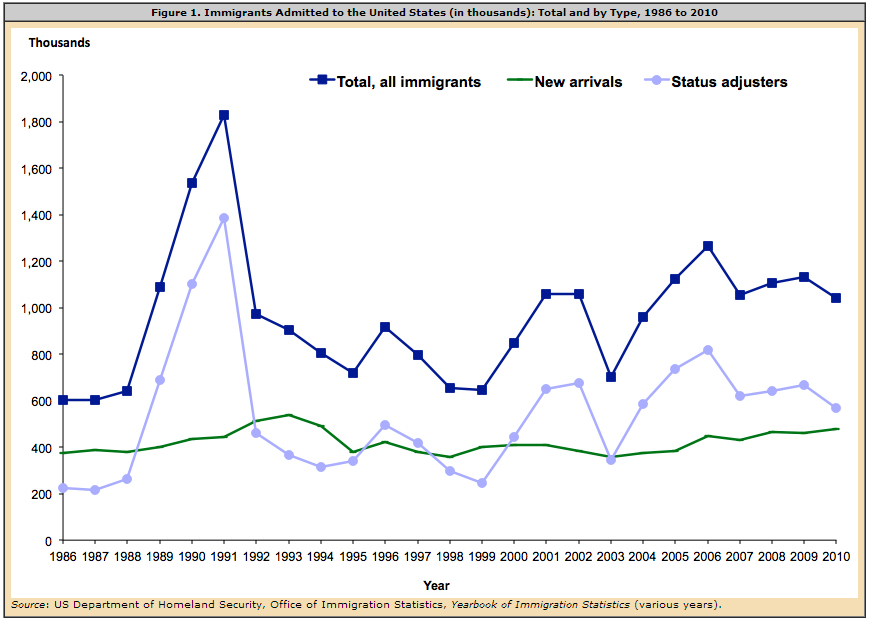
During 2010, more than 1 million people were granted lawful permanent resident status.
There were 1,042,625 immigrants who were granted legal residence in 2010. Of those, 476,049 (45.7 percent) were new arrivals who entered the country in 2010, and 566,576 (54.3 percent) were status adjusters. The status adjusters arrived in the United States in any year before 2010, but their green card applications were approved during 2010.
Family reunification accounted for 66 percent of all lawful permanent immigration in 2010.
Immigrants who obtained green cards as spouses, children under the age of 21, or parents of U.S. citizens (476,414) or as immediate family of lawful permanent residents and certain other family members of U.S. citizens (214,589) accounted for 66.3 percent of all lawful permanent immigrants (see Figure 2). During the last decade, family-based immigration has accounted for about two-thirds of total lawful permanent immigration.
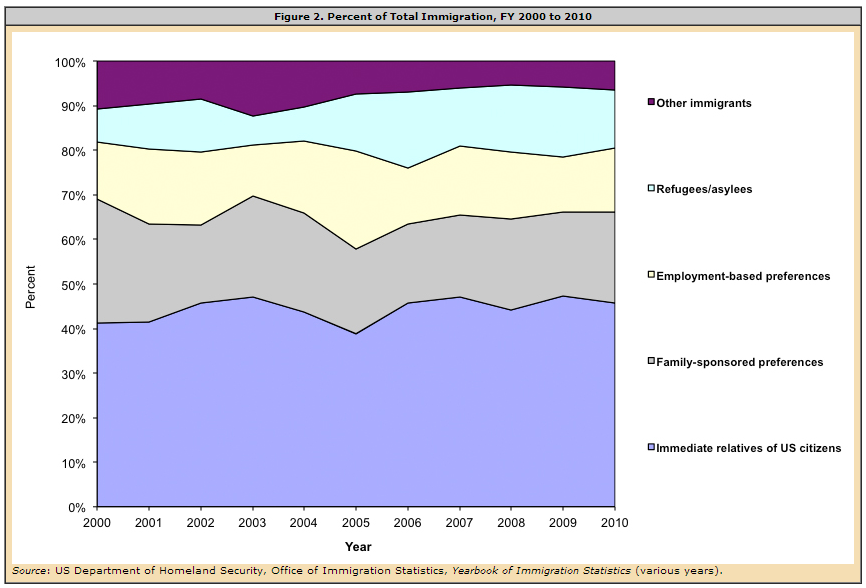
Employment-preference immigrants made up 14 percent of all lawful permanent immigration in 2010.
The 148,343 immigrants who received green cards through sponsorship from their U.S. employers accounted for 14.2 percent of all LPRs.
The share of employment-preference immigrants is significantly smaller than that of family-based immigrants and has varied between 8.8 percent (56,678) in 1999 and 22 percent (246,878) in 2005 (see Figure 2).
Similar to the past, immediate family members accounted for more than half of employment-based immigrants. In 2010, 54.8 percent (or 81,354) of employment-sponsored immigrants were spouses and children of principal applicants.
In 2010, about 13 percent of all lawful permanent residents were status adjusters who entered as refugees or asylees.
(Note: these figures refer to those refugees and asylees who adjusted their status to lawful permanent resident in 2010. They do not refer to the numbers and percentages of refugee and asylum applicants granted refugee or asylum status in 2010. Read more on the latter here.
The 92,741 refugees and 43,550 asylees who adjusted their status to LPR in 2010 constituted 13.1 percent of all lawful permanent immigrants.
The number and percentage of refugee and asylee adjustments of status varied significantly between 2000 and 2010, from a low of 6.4 percent (44,764) in 2003 to a high of 17.1 percent (216,454) in 2006 (see Figure 2).
Refugees are eligible to adjust to LPR status without regard to numerical limit after one year of residence in the United States. Similarly, asylees have to wait one year after they are granted asylum to apply for LPR status. Until 2005, there was a limit of 10,000 asylee adjustments per year. The REAL ID Act of 2005 (enacted into law in May of that year) eliminated this numerical limit. The number of asylee adjustments in 2010 (43,550) was more than four times higher than in 2004 (10,217).
There were about 67,000 "other immigrants" in 2010.
Less numerous groups of immigrants, including persons and their dependents who legalized under the Immigration Reform and Control Act (IRCA) of 1986, parolees, and green card lottery winners, are examples of "other immigrants" who are eligible for LPR status. In 2010, there were 66,988 "other immigrants" who accounted for 6.4 percent of all lawful permanent immigrants.
Seventy-four percent of the "other immigrants" in 2010 (49,763) were people who received their immigrant visas through the green card lottery — officially the Diversity Immigrant Visa Program — run by the U.S. Department of State.
The U.S. Department of State received more than 12.1 million qualified applications for the 2011 green card lottery.
The Immigration Act of 1990 established the Diversity Immigrant Visa Program (the green card lottery) to allow entry to immigrants from countries with low rates of immigration to the United States. No more than 55,000 diversity visas are made available each fiscal year. Of the 55,000 visas, 5,000 have to be used for applicants under the Nicaraguan and Central America Relief Act of 1997, thus reducing the available number for most applicants to 50,000.
Successful applicants who registered for the 2011 lottery between early October and November 2009 were selected at random from over 12.1 million qualified entries. The number of qualified entries totaled 13.6 million in the 2010 lottery, 9.1 million in the 2009 lottery, and 6.4 million in the 2008 lottery. The U.S. Department of State does not release the total number of applications received.
The visas are divided among six geographic regions — Africa, Asia, Europe, North America, Oceania, South/Central America, and the Caribbean — with no single country receiving more than 7 percent of the available diversity visas in any one year. Nationals of countries with high rates of immigration to the United States such as Brazil, China (mainland-born, excluding Hong Kong and Taiwan), El Salvador, Guatemala, Haiti, India, Jamaica, Pakistan, the Philippines, and South Korea were not eligible to participate in the 2011 lottery.
Before receiving permission to immigrate to the United States, lottery winners must provide proof of a high school education or its equivalent, or show two years of work experience within the past five years in an occupation that requires at least two years of training or experience. They also have to pass a medical exam.
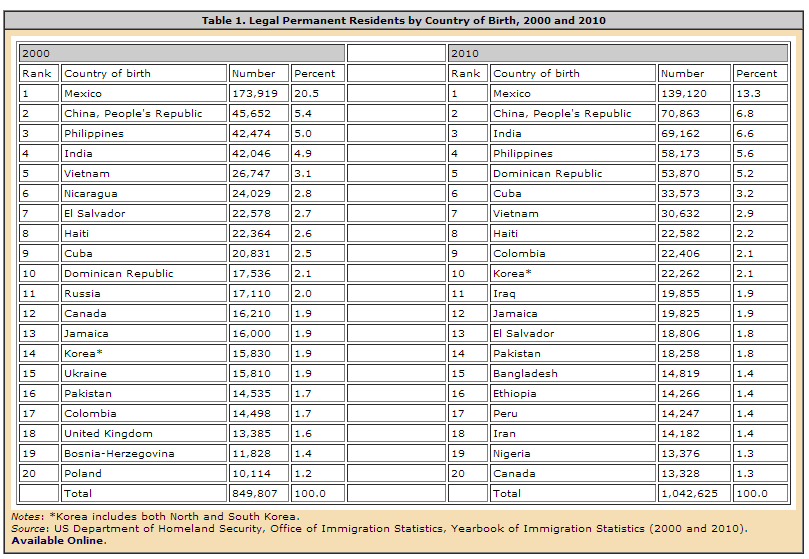
Mexico, China, India, the Philippines, and the Dominican Republic were the top five countries of birth of new lawful permanent residents in 2010.
The top five countries of birth — Mexico, China, India, the Philippines, and the Dominican Republic — accounted for 37.5 percent of all persons who received LPR status in 2010. Nationals of the next five countries — Cuba, Vietnam, Haiti, Colombia and Korea — comprised another 12.6 percent of all LPRs. In all, the top 10 leading countries of birth made up 50.1 percent of the total (see Table 1).
As in 2000, the top 20 countries of birth in 2010 accounted for about two-thirds of all LPRs (see Table 1). Fourteen of the 20 countries on the list in 2010 were also on the 2000 list. Nicaragua, Russia, Ukraine, the United Kingdom, Bosnia-Herzegovina, and Poland dropped off the list, while Iraq, Bangladesh, Ethiopia, Peru, Iran, and Nigeria joined it.
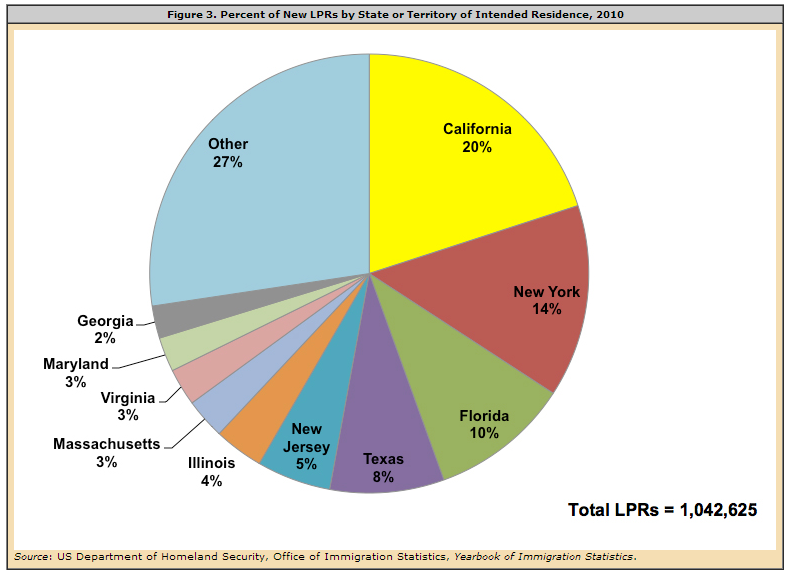
California, New York, Florida, Texas, New Jersey, and Illinois were the key destinations for LPRs in 2010.
California was the intended state of residence for 20 percent of the 1 million new LPRs in 2010. Other leading states of intended residence included New York (14.2 percent), Florida (10.3 percent), Texas (8.4 percent), New Jersey (5.5 percent), and Illinois (3.6 percent). The top 10 states of destination — which also included Massachusetts, Virginia, Maryland, and Georgia — accounted for 72.6 percent of all LPR destinations (see Figure 3).
In 2010, an estimated 8,070,000 lawful permanent residents were eligible for naturalization.
According to the latest available OIS estimates, there were 12.6 million LPRs who resided in the United States as of January 1, 2010. Of them, about 8.1 million were eligible to naturalize.
Sources
The Yearbook of Immigration Statistics and Annual Flow Report. Available Online.
USCIS, "Estimates of the Legal Permanent Resident Population in 2010." Available Online.
Definitions of terms can be found at the website of the Office of Immigration Statistics. Available Online.
Diversity Visa Lottery 2011 (DV-2011) Results. Available Online.