

Haitian Immigrants in the United States

A Haitian-American book fair in Miami's Little Haiti neighborhood. (Photo: Mitchell Zachs/Knight Foundation)
Migration from Haiti to the United States since the mid-20th century has occurred in response to persistent political instability, persecution, frequent economic crises, natural disasters including a devastating 2010 earthquake, and the recent collapse of basic governmental functions and widespread gang violence following the 2021 assassination of President Jovenel Moïse. As of 2022, nearly 731,000 Haitian immigrants resided in the United States, comprising the country’s 15th largest foreign-born population.
For several years, there has been a significant increase in the number of Haitians arriving in the United States irregularly, particularly via land. Some came directly from Haiti, but many others arrived from Brazil, Chile, and other countries in the Americas (often bringing their children born there) where they had migrated earlier and then faced new pressures to move again. U.S. authorities encountered Haitians at the U.S.-Mexico border approximately 53,900 times in fiscal year (FY) 2022 and more than 76,100 times in FY 2023. From 2019 through 2021, Haitians were the top nationality for migrants crossing the dangerous Darien Gap between Colombia and Panama, and they have remained among the three largest groups in 2022 and 2023. Additionally, the U.S. Coast Guard interdicted nearly 7,200 Haitians at sea in FY 2022 and 5,100 in the first 11 months of FY 2023, marking dramatic increases over previous years.
Several U.S. policies have sought to channel these migrants into legal routes. The U.S. government resumed the Haitian Family Reunification Parole Program in 2022, allowing eligible Haitians with a U.S.-citizen or legal permanent resident family member to move to the United States while their green-card application is pending. In January 2023, the Biden administration extended an immigration parole program initially reserved for Venezuelans to Haitians (as well as Cubans and Nicaraguans) who have a U.S. sponsor, apply in advance, and travel by plane. The program allows parolees to reside and work in the United States for two years. Through September 2023, the 85,300 Haitian parole recipients represented the largest group of beneficiaries of this process. Also, Temporary Protected Status (TPS), which grants temporary work authorization and relief from deportation, has been redesignated and extended for Haitians, covering more than 116,500 Haitian-born individuals as of March 2023.
The nearly 731,000 Haitian immigrants residing in the United States in 2022, the most recent year for which data are available from the U.S. Census Bureau’s American Community Survey (ACS), made up 2 percent of all 46.2 million U.S. immigrants and 16 percent of the 4.6 million Caribbean immigrants. Compared to all immigrants, Haitians are more likely to be naturalized U.S. citizens, have obtained legal permanent residence (also known as getting a green card) through family-based categories, and work in service occupations. They are also less likely to have a college degree and tend to report lower household incomes.
This Spotlight provides information on the Haitian immigrant population in the United States, focusing on its size, geographic distribution, and socioeconomic characteristics.
Click on the bullet points below for more information:
- Size of Immigrant Population over Time
- Distribution by U.S. State and Key Cities
- English Proficiency
- Age, Education, and Employment
- Income and Poverty
- Immigration Pathways and Naturalization
- Unauthorized Immigrant Population
- Health Coverage
- Diaspora
- Top Global Destinations
- Remittances
Size of Immigrant Population over Time
The Haitian immigrant population has expanded significantly since 1980, although the rate of growth has slowed. The population grew 144 percent between 1980 and 1990, 86 percent between 1990 and 2000, 40 percent between 2000 and 2010, and 24 percent between 2010 and 2022. Still, the Haitian immigrant population grew much faster than the overall foreign-born population, which increased by 16 percent between 2010 and 2022. Haitians represented the fourth-largest Caribbean immigrant group in the United States, after Cubans, Dominicans, and Jamaicans.
Figure 1. Haitian Immigrant Population in the United States, 1980-2022
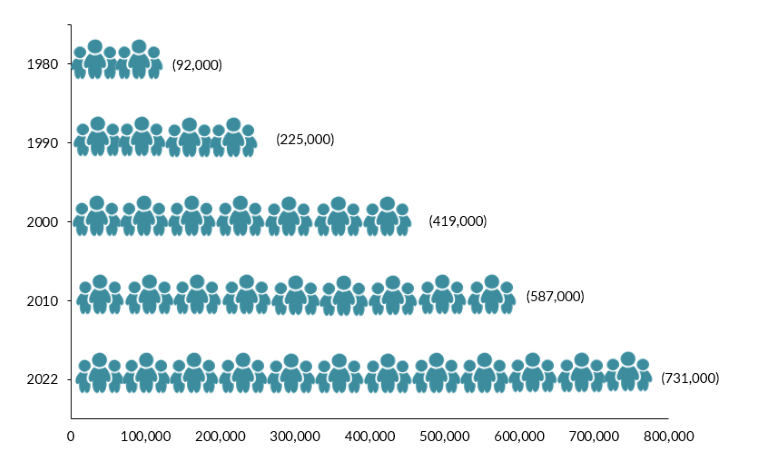
Sources: Data from U.S. Census Bureau 2010 and 2022 American Community Surveys (ACS), and Campbell J. Gibson and Kay Jung, "Historical Census Statistics on the Foreign-Born Population of the United States: 1850-2000" (Working Paper no. 81, U.S. Census Bureau, Washington, DC, February 2006), available online.
Distribution by U.S. State and Key Cities
Immigrants from Haiti are highly concentrated in Florida (49 percent as of the 2017-21 period), followed distantly by New York (19 percent). The next four states—Massachusetts, New Jersey, Pennsylvania, and Georgia—were home to approximately 21 percent of the Haitian immigrant population collectively. The top four counties for Haitian immigrants were Broward, Miami-Dade, and Palm Beach counties in Florida, and Kings County in New York. Together these counties accounted for 41 percent of Haitian immigrants in the United States.
Figure 2. Top States of Residence for Haitian Immigrants in the United States, 2017-21
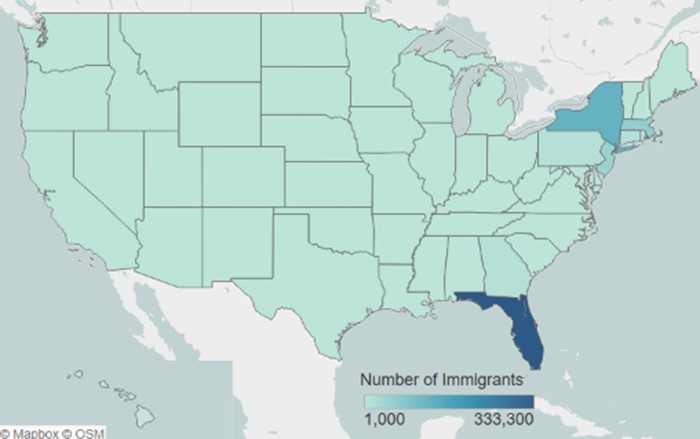
Notes: Pooled 2017-21 ACS data were used to get statistically valid estimates at the state level for smaller-population geographies. Not shown is the population in Alaska, which is small in size; for details, visit the Migration Policy Institute (MPI) Data Hub for an interactive map showing geographic distribution of immigrants by state and county, available online.
Source: MPI tabulation of data from U.S. Census Bureau pooled 2017-21 ACS.
Click here for an interactive map that highlights the states and counties with the highest concentrations of immigrants from Haiti and other countries.
The greater Miami, New York, and Boston metropolitan areas were home to 66 percent of Haitian immigrants in the United States. Slightly under 4 percent of all residents of the greater Miami area were born in Haiti (see Table 1).
Figure 3. Top Metropolitan Destinations for Haitian Immigrants in the United States, 2017-21
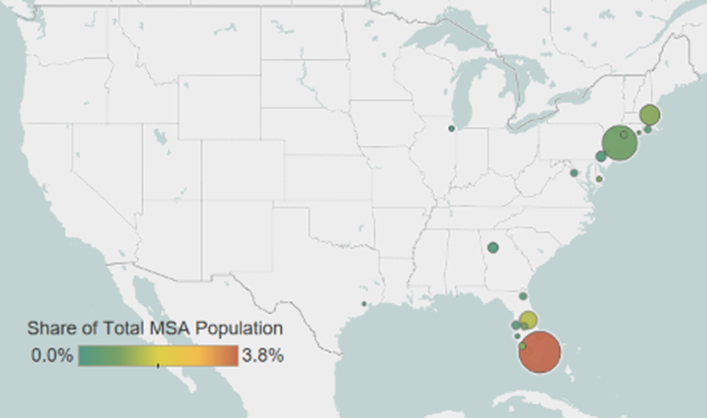
Note: Pooled 2017-21 ACS data were used to get statistically valid estimates at the metropolitan statistical-area level for smaller-population geographies.
Source: MPI tabulation of data from U.S. Census Bureau pooled 2017-21 ACS.
Click here for an interactive map that highlights the metro areas with the most immigrants from Haiti and other countries.
Table 1. Top U.S. Metropolitan Areas for Haitian Immigrants, 2017-22
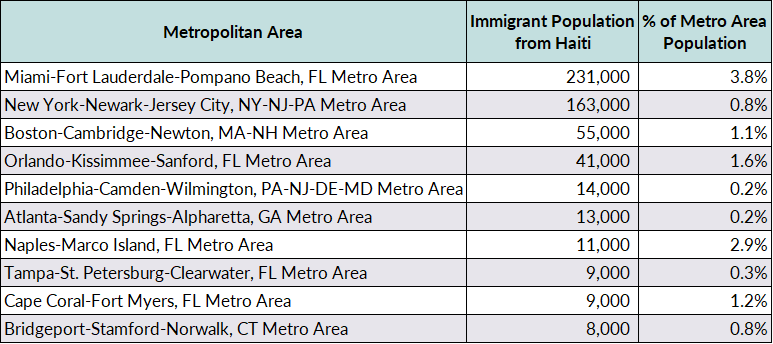
Source: MPI tabulation of data from the U.S. Census Bureau pooled 2017-21 ACS.
Haitians are roughly as likely as all immigrants to have limited proficiency in English. In 2022, 44 percent of Haitians ages 5 and older reported speaking English less than “very well,” compared to 46 percent of the total foreign-born population. Approximately 10 percent of Haitian immigrants spoke only English at home, versus 17 percent of the overall foreign born.
Age, Education, and Employment
Haitians tended to be similar in age to the overall foreign-born population and older than the U.S. born. The median age for both Haitian and total immigrants was 47 in 2022, compared to 37 for the native born. In 2022, 75 percent of the Haitian population was of working age (18 to 64) compared to 77 percent of all immigrants and 58 percent of the U.S. born (see Figure 4).
Figure 4. Age Distribution of the U.S. Population by Origin, 2022
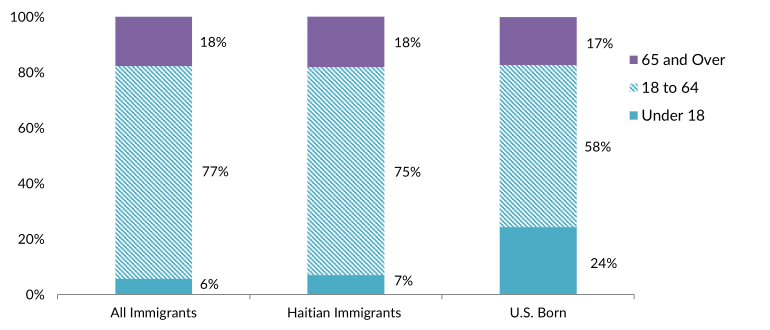
Note: Percentages may not add up to 100 as they are rounded to the nearest whole number.
Source: MPI tabulation of data from the U.S. Census Bureau 2022 ACS.
Haitian adults ages 25 and older tend to have lower educational attainment than both the native- and overall foreign-born populations. In 2022, 22 percent of Haitian immigrants reported having a bachelor’s degree or higher, compared to 36 percent of the U.S. born and 35 percent of all immigrant adults (see Figure 5). Among Haitians who arrived between 2017 and 2021, 12 percent of adults held a college degree, a rate much lower than that of all immigrants arriving in that period (47 percent).
Click here for data on immigrants’ educational attainment by country of origin and overall.
Figure 5. Educational Attainment of the U.S. Population (ages 25 and older) by Origin, 2022
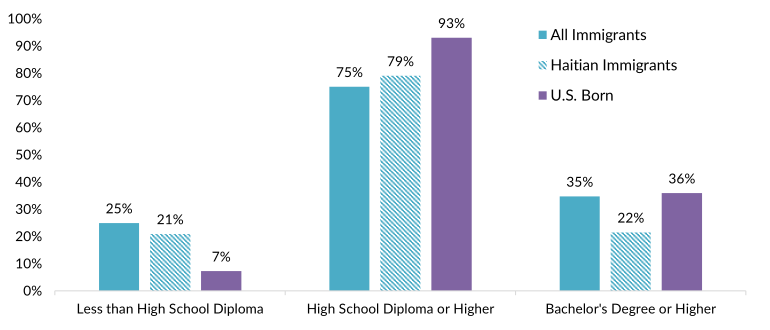
Note: Percentages may not add up to 100 as they are rounded to the nearest whole number.
Source: MPI tabulation of data from the U.S. Census Bureau 2022 ACS.
According to the Institute of International Education, more than 1,000 students from Haiti were enrolled in U.S. colleges and universities in the 2021-22 school year, comprising a small share of the 949,000 international students in the United States. Haitians represented 9 percent of the nearly 11,000 students from the Caribbean.
Haitians participate in the labor force at a similar rate as all immigrants. About 69 percent of Haitian immigrants and 67 percent of all immigrants ages 16 and over were in the civilian labor force in 2022, compared to 62 percent of the native born. Haitians are more likely than all immigrants or the U.S. born to work in service occupations (see Figure 6).
Figure 6. Employed Workers in the Civilian Labor Force (ages 16 and older) by Occupation and Origin, 2022
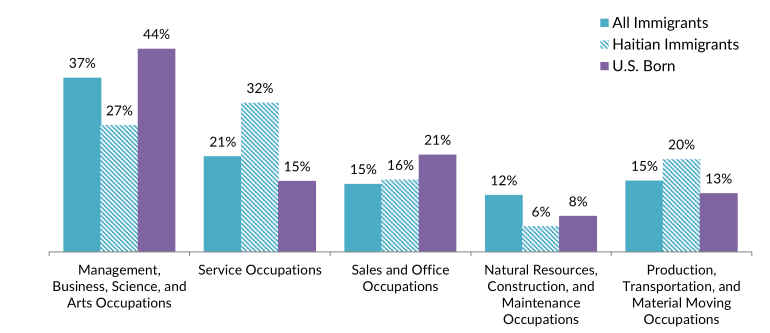
Note: Percentages may not add up to 100 as they are rounded to the nearest whole number.
Source: MPI tabulation of data from the U.S. Census Bureau 2022 ACS.
The 103,000 Haitian immigrant health-care workers as of 2021 represented the sixth largest such group in the United States, after those from the Philippines, Mexico, India, China/Hong Kong, and Jamaica. Most Haitian health-care workers are employed in health-care support occupations such as nursing assistants, personal care aides, and home health aides.
Click here for data on immigrants employed in key health-care occupations by region and country of birth.
Haitians tend to have significantly lower incomes than the overall foreign- and native-born populations. Households headed by a Haitian immigrant had a median income of $65,000 in 2022, compared to $75,000 for both all immigrant and U.S.-born households. Haitian immigrants had roughly similar poverty rates (15 percent) as immigrants overall (14 percent) and higher than the U.S. born (12 percent). (The U.S. Census Bureau defines poverty as having an income below $29,700 for a family of four in 2022.)
Immigration Pathways and Naturalization
Haitians are much more likely to be naturalized U.S. citizens than immigrants overall. In 2022, 63 percent of Haitians were U.S. citizens, compared to 53 percent of the total foreign-born population.
Compared to all immigrants, Haitians are slightly more likely to have arrived after 2010 (see Figure 7).
Figure 7. Immigrants from Haiti and All Immigrants in the United States by Period of Arrival, 2022
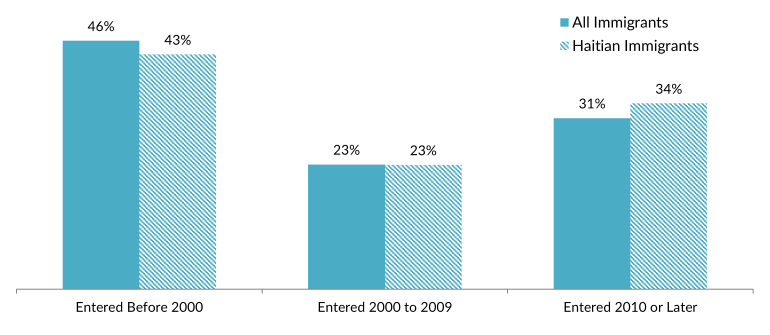
Note: Percentages may not add up to 100 as they are rounded to the nearest whole number.
Source: MPI tabulation of data from the U.S. Census Bureau 2022 ACS.
Approximately 1 percent (10,400) of the 1 million people receiving lawful permanent residence in FY 2022 were from Haiti. Most Haitians who obtain green cards do so through family reunification. In FY 2022, 91 percent of Haitians receiving a green card did so as either immediate relatives of U.S. citizens or were sponsored by other family members. By comparison, 58 percent of all new lawful permanent residents (LPRs) that year arrived through family pathways (see Figure 8). Just 3 percent of new Haitian green-card holders came through employment sponsorship and 5 percent adjusted their status from being a refugee or asylee.
Figure 8. Immigration Pathways of Haitians and All Lawful Permanent Residents in the United States, 2022
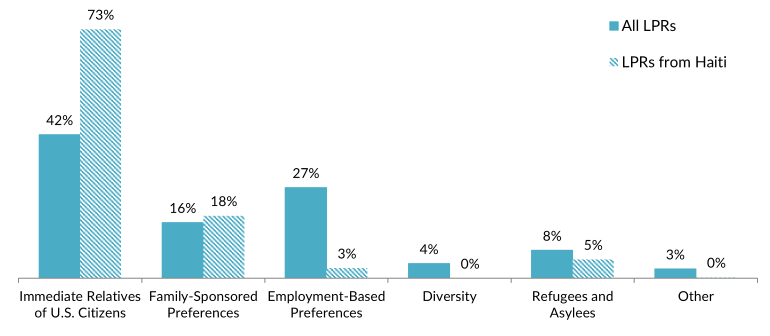
Notes: Immediate Relatives of U.S. Citizens: Includes spouses, minor children, and parents of U.S. citizens. Family-Sponsored Preferences: Includes adult children and siblings of U.S. citizens as well as spouses and children of green-card holders. The Diversity Visa lottery was established by the Immigration Act of 1990 to allow entry to immigrants from countries with low rates of immigration to the United States. The law states that 55,000 diversity visas in total are made available each fiscal year. Individuals born in Haiti were ineligible for the 2025 lottery. Percentages may not add up to 100 as they are rounded to the nearest whole number.
Source: MPI tabulation of data from Department of Homeland Security (DHS), “Table 10D: Persons Obtaining Lawful Permanent Resident Status by Broad Class of Admission and Region and Country of Birth: Fiscal Year 2022,” updated August 21, 2023, available online.
Unauthorized Immigrant Population
Devastation from a massive 2010 earthquake in Haiti prompted the Obama administration to grant TPS to Haitians already in the United States when the disaster hit. The Trump administration sought to terminate the designation, but was stymied by the courts. The attempted termination was reversed by the Biden administration, which subsequently expanded the TPS designation; as of March 2023, 116,500 Haitians held TPS. The latest extension is set to expire August 3, 2024.
Although most Haitian immigrants in the United States are legally present, approximately 99,000 were unauthorized in 2021, according to Migration Policy Institute (MPI) estimates, comprising about 1 percent of the overall estimated 11.2 million unauthorized immigrants.
Click here for an overview of the 2021 unauthorized immigrant population in the United States.
As of March 31, 2023, approximately 120 immigrants from Haiti participated in the Deferred Action for Childhood Arrivals (DACA) program, accounting for a tiny share of all 578,700 DACA recipients. DACA provides temporary deportation relief and work authorization to unauthorized immigrants who arrived as children and meet the program’s education and other eligibility criteria.
Click here to view the top origin countries of origin for DACA recipients and their U.S. states of residence.
In 2022, 17 percent of immigrants from Haiti lacked health insurance, a rate roughly similar to that of all foreign born (18 percent) and much higher than that of the U.S. born (7 percent; see Figure 9).
Figure 9. Health Coverage for Haitian Immigrants, All Immigrants, and the U.S. Born, 2022
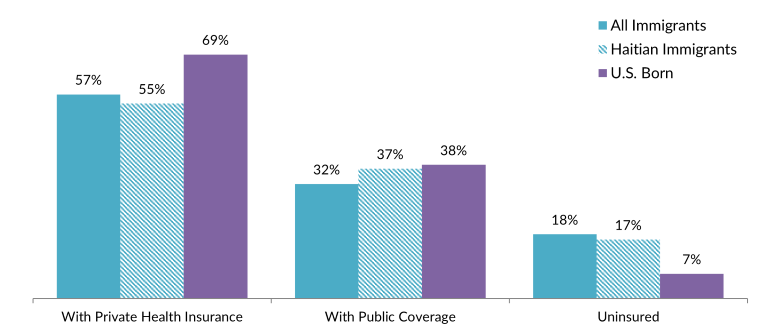
Note: The sum of shares by type of insurance is likely to be greater than 100 because people may have more than one type of insurance.
Source: MPI tabulation of data from the U.S. Census Bureau 2022 ACS.
The Haitian diaspora in the United States was comprised of more than 1.2 million individuals who were either born in Haiti or reported Haitian ancestry or race, according to MPI tabulation of data from the U.S. Census Bureau 2021 ACS. People born in the United States accounted for 508,000 individuals (42 percent) of the U.S.-based Haitian diaspora.
Click here to see estimates of the top 35 diasporas groups in the United States in 2021.
The United States was the top destination for Haitians living internationally, followed by the Dominican Republic (496,000), as of the most recent, mid-2020 United Nations Population Division estimates. Other top destinations included Chile (237,000), Canada (101,000), France (85,000), and Brazil (33,000). These figures are likely to be an underestimate of the number of Haitians abroad because of the significant post-pandemic migration of Haitians in the Americas.
Click here to view an interactive map showing where migrants from Haiti and other countries have settled worldwide.
Global remittances sent to Haiti via formal channels have grown nearly eightfold since 2000, reaching an estimated $4.5 billion as of 2022, according to the World Bank. Remittances from all origins that year represented more than 22 percent of Haiti’s gross domestic product (GDP).
Figure 10. Annual Remittance Flows to Haiti, 2000-22
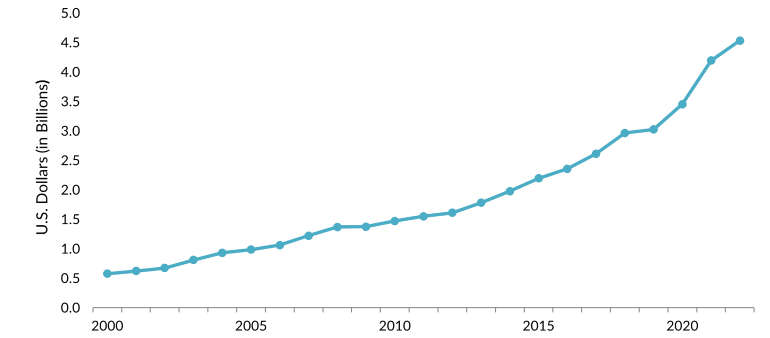
Source: MPI tabulations of data from the World Bank Global Knowledge Partnership on Migration and Development (KNOMAD), “Remittance Inflows,” June 2023 update, available online.
Click here to view an interactive chart showing annual remittances received and sent to Haiti and other countries.
Sources
Bradley, Meghan. 2014. Four Years After the Haiti Earthquake, the Search for Solutions to Displacement Continues. Brookings Institution commentary, January 13, 2014. Available online.
Chishti, Muzaffar, Kathleen Bush-Joseph, and Colleen Putzel-Kavanaugh. 2023. Can the Biden Immigration Playbook Be Effective for Managing Arrivals via Sea? Migration Information Source, October 25, 2023. Available online.
Gibson, Campbell J. and Kay Jung. 2006. Historical Census Statistics on the Foreign-Born Population of the United States: 1850-2000. Working Paper no. 81, U.S. Census Bureau, Washington, DC, February 2006. Available online.
Institute of International Education (IIE). N.d. International Students: All Places of Origin. Accessed October 15, 2023. Available online.
Knowledge Partnership on Migration and Development (KNOMAD)/World Bank Group. 2023. Remittance Inflows. Updated June 2023. Available online.
Lacarte, Valerie. 2023. Addressing the Next Displacement Crisis in the Making in the Americas. Migration Policy Institute (MPI) commentary, October 16, 2023. Available online.
Lederer, Edith M. 2023. Gang Violence in Haiti Is Escalating and Spreading with a Significant Increase in Killings, UN Says. Associated Press, September 27, 2023. Available online.
Migration Policy Institute (MPI), Migration Data Hub. N.d. Countries of Birth for U.S. Immigrants, 1960-Present. Accessed October 15, 2023. Available online.
---. N.d. Top Diaspora Groups in the United States, 2021. Accessed October 15, 2023. Available online.
Taft-Morales, Maureen. 2020. Haiti’s Political and Economic Conditions. Washington, DC: Congressional Research Service. Available online.
U.S. Census Bureau. 2022. 2021 American Community Survey. Access from Steven Ruggles, Katie Genadek, Ronald Goeken, Josiah Grover, and Matthew Sobek. Integrated Public Use Microdata Series: Version 7.0 [dataset]. Minneapolis: University of Minnesota. Available online.
---. N.d. 2022 American Community Survey—Advanced Search: S0201 Selected Population Profile in the United States. Accessed October 5, 2023. Available online.
U.S. Citizenship and Immigration Services (USCIS). 2023 Count of Active DACA Recipients by Month of Current DACA Expiration as of March 31, 2023. Washington, DC: USCIS. Available online.
---. 2023. Extension and Redesignation of Haiti for Temporary Protected Status. January 26, 2023. Available online.
U.S. Coast Guard. 2023. Coast Guard Repatriates 143 People to Haiti, Cuba. Press release, July 18, 2023. Available online.
U.S. Customs and Border Protection (CBP). 2023. CBP Releases September 2023 Monthly Update. Press release, October 21, 2023. Available online.
---. 2023. Nationwide Encounters. Updated June 14, 2023. Available online.
U.S. Department of Homeland Security (DHS), Office of Immigration Statistics. 2023. Yearbook of Immigration Statistics 2022. Updated March 3, 2023. Available online.
Wilson, Jill. 2023. Temporary Protected Status and Deferred Enforced Departure. Washington, DC: Congressional Research Service. Available online.
Yates, Caitlyn and Juan Pappier. 2023. How the Treacherous Darien Gap Became a Migration Crossroads of the Americas. Migration Information Source, September 19, 2023. Available online.