

Vietnamese Immigrants in the United States

An entranceway to Little Saigon in San Francisco's Tenderloin district. The San Francisco metropolitan area is home to the fourth largest Vietnamese population in the country. (Photo: Jeremy Brooks)
The Vietnamese immigrant population in the United States, which was a small one prior to 1975, has grown significantly, roughly doubling every decade between 1980 and 2000, and then increasing 26 percent in the 2000s. As of 2014, Vietnamese represented the sixth largest immigrant group in the country, after those born in Mexico, India, China, the Philippines, and El Salvador. Large-scale Vietnamese migration to the United States began as a humanitarian flow after the end of the Vietnam War in 1975 and, over time, transformed into one of family reunification. By 2014, 1.3 million Vietnamese immigrants resided in the United States (see Figure 1), representing 3 percent of the nation’s 42.4 million immigrants.
Figure 1. Vietnamese Immigrant Population in the United States, 1980-2014
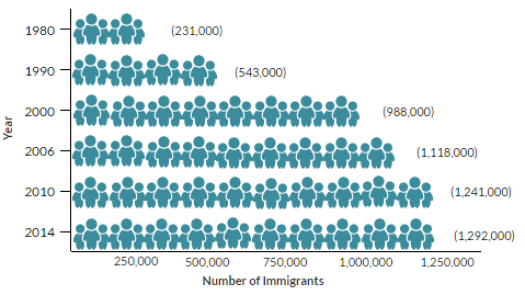
Source: Data from U.S. Census Bureau 2006, 2010, and 2014 American Community Surveys (ACS) and Campbell J. Gibson and Kay Jung, "Historical Census Statistics on the Foreign-born Population of the United States: 1850-2000" (Working Paper no. 81, U.S. Census Bureau, Washington, DC, February 2006), available online.
The United States is the top destination country for Vietnamese migrants, followed by Australia (with 227,000 Vietnamese immigrants), Canada (183,000), and France (126,000), according to mid-2015 estimates by the United Nations Population Division. Click here to view an interactive map showing where migrants from Vietnam have settled worldwide, or here for a Migration Information Source article about the changing nature of Vietnamese migration over time.
The majority of Vietnamese immigrants who obtain lawful permanent residence in the United States (also known as receiving a “green card”) qualify as family-sponsored immigrants or as immediate relatives of U.S. citizens. Compared to the total U.S. foreign-born population, Vietnamese immigrants are more likely to be Limited English Proficient (LEP), but tend to have higher incomes and lower poverty rates.
Using data from the U.S. Census Bureau (the most recent 2014 American Community Survey [ACS] as well as pooled 2010-14 ACS data), the Department of Homeland Security’s Yearbook of Immigration Statistics, and the World Bank’s annual remittance data, this Spotlight provides information on the Vietnamese immigrant population in the United States, focusing on its size, geographic distribution, and socioeconomic characteristics.
Click on the bullet points below for more information:
- Distribution by State and Key Cities
- English Proficiency
- Age, Education, and Employment
- Income and Poverty
- Immigration Pathways and Naturalization
- Health Coverage
- Diaspora
- Remittances
Distribution by State and Key Cities
Most immigrants from Vietnam settled in California (39 percent), Texas (13 percent), and Washington State and Florida (4 percent each), as shown in Figure 2. The top four counties with Vietnamese immigrant residents were Orange County, Santa Clara County, and Los Angeles County in California; and Harris County (Houston) in Texas. Together, these four counties comprise about 31 percent of the total Vietnamese immigrant population in the United States.
Figure 2. Top Destination States for Vietnamese Immigrants in the United States, 2010-14
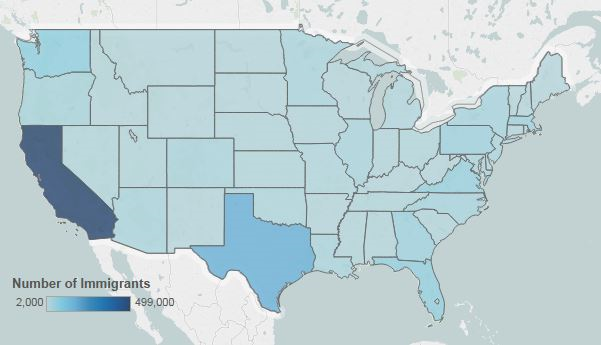
Note: Pooled 2010-14 ACS data were used to get statistically valid estimates at the state and metropolitan statistical area levels, for smaller-population geographies.
Source: Migration Policy Institute (MPI) tabulation of data from U.S. Census Bureau pooled 2010-14 ACS.
Click here for an interactive map that shows the geographic distribution of immigrants by state and county. Select Vietnam from the dropdown menu to see which states and counties have the highest distributions of Vietnamese immigrants.
In the 2010-14 period, one in three Vietnamese immigrants lived in one of three U.S. cities: the greater Los Angeles, San Jose, and Houston metropolitan areas. More than half (56 percent) resided in the top ten metropolitan areas (see Table 1).
Figure 3. Top Destination Metropolitan Areas for Vietnamese Immigrants in the United States, 2010-14
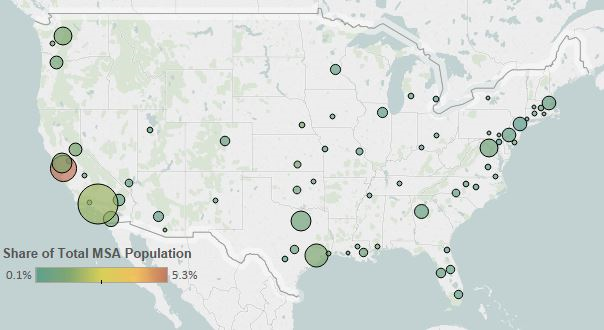
Note: Pooled 2010-14 ACS data were used to get statistically valid estimates at the state and metropolitan statistical area levels, for smaller-population geographies.
Source: MPI tabulation of data from U.S. Census Bureau pooled 2010-14 ACS.
Table 1. Top Concentrations by Metropolitan Area for the Foreign Born from Vietnam, 2010-14
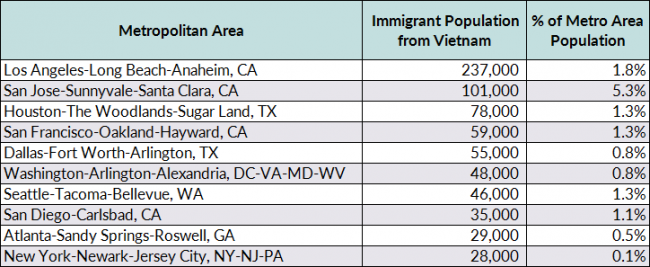
Source: MPI tabulation of data from the U.S. Census Bureau pooled 2010-14 ACS.
Click here for an interactive map that highlights the metropolitan areas with the highest concentrations of immigrants. Select Vietnam from the dropdown menu to see which metropolitan areas have the highest concentrations of Vietnamese immigrants.
Vietnamese immigrants were much less likely to be proficient in English. In 2014, about 67 percent of Vietnamese immigrants (ages 5 and over) reported limited English proficiency, compared to 50 percent of the overall foreign-born population. Approximately 8 percent of Vietnamese immigrants spoke only English at home, compared to the 16 percent average for all immigrants.
Note: Limited English proficiency refers to those who indicated on the ACS questionnaire that they spoke English less than “very well.”
Age, Education, and Employment
The Vietnamese immigrant population was older than both the native- and overall foreign-born populations. The median age of Vietnamese immigrants was 47 years, compared to 44 for the foreign born and 36 for the U.S. born. In 2014, 81 percent of Vietnamese immigrants were of working age (18 to 64), similar to the overall immigrant population (80 percent), as shown in Table 2.
Table 2. Age Distribution by Origin, 2014
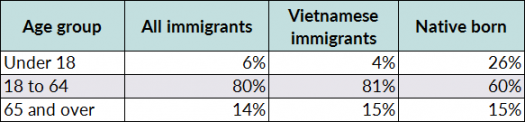
Source: MPI tabulation of data from the U.S. Census Bureau 2014 ACS.
Education
Vietnamese immigrants tend to have slightly lower educational attainment compared to the overall foreign- and native-born populations. In 2014, approximately 25 percent of Vietnamese immigrants (ages 25 and over) had a bachelor’s degree or higher, compared to 29 percent of the total foreign-born population and 30 percent of the U.S.-born population.
Employment
Vietnamese immigrants participate in the labor force at a slightly higher rate than the overall immigrant and native-born populations. In 2014, about 67 percent of Vietnamese immigrants (ages 16 and over) were in the civilian labor force, compared to 66 percent of all immigrants and 62 percent of the native born. Vietnamese immigrants were much more likely to be employed in service occupations (31 percent) and production, transportation, and material moving occupations (19 percent) than the total foreign- and U.S.-born populations (see Figure 4).
Figure 4. Employed Workers in the Civilian Labor Force (ages 16 and older) by Occupation and Origin, 2014
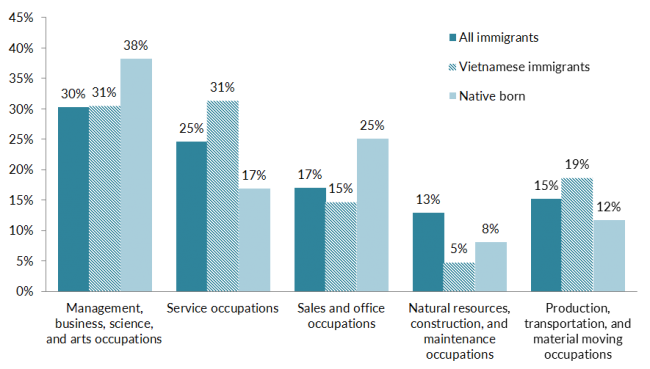
Source: MPI tabulation of data from the U.S. Census Bureau 2014 ACS.
Vietnamese immigrant households had higher incomes compared to the overall foreign- and native-born populations. In 2014, median household income among Vietnamese immigrants was $59,933, compared to $49,487 for all immigrant households and $54,565 for U.S.-born households. This is due in part to the larger-than-average size of many households headed by Vietnamese immigrants.
Vietnamese immigrants were also less likely to be in poverty than the overall immigrant population and the native born. In 2014, 14 percent of Vietnamese immigrants lived in poverty, compared to 19 percent and 15 percent for foreign- and U.S.-born individuals respectively.
Immigration Pathways and Naturalization
Vietnamese immigrants are much more likely to be naturalized U.S. citizens than the overall immigrant population. In 2014, 76 percent of the 1.3 million Vietnamese immigrants residing in the United States were naturalized citizens, compared to 47 percent of the overall foreign-born population.
The majority (71 percent) of Vietnamese immigrants arrived in the United States prior to 2000. Another 19 percent arrived between 2000 and 2009, and a further 10 percent arrived in 2010 and after (see Figure 5).
Figure 5. Vietnamese Immigrants and All Immigrants in the United States by Period of Arrival, 2014
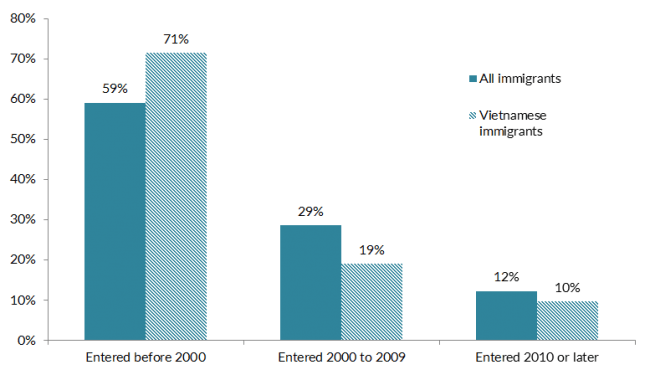
Source: MPI tabulation of data from the U.S. Census Bureau 2014 ACS.
Large-scale Vietnamese migration to the United States started as an influx of refugees following the end of the Vietnam War in 1975. Early refugees were part of a U.S.-sponsored evacuation and consisted mainly of military personnel and urban, well-educated professionals associated with the U.S. military or the South Vietnamese government. In contrast, a second wave of Vietnamese refugees, commonly known as “boat people,” arrived in the late 1970s. The majority of these arrivals came from rural areas and were often less educated. Many of the Vietnamese refugees who arrived in the United States between 1983 and 2004 were initially resettled in states with large immigrant populations, including California, Texas, and Washington State—a fact largely reflected by the geographic distribution of Vietnamese immigrants today.
Refugees must apply for lawful permanent resident (LPR) status one year after being admitted to the United States, and nearly all Vietnamese immigrants (99 percent) who received a green card in 1982 had entered the country as refugees. Since 1980, there has been a general downward trend in the number of Vietnamese immigrants arriving as refugees and, subsequently, fewer green cards were granted to Vietnamese as refugees or asylees. Instead, an increasing number of Vietnamese immigrants began to qualify for LPR status through family ties (either as immediate relatives of U.S. citizens or via family-sponsored preferences), as shown in Figure 6.
Figure 6. Vietnamese Refugee Arrivals and Vietnamese Immigrants Granted Lawful Permanent Residence (LPR) as Refugees and Asylees or through Family Ties, 1975-2014
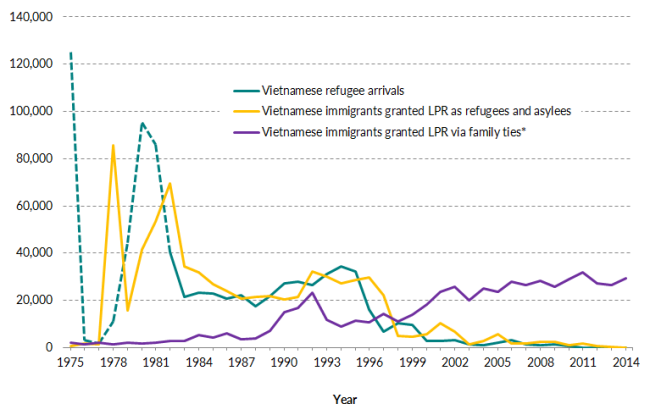
Notes: The purple line represents Vietnamese immigrants granted lawful permanent resident (LPR) status both through family-sponsored preferences and as immediate relatives of U.S. citizens. The dotted portion of the line for refugee arrivals prior to 1982 indicates that these numbers are estimates obtained from Table 7.2 in Linda W. Gordon, “Southeast Asian Refugee Migration to the United States,” Center for Migration Studies special issues 5(3): 153-73. In 1975, about 125,000 Vietnamese refugees arrived in the United States as the result of a U.S.-sponsored evacuation program following the end of the Vietnam War. From 1976 to 1977, the number of refugee arrivals dropped sharply for the most part because the United States denied admission to Vietnamese individuals except for family reunification. As a result of continuing political and ethnic conflicts within Southeast Asia, the number of refugees from Vietnam and its neighboring countries rose dramatically beginning in 1978. In response to this humanitarian crisis, Western countries, including the United States, began admitting greater numbers of refugees from the region, many of whom were living in refugee camps.
Sources: MPI tabulation of data from Department of Homeland Security (DHS), 2012 and 2002 Yearbook of Immigration Statistics (Washington, DC: DHS Office of Immigration Statistics), available online; U.S. Immigration and Naturalization Service (INS), Statistical Yearbook of the Immigration and Naturalization Service (Washington, DC: U.S. Government Printing Office, various years); INS, Annual Reports (Washington, DC: U.S. Government Printing Office, 1977, 1976, and 1975); Linda W. Gordon, “Southeast Asian Refugee Migration to the United States,” Center for Migration Studies special issues, 5 (3) (1987): 153-73; Rubén G. Rumbaut, “A Legacy of War: Refugees from Vietnam, Laos, and Cambodia,” in Origins and Destinies: Immigration, Race, and Ethnicity in America, eds. Silvia Pedranza and Rubén G. Rumbaut (Belmont, CA: Wadsworth, 1996); Gail P. Kelly, “Coping with America: Refugees from Vietnam, Cambodia, and Laos in the 1970s and 1980s,” Annals of the American Academy of Political and Social Science, 487 (1996): 138-49.
In fiscal year 2014, the overwhelming majority (97 percent) of Vietnamese immigrants became LPRs in the United States via family-sponsored preference channels (61 percent) or because they were immediate relatives of U.S. citizens (36 percent), as shown in Figure 7. In the same year, only 1 percent of new Vietnamese LPRs were refugees or asylees who had adjusted their status. Vietnamese immigrants were much less likely to become LPRs via employment pathways (2 percent) compared to the overall LPR population (15 percent).
Figure 7. Immigration Pathways of Vietnamese Immigrants and All Immigrants in the United States, 2014
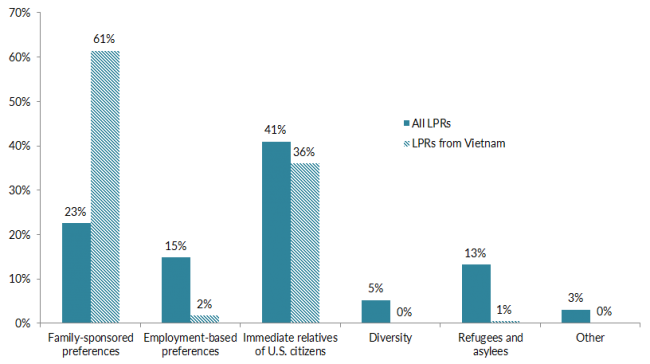
Notes: “Family-sponsored preferences” apply to adult children and siblings of U.S. citizens as well as spouses and children of green-card holders. “Immediate relatives of U.S. citizens” include spouses, minor children, and parents of U.S. citizens. The Diversity Visa Lottery refers to a program established by the Immigration Act of 1990 to facilitate the entry of immigrants from countries with low rates of immigration to the United States. The law states that 55,000 diversity visas are made available each fiscal year. Vietnamese nationals are not eligible for the lottery.
Source: MPI tabulation of data from DHS, 2014 Yearbook of Immigration Statistics (Washington, DC: DHS Office of Immigration Statistics, 2016), available online.
Vietnamese immigrants in 2014 were less likely to be uninsured (13 percent) than the overall foreign-born population (27 percent). They were also more likely to have public and private health insurance compared to all immigrants (see Figure 8).
Figure 8. Health Coverage for Vietnamese Immigrants, All Immigrants, and the Native Born, 2014
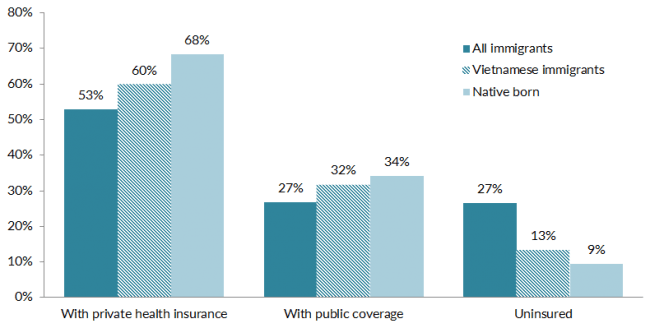
Note: The sum of shares by type of insurance is likely to be greater than 100 because people may have more than one type of insurance.
Source: MPI tabulation of data from the U.S. Census Bureau 2014 ACS.
The Vietnamese diaspora population in the United States is comprised of approximately 2.1 million individuals who were either born in Vietnam or reported Vietnamese ancestry, according to tabulations from the U.S. Census Bureau pooled 2010-14 ACS.
Total global remittances sent to Vietnam via formal channels amounted to $12 billion in 2014, representing about 6 percent of the country’s gross domestic product (GDP), according to data from the World Bank. Remittances sent to Vietnam have experienced a six-fold increase since 2000 (see Figure 9). As of 2015, the United States was the top remittance-sending country—with $7.4 billion sent from the United States to Vietnam—significantly more than remittances from Australia ($1.1 billion), Canada ($923 million), and Germany ($714 million).
Figure 9. Annual Remittance Flows to Vietnam, 2000-14
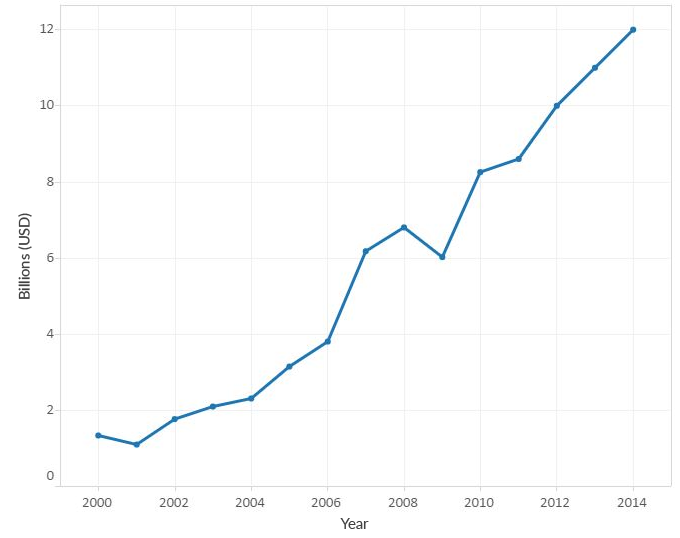
Source: MPI tabulations of data from the World Bank Prospects Group, “Annual Remittances Data,” updated April 2016, available online.
Visit the MPI Data Hub’s collection of interactive remittances tools, which track remittances by inflow and outflow, between countries, and over time.
Sources
Department of Homeland Security (DHS), Office of Immigration Statistics. Various years. Yearbook of Immigration Statistics. Washington, DC: DHS Office of Immigration Statistics. Available Online.
Gibson, Campbell J. and Kay Jung. 2006. Historical Census Statistics on the Foreign-born Population of the United States: 1850-2000. Working Paper No. 81, U.S. Census Bureau, Washington, DC, February 2006. Available Online.
Gordon, Linda W. 1987. Southeast Asian Refugee Migration to the United States. Center for Migration Studies special issues 5 (3): 153-73.
Kelly, Gail P. 1986. Coping with America: Refugees from Vietnam, Cambodia, and Laos in the 1970s and 1980s. Annals of the American Academy of Political and Social Science 487: 138-49.
Miller, Karl. 2015. From Humanitarian to Economic: The Changing Face of Vietnamese Migration. Migration Information Source, April 2015. Available Online.
Rumbaut, Rubén G. 1996. A Legacy of War: Refugees from Vietnam, Laos, and Cambodia. In Origins and Destinies: Immigration, Race, and Ethnicity in America, eds. Silvia Pedranza and Rubén G. Rumbaut. Belmont, CA: Wadsworth. 315-33. Available Online.
Singer, Andrey and Jill H. Wilson. 2007. Refugee Resettlement in Metropolitan America. Migration Information Source, March 2007. Available Online.
U.S.U.S. Census Bureau. 2015. 2014 American Community Survey. American FactFinder. Available Online.
---. 2016. 2010-14 American Community Survey. Accessed from Steven Ruggles, Katie Genadek, Ronald Goeken, Josiah Grover, and Matthew Sobek. Integrated Public Use Microdata Series: Version 6.0 [Machine-readable database]. Minneapolis: University of Minnesota, 2016. Available Online.
U.S. Immigration and Naturalization Service (INS). Various years. Statistical Yearbook of the Immigration and Naturalization Service. Washington, DC: INS.
---. Various years. Annual Reports. Washington, DC: INS.
World Bank Prospects Group. 2016. Annual Remittances Data. Updated April 2016. Available Online.