

Immigrants from New Origin Countries in the United States

Chinatown, San Francisco. (Photo: Tony Webster)
While the immigrant population in the United States continued its moderate growth in 2017, and the foreign-born share of the overall U.S. population reached a near-historic high of 14 percent, other noteworthy trends were underway beneath these totals. Compared to the 1980–2010 period, the national origins of new arrivals have shifted. Recent newcomers are more likely to come from Asia, Central America, and Africa, and less likely to be from Mexico. Research also shows that new immigrants tend to have higher educational attainment than those who arrived in prior periods. These changes will have a significant impact on the demographics and future integration outcomes of the country’s immigrant population.
Between 2010 and 2017, the foreign-born population in the United States increased by 4.6 million, or 11 percent, driven in large part by the arrival of Indian and Chinese immigrants. Immigration from the Caribbean (the Dominican Republic, Cuba, and Haiti); Central America (El Salvador, Honduras, and Guatemala); South America (Venezuela, Colombia, and Brazil); Asia (the Philippines, Vietnam, and Bangladesh); and Africa (Nigeria) also experienced sizable growth during this period. Together, these 15 countries, shown in Table 1, accounted for 37 percent of the 44.5 million immigrants living in the United States in 2017, and for 76 percent of the immigrant population growth from 2010 to 2017. On the flip side, there are 441,000 fewer Mexican immigrants in the United States today than there were in 2010, the biggest decline of all immigrant groups.
Table 1. Immigrant Groups with the Largest Growth between 2010 and 2017
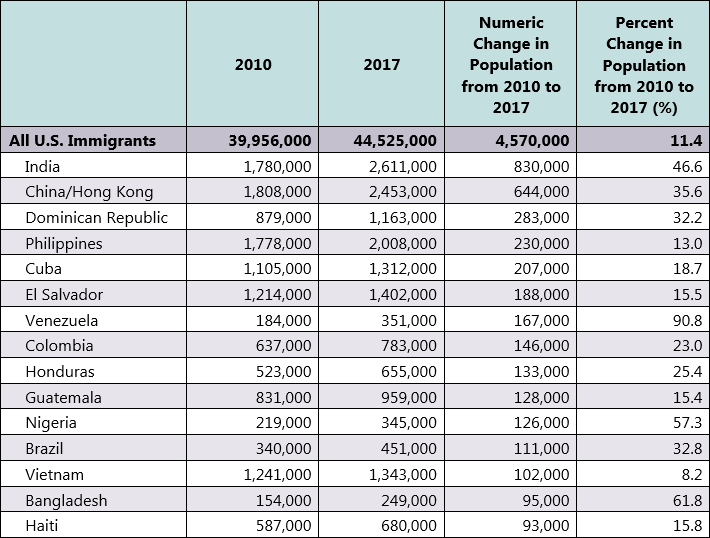
Note: Countries are sorted by increase in the size of the population from 2000 to 2017.
Source: Migration Policy Institute (MPI) tabulation of data from the U.S. Census Bureau 2010 and 2017 American Community Survey (ACS).
However, some immigrant groups from other countries exhibited higher rates of growth than the 15 groups shown above, a fact that reflects their small size in 2010. For instance, the number of Nepalese immigrants increased 120 percent from 2010 to 2017—the fastest growth among all national-origin groups—followed by Burma, Venezuela, Afghanistan, and Saudi Arabia (see Figure 1). However, these five groups amounted to roughly 847,000 immigrants combined in 2017, representing less than 2 percent of the total foreign-born population.
Figure 1. Immigrant Groups with the Fastest Growth between 2010 and 2017, (%)
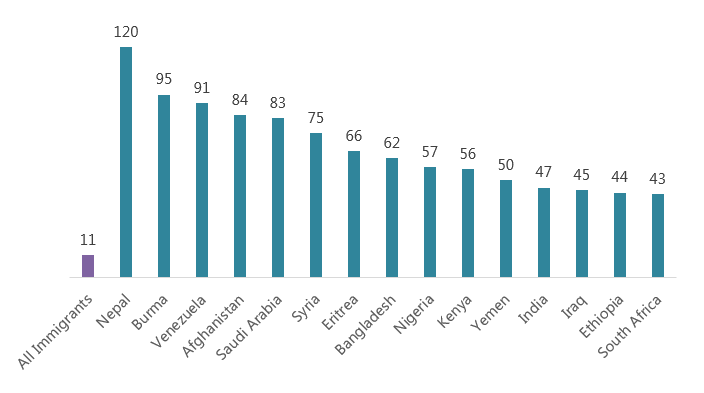
Source: MPI tabulation of data from the U.S. Census Bureau 2010 and 2017 ACS.
This Spotlight compares the geographic distribution and socioeconomic characteristics of the 15 immigrant groups that experienced the largest growth since 2010 with those of the overall foreign- and U.S.-born populations. It draws on data from the U.S. Census Bureau's 2010, 2017, and pooled 2013–17 American Community Survey (ACS) as well as the Department of Homeland Security’s Yearbook of Immigration Statistics and the Institute for International Education’s Open Doors data portal. Unless stated otherwise, the remainder of this article will focus on all immigrants, not only recent arrivals, from the following top origin countries: Bangladesh, Brazil, China/Hong Kong, Colombia, Cuba, the Dominican Republic, El Salvador, Guatemala, Haiti, Honduras, India, Nigeria, the Philippines, Venezuela, and Vietnam.
Data-collection constraints do not permit inclusion of those who gained citizenship of these countries via naturalization and later moved to the United States.
Click on the bullet points below for more information:
- Geographic Distribution
- Immigration Pathways and Naturalization
- Period of Arrival
- English Proficiency
- Educational Attainment
- Employment and Occupations
- Poverty
- Health Insurance
As of 2013–17, immigrants from the 15 high-growth countries were over-represented in states such as Hawaii, Florida, Louisiana, Rhode Island, New Jersey, and Massachusetts, where they accounted for between 48 percent and 61 percent of all state immigrant residents. In contrast, they accounted for less than 20 percent of immigrants in Wyoming, Colorado, Montana, Vermont, Arizona, Idaho, and New Mexico (see Figure 2).
Figure 2. Share of Immigrants* from High-Growth Groups among All Immigrants, by State, (%), 2013–17
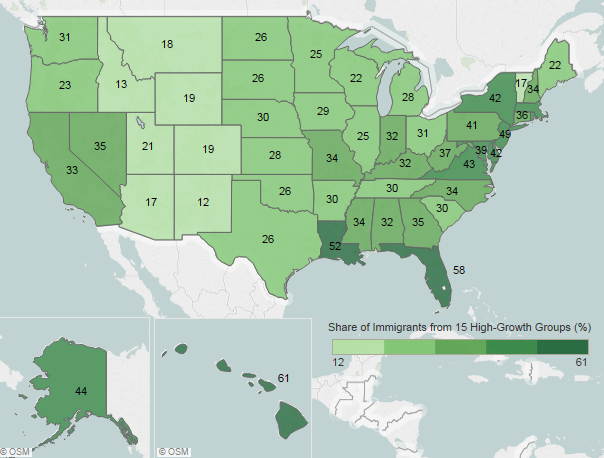
* This figure represents all immigrants from these high-growth countries, not only those who arrived between 2010 and 2017.
Note: Pooled 2013–17 ACS data were used to get statistically valid estimates at the state level for smaller-population geographies. For details, visit the MPI Data Hub to view an interactive map showing geographic distribution of immigrants by state and county, available online.
Note: The high-growth group immigrant share for Maryland is 46 percent; for Massachusetts, 48 percent; and Rhode Island, 49 percent.
Source: MPI tabulation of data from U.S. Census Bureau pooled 2013–17 ACS.
More than half (57 percent) of immigrants from the high-growth countries resided in the greater New York, Miami, and Los Angeles metropolitan areas. They accounted for 67 percent of the total foreign-born population of Miami and slightly more than half of immigrant residents in the greater San Francisco metro area (see Table 2).
Table 2. Top Metropolitan Areas with the Largest Number of Immigrants* from High-Growth Groups, 2013–17
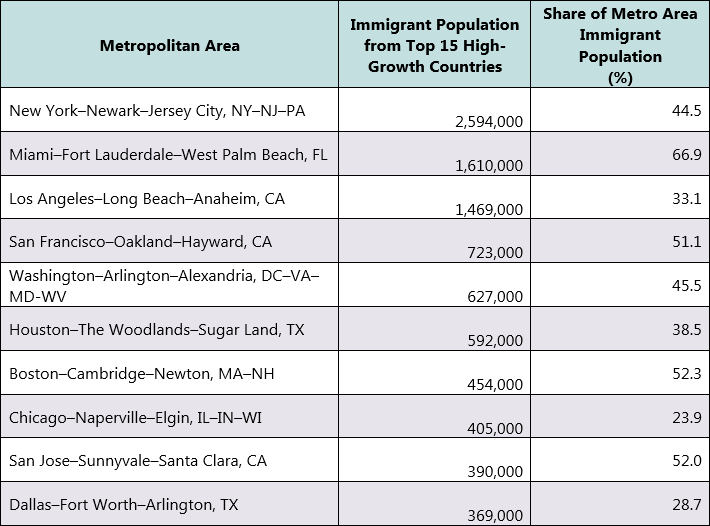
* This table represents all immigrants from the top 15 high-growth countries, not only those who arrived between 2010 and 2017.
Source: MPI tabulation of data from U.S. Census Bureau pooled 2013–17 ACS.
Click here for an interactive map that highlights the metropolitan areas with the highest concentrations of immigrants during the 2013–17 period.
Immigration Pathways and Naturalization
The 15 groups with the largest growth in recent years were slightly more likely to be naturalized U.S. citizens compared to immigrants overall—51 percent versus 49 percent (see Figure 3). In 2017, immigrants from Vietnam were the most likely to be naturalized of these groups (77 percent), followed by those from the Philippines (70 percent). The naturalized share of immigrants was lowest among Central Americans: El Salvador (33 percent), Guatemala (28 percent), and Honduras (24 percent).
Figure 3. Naturalized U.S. Citizens as a Share of Immigrants, by Country of Birth, (%), 2017
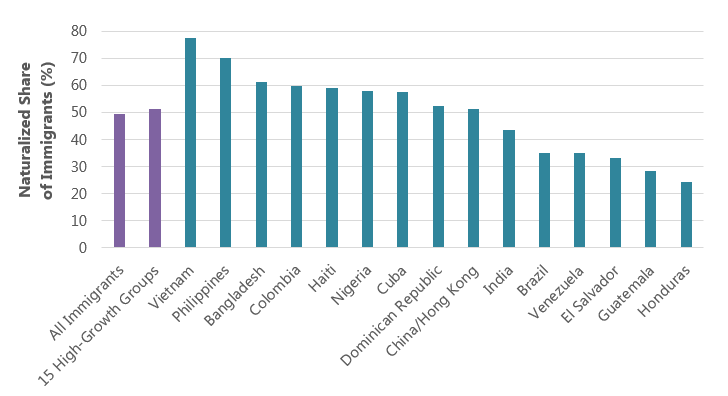
Source: MPI tabulation of data from the U.S. Census Bureau 2017 ACS.
Close to 3.7 million foreign nationals from the top 15 high-growth immigrant groups obtained lawful permanent residence (LPR status, also known as getting a green card) between fiscal year (FY) 2010 and FY 2017. They accounted for 43 percent of the 8.5 million immigrants who received green cards during the same period.
In FY 2017, 70 percent of new LPRs from the 15 high-growth groups gained green cards through family sponsorship, followed by 14 percent each through humanitarian and employment pathways—a breakdown similar to that of all new green-card holders (see Figure 4). There was, however, greater diversity among the top 15 high-growth immigrant groups. Almost all new green-card holders from the Dominican Republic (99 percent), Haiti (97 percent), Vietnam (96 percent), Bangladesh (94 percent), and Nigeria (91 percent) were family members of U.S. citizens or LPRs. Meanwhile, 85 percent of new LPRs from Cuba were refugees and asylees, and 11 percent of Venezuelans gained legal permanent residence through the Diversity Visa lottery—more than double the share of all immigrants to receive this visa.
Figure 4. Immigration Pathways of All Immigrants and High-Growth Groups, by Country of Birth, 2017
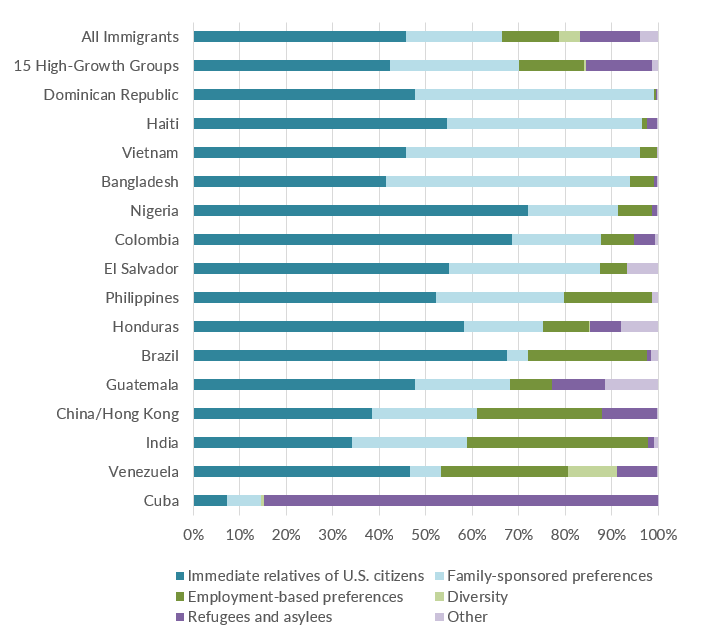
Notes: Immediate relatives of U.S. citizens: Includes spouses, minor children, and parents of U.S. citizens. Family-sponsored preferences: Includes adult children and siblings of U.S. citizens as well as spouses and children of green-card holders. Diversity Visa lottery: The Immigration Act of 1990 established the Diversity Visa lottery program to allow entry to immigrants from countries with low rates of immigration to the United States. The law states that 55,000 diversity visas in total are to be made available each fiscal year. Of the top 15 high-growth immigrant groups, only nationals of Honduras, Guatemala, China’s Hong Kong SAR and Macau SAR, Venezuela, and Cuba are eligible for the Diversity Visa 2020 lottery.
Source: MPI tabulation of data from Department of Homeland Security (DHS), 2017 Yearbook of Immigration Statistics (Washington, DC: DHS Office of Immigration Statistics, 2018), available online.
As would be expected, immigrants from the top 15 high-growth groups arrived in the country more recently than the foreign-born population overall. In 2017, 27 percent of immigrants from these countries had entered the United States in 2010 or later, 26 percent arrived during the 2000s, and the remaining 46 percent came before 2000. Among all immigrants, 21 percent had arrived since 2010, 26 percent during the 2000s, and 53 percent before 2000.
Overall, about 51 percent of the foreign-born persons (ages 5 and older) from the top 15 high-growth groups reported speaking English less than “very well” versus 48 percent of all immigrants. However, English proficiency levels varied significantly by country. Immigrants from Nigeria, India, and the Philippines, due to the widespread use of English in their home countries, were less likely to be Limited English Proficient (LEP) than those from countries such as Honduras, El Salvador, and Guatemala (see Figure 5).
Note: Limited English Proficient refers to those who reported speaking English “not at all,” “not well,” or “well” on the ACS questionnaire. Individuals who reported speaking English exclusively or “very well” are considered proficient in English.
Figure 5. Share of Immigrants (ages 5 and over) Who Are Limited English Proficient (LEP), by Country of Birth, 2017
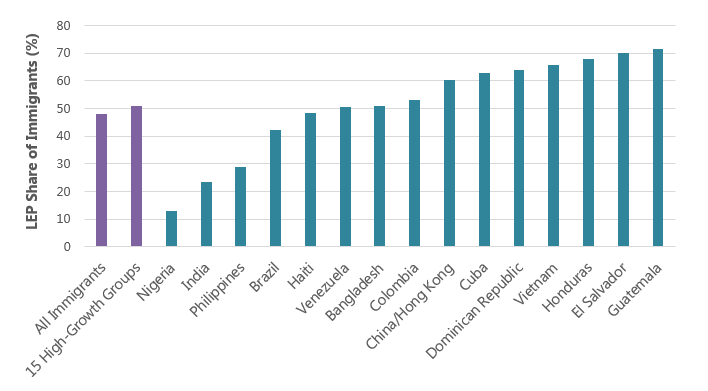
Source: MPI tabulation of data from the U.S. Census Bureau 2017 ACS.
As of 2017, immigrant adults from the 15 high-growth groups have higher levels of education than U.S. immigrants overall: about 77 percent reported having earned a high school degree or higher, compared to 73 percent of all foreign born in the United States and 91 percent of the native born (see Figure 6).
Figure 6. Educational Attainment of Adults (ages 25 and older), by Country of Birth, 2017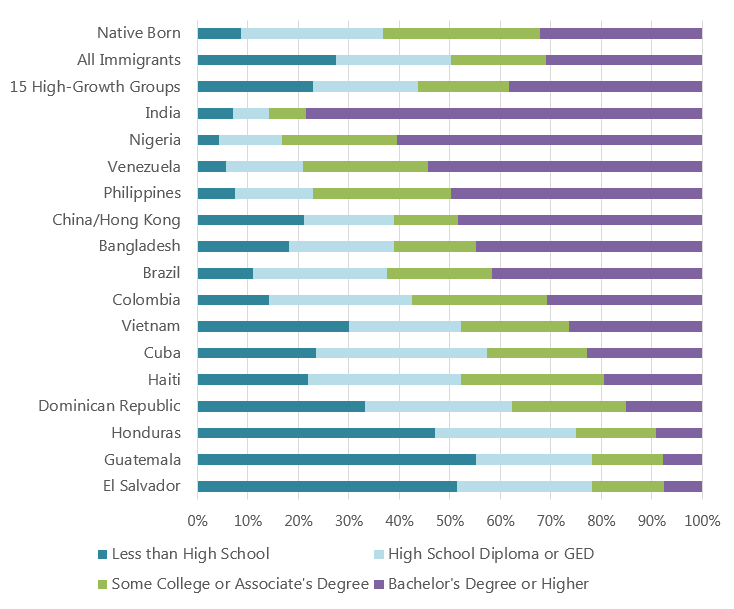
Source: MPI tabulation of data from the U.S. Census Bureau 2017 ACS.
However, educational attainment varies greatly across immigrant groups. Immigrants (ages 25 and over) from the Northern Triangle of Central America (El Salvador, Guatemala, and Honduras) are less likely to be educated, with approximately half lacking a high school diploma compared to 28 percent of the overall foreign-born population. In contrast, between half and more than three-quarters of immigrants from the Philippines, Venezuela, Nigeria, and India held at least a bachelor’s degree—levels considerably higher than the approximately one-third of the native-born adults who do.
In addition, some of these high-growth groups have been long-term and significant sources of international students in the United States. In school year 2017–18, of the 1.1 million international students in U.S. higher education institutions, 34 percent, or 371,000, were from China (including Hong Kong and Macau SAR). A notable share also came from India (18 percent, or 196,000 students).
Immigrants from the 15 high-growth groups participate in the civilian labor force at a somewhat higher rate than their native-born counterparts—67 percent in 2017, compared to 62 percent of the U.S. born.
Meanwhile, immigrant workers from these countries were slightly less likely than their U.S.-born counterparts to be employed in management, business, and finance occupations (37 percent versus 39 percent) and more likely to be in service occupations (25 percent versus 17 percent).
Consistent with the national-origin trends for educational attainment described above, immigrants from different high-growth groups contribute to different segments of the economy. For example, more than half of immigrants from China/Hong Kong, Nigeria, and India were employed in management, business, science, and art occupations, compared to close to one-third of all foreign-born adults. Approximately one-third of immigrants from El Salvador, Guatemala, and Vietnam were in service occupations versus less than one-quarter (23 percent) of the immigrant population. In addition, Guatemalans and Hondurans were more than twice more likely to be in natural resources, construction, and maintenance occupations than all immigrant workers (see Figure 7).
Figure 7. Workers Employed in the Civilian Labor Force (ages 16 and older), by Occupation and Country of Birth, 2017
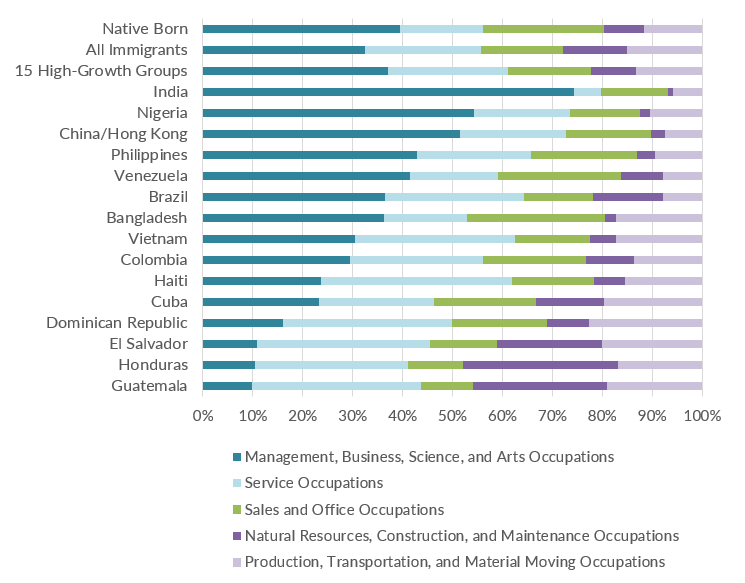
Source: MPI tabulation of data from the U.S. Census Bureau 2017 ACS.
Immigrants from high-growth origin groups are slightly less likely to be in poverty (14 percent) than immigrants overall (15 percent). Filipinos and Indians had the lowest poverty rate (6 percent each), while immigrants from Honduras (25 percent), Guatemala (22 percent), and Venezuela (21 percent) were the most likely of these 15 groups to be in poverty (see Figure 8).
Figure 8. Share of Individuals in Poverty, by Country of Birth, (%), 2017
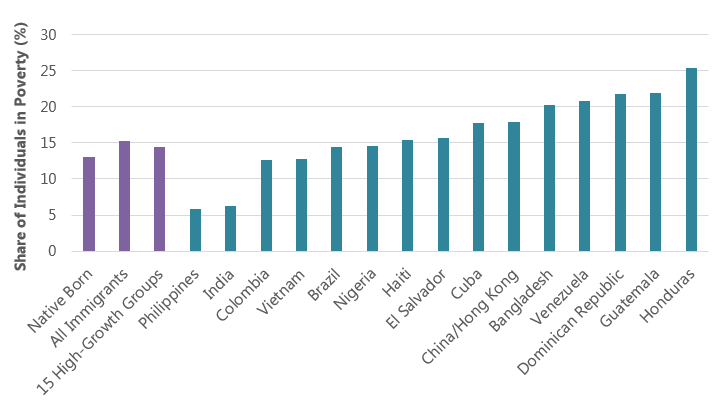
Source: MPI tabulation of data from the U.S. Census Bureau 2017 ACS.
Immigrants from high-growth groups are on average more likely than the foreign-born population overall to have private health insurance (see Figure 9). As with other characteristics, health-care coverage varied by country of origin. Immigrants from India and Nigeria had very low uninsured rates, and most had private health insurance. In contrast, while those from Bangladesh, the Dominican Republic, and Cuba had relatively low rates of uninsurance, a sizable share of each group had coverage from public programs. Close to half of immigrants from Honduras and Guatemala lacked health insurance.
Figure 9. Health-Care Coverage, by Type and Country of Birth, (%), 2017
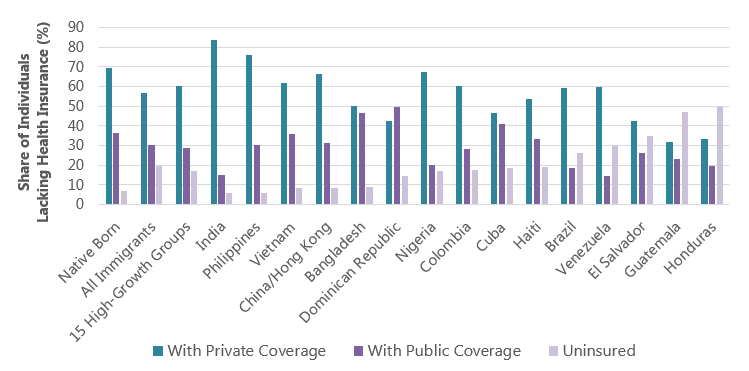
Note: The sum of shares by type of insurance for each origin group is likely to be greater than 100 because people may have more than one type of insurance.
Source: MPI tabulation of data from the U.S. Census Bureau 2017 ACS.
Sources
Institute of International Education (IIE). 2018. International Students by Place of Origin, 2016/17 & 2017/18. Washington, DC: IIE. Available online.
Pew Charitable Trusts. 2014. Changing Patterns in U.S. Immigration and Population. Washington, DC: Pew Charitable Trusts. Available online.
U.S. Census Bureau. 2018. 2006 to 2017 American Community Surveys. Accessed from Steven Ruggles, Katie Genadek, Ronald Goeken, Josiah Grover, and Matthew Sobek. Integrated Public Use Microdata Series: Version 7.0 [dataset]. Minneapolis: University of Minnesota. Available online.
U.S. Department of Homeland Security (DHS), Office of Immigration Statistics. 2018. 2017 Yearbook of Immigration Statistics. Washington, DC: DHS Office of Immigration Statistics. Accessed online.