

Refugees and Asylees in the United States

A refugee family in Phoenix. (Photo: IOM/Christophe Calais)
Editor's Note: Figure 1 in this article was updated shortly after publication to correct the number of refugees resettled in fiscal year (FY) 2023.
As a sobering milestone was reached in 2022, with news that more than 100 million individuals were displaced globally, the United States was slowly increasing refugee resettlement after several years of COVID-19-related restrictions and the legacy of the Trump administration’s efforts to reduce humanitarian migration. More refugees arrived in the United States in the first eight months of fiscal year (FY) 2023 than any year since FY 2017. Adding a new element to the resettlement program, the Biden administration greenlighted an initiative allowing U.S. residents to sponsor already identified refugees for resettlement. And beyond the U.S. resettlement and asylum systems, the administration has advanced new policies to address pressing protection needs in other ways while also reducing pressure on the U.S.-Mexico border, which has witnessed record arrivals. These include grants of temporary status known as parole for up to 30,000 nationals of Cuba, Haiti, Nicaragua, and Venezuela monthly; as well as humanitarian parole for displaced Afghans and Ukrainians.
The U.S. resettlement program is for people outside the United States and historically has resettled more refugees annually than any other country. The asylum pathway is for those who present themselves at U.S. ports of entry or are already within the country and seek protection. U.S. refugee resettlement has fluctuated significantly over the past decade, reflecting the priority of presidential administrations. While the Trump administration reduced the annual resettlement cap to a historical low of 15,000 by its last year in office (FY 2021), President Joe Biden reversed course and raised the cap to 62,500 for the remainder of FY 2021 and then to 125,000 for FY 2022 and FY 2023. Despite these increases, the pace of actual resettlement has lagged, although it has steadily ticked up as the pandemic has waned and processing resumed. Approximately 11,400 refugees were resettled in FY 2021, 25,500 in FY 2022, and 31,800 in the first eight months of FY 2023. Over the 43 years of the modern resettlement program, an average of approximately 73,300 refugees have been resettled annually.
Additionally, approximately 17,700 people received asylum in FY 2021 (the most recent data available), the fewest since 13,800 asylum petitions were granted in FY 1994. More than 1.3 million asylum applications awaited processing as of May 2023, and many among the record number of arrivals at the U.S.-Mexico border intend to seek asylum.
Using the most recent data available, including the first eight months of FY 2023 (October 1, 2022 through May 31, 2023) and historical refugee arrival figures from the State Department and FY 2021 asylum data from the Department of Homeland Security (DHS), this Spotlight examines characteristics of the U.S. refugee and asylee populations, including top countries of origin and top states for refugee resettlement. It provides numbers for refugees and asylees who have become lawful permanent residents (LPRs, also known as green-card holders).
Note: All yearly data are for the government’s fiscal year (October 1 through September 30) unless otherwise noted.
Click on the bullet points below for more information:
- Refugee Admissions Ceiling
- Refugee Arrivals by Region and Country of Origin
- Refugees from Predominately Muslim Countries
- Latin American and Caribbean Refugees
- Top Refugee-Receiving States
- Religions of Refugees
- Age and Gender of Refugees
- Asylees
- Adjustment to Lawful Permanent Resident Status
- Asylum Backlogs
Refugees
Refugee Admissions Ceiling
At the beginning of each fiscal year, the president, in consultation with Congress, sets a cap on the number of refugees to be resettled from five global regions, as well as an unallocated reserve to be used if a country goes to war or more refugees need to be admitted regionally. In the case of an unforeseen emergency, the total and regional allocations may be adjusted.
The highest recent annual refugee admissions ceiling was 142,000 in FY 1993, largely a response to the Balkan wars. The annual ceiling then declined quickly and settled in a range from 70,000 to 91,000 between FY 1999 and FY 2016. In response to the worsening global humanitarian crisis, the Obama administration raised the ceiling to 85,000 in FY 2016 and 110,000 in FY 2017. Upon taking office, the Trump administration slowed refugee case processing and decreased admissions from 11 “high-risk” countries for a time, later requiring additional screening. Refugee admissions from these mostly Muslim countries—Egypt, Iran, Iraq, Libya, Mali, North Korea, Somalia, South Sudan, Sudan, Syria, and Yemen—accounted for 43 percent of all refugee resettlement in FY 2017, but fell to 3 percent in FY 2018, before rising to 6 percent in FY 2019 and 14 percent in FY 2020.
While in office, President Donald Trump reduced the refugee admissions cap several times, to a historical low of 15,000 for FY 2021. The Trump administration also deviated from the region-based formula for allocating refugee slots, instead prioritizing particular categories of individuals, such as those fleeing religious persecution, mostly Christians.
Click here for an explainer on the changes in U.S. immigration under the Trump administration, including in refugee and asylum policy.
Upon assuming office, Biden expressed a commitment to restoring the country’s refugee resettlement program to its prior strength. Despite reverting to the previous regional allocation system and raising the resettlement ceiling, however, the administration admitted far fewer refugees than the allowed threshold. This is in large part due to ongoing difficulties reviving a resettlement system whose capacity plunged amid the sharp cuts, as well as lingering COVID-19-era challenges.
Click here for an article on the changes in U.S. immigration policy during the first two years of the Biden administration.
Figure 1. Annual Refugee Resettlement Ceiling and Number of Refugees Admitted to the United States, FY 1980-2023*
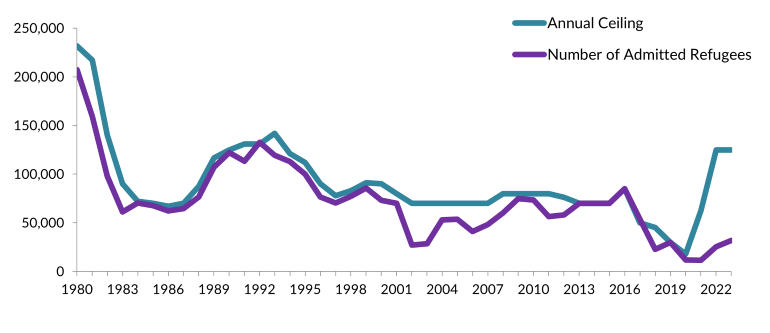
*Data on admitted refugees for fiscal year (FY) 2023 run from October 1, 2022 through May 31, 2023.
Notes: The FY 2017 refugee ceiling was originally 110,000 but lowered to 50,000 mid-year; the FY 2021 refugee ceiling was originally 15,000 but was increased to 62,500 mid-year.
Sources: U.S. Departments of State, Homeland Security, and Health and Human Services, “Proposed Refugee Admissions for Fiscal Year,” various years; Migration Policy Institute (MPI) analysis of State Department’s Worldwide Refugee Admissions Processing System (WRAPS) data, available online.
Click here to view an interactive chart on refugee admissions over time.
Refugee Arrivals by Region and Country of Origin
The geographic origins of admitted refugees have changed considerably over time (see Figure 2). In the first eight months of FY 2023, 43 percent of admitted refugees were from Africa, 28 percent from the Middle East and South Asia, 13 percent from East Asia, 11 percent from Latin America and the Caribbean, and 4 percent from Europe and Central Asia. In comparison, the leading origins of resettled refugees in FY 2012 was the Middle East and South Asia (52 percent), followed by East Asia (25 percent), Africa (18 percent), Latin America and the Caribbean (4 percent), and Europe and Central Asia (2 percent).
Figure 2. Regions of Origin of U.S. Refugee Arrivals, FY 2000-23*
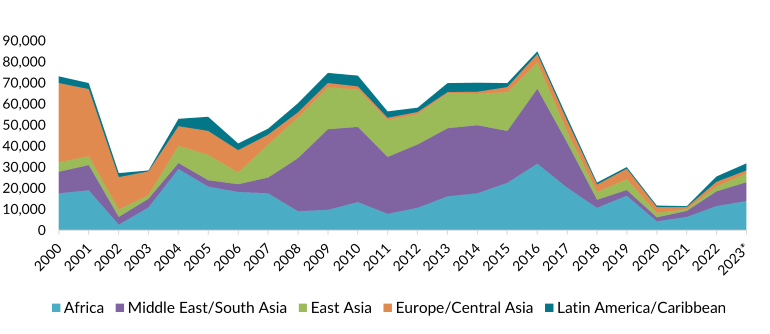
* Data on admitted refugees for FY 2023 run from October 1, 2022 through May 31, 2023. Regions are reported as shown in the original WRAPS data.
Notes: Family members granted follow-to-join refugee status are included in refugee admissions data; recipients of Special Immigrant Visas (SIV) who received refugee program reception and placement benefits are not included.
Source: MPI analysis of State Department WRAPS data.
Nationals of the Democratic Republic of the Congo (DRC), Myanmar (also known as Burma), and Syria were the top origin groups in the first eight months of FY 2023, representing 59 percent of arrivals (approximately 18,700 individuals). They also made up the top three groups in FY 2022, accounting for 57 percent of arrivals (14,500 individuals). Congolese refugees have fled armed conflict that has killed more people over several decades than any war since World War II. In Syria, millions of people have been forced to leave their homes due to the ongoing civil war, facing violence, destruction, and persecution. Similarly, in Myanmar, refugees have been compelled to flee due to factors such as political instability, persecution of the predominantly Muslim Rohingya people, and widespread human rights abuses.
Table 1. Origins of U.S. Refugee Arrivals, FY 2023*

* Data run from October 1, 2022 through May 31, 2023.
Source: MPI analysis of State Department WRAPS data.
In comparison, nationals of Bhutan, Myanmar, and Iraq were the top three groups, representing 71 percent of arrivals (nearly 41,400 individuals), in FY 2012, a decade before the last full year for which data are available. Over the past decade (FY 2012-22), nationals of three countries—Myanmar, Iraq, and DRC—represented 50 percent of all U.S. refugee admissions.
Table 2. Origins of U.S. Refugee Arrivals, FY 2012, FY 2022, and FY 2012-22
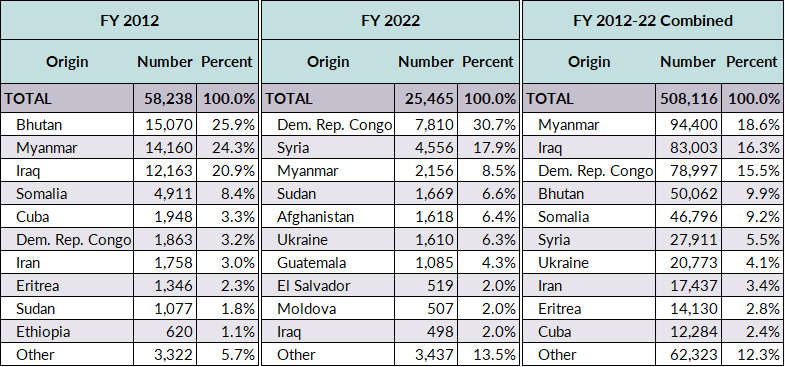
Source: MPI analysis of State Department WRAPS data.
Refugees from Predominately Muslim Countries
Refugees and other immigrants from predominantly Muslim countries became a flashpoint in early 2017, when the Trump administration suspended the resettlement of Syrian refugees, temporarily paused all refugee resettlement, and barred entry to noncitizens from seven nations—Iran, Iraq, Libya, Somalia, Sudan, Syria, and Yemen. The “travel ban”—sometimes referred to as a “Muslim ban” because it covered a number of Muslim-majority countries—went through additional iterations in subsequent years, including in response to legal challenges. Although eventually revoked by the Biden administration in early 2021, the policy nonetheless contributed to a drop in the number of people from the affected countries arriving through humanitarian migration as well as through other permanent and temporary immigration channels.
Click here to read more about the Trump executive order on refugees and the travel ban.
Click here for an overview of policies at different points during the Trump administration, including regarding the ban.
While the numbers of resettled refugees from Libya (118) and Yemen (106) between FY 2012 and FY 2022 were small, other Muslim-majority countries were among the largest U.S.-bound refugee origins. Between FY 2012 and FY 2022, 83,000 refugees from Iraq were resettled in the United States, 46,800 from Somalia, 27,900 from Syria, 17,400 from Iran, and 11,900 from Afghanistan. Nationals of these five countries represented 187,100 refugees, or 37 percent of all refugees resettled during that decade.
Latin American and Caribbean Refugees
Refugee resettlement from Latin America and the Caribbean has been consistently low despite the growing need for humanitarian protection. Changing policies and sociopolitical contexts may allow for the arrival of more refugees from this region in the near future.
Historically, Cubans have been the largest refugee group from the Western Hemisphere, in large part due to their ability since 1987 to be processed for refugee status from within Cuba, as well as other special considerations for those fleeing the Communist regime. Between FY 2012 and FY 2022, 57 percent of Latin American and Caribbean refugees were from Cuba (see Figure 3). However, numbers have fallen dramatically since FY 2015, when the United States and Cuba began normalizing relations. In FY 2012, 94 percent of regional refugees were Cuban. No Cuban nationals arrived as refugees in FY 2022 and just 11 had come in the first eight months of FY 2023.
Figure 3. Origins of U.S. Refugee Arrivals from Latin America and the Caribbean, FY 2012-22

Source: MPI analysis of State Department WRAPS data.
FY 2016 witnessed a significant uptick in the number of Salvadorans escaping violence, insecurity, and political persecution. They represented 21 percent of all Latin American and Caribbean refugees in FY 2022 and 17 percent in the decade since FY 2012. Colombians, who have fled more than 50 years of armed conflict, represented 11 percent of all refugees from the region in FY 2022 and 13 percent in the decade since FY 2012.
Venezuelans could be among the top refugee-origin groups in coming years. Political and economic crises have driven more than 7 million people from Venezuela since 2015, the vast majority (about 6 million) relocating to nearby countries, primarily Colombia, Peru, Ecuador, Chile, and Brazil. The United States admitted 193 Venezuelans as refugees between FY 2012 and FY 2022, and 647 in the first eight months of FY 2023. Given the size and scale of the displacement, it is likely that these numbers will increase (several thousand Venezuelans have been granted asylum, as discussed below).
In the first eight months of FY 2023, refugees’ top initial resettlement destinations were Texas (approximately 10 percent, or 3,100 individuals), New York (6 percent, or 2,000 refugees), California (6 percent, or 1,800 individuals), Kentucky (5 percent, or 1,600), and Pennsylvania (5 percent, or 1,500). Other notable states of resettlement in FY 2023 were Michigan (1,400), Ohio (1,400), North Carolina (1,300), Arizona (1,300), and Washington (1,300). Fifty-two percent of all refugees resettled during the period were in one of these ten states.
This trend is roughly consistent with prior years. Five states—Texas, California, New York, Michigan, and Ohio—received one-third of the 508,100 refugees resettled nationwide between FY 2012 and FY 2022 (see Figure 4).
Figure 4. Refugee Arrivals by Initial U.S. State of Residence, FY 2012-22

Note: Data do not account for refugees’ movement between states after their initial resettlement.
Source: MPI analysis of State Department WRAPS data.
States also differ quite significantly by resettled refugees’ countries of origin. For example, refugees from DRC—the largest group admitted to the United States in the first eight months of FY 2023—comprised the top group in only 28 states. Six states resettled more Burmese refugees than any other nationality. Five states received more Syrian refugees than any other group. Refugees from Afghanistan made up the largest groups in California and Virginia. Ukrainians were the top group in Washington state, Venezuelans were top in Florida, and Somalians were the largest in Minnesota.
Arriving refugees are placed in communities based on factors including their needs, family ties, and the receiving community’s language and health-care services, housing availability, educational and job opportunities, and cost of living. In early 2023, the Biden administration launched Welcome Corps, an initiative that allows groups of U.S. citizens and permanent residents to privately sponsor refugees identified for protection by the resettlement program. Sponsors must submit a welcome plan, pass background checks, donate or raise $2,375 per refugee, and commit to supporting them for at least 90 days.
Overall, the United States admitted more Christian refugees in the past decade than those of any other religion. Between FY 2012 and FY 2022, Christians represented 49 percent (246,900) of all 508,100 resettled refugees. Christians’ share was much higher for some nationalities, including some of the largest groups. For instance, in FY 2022, 94 percent of refugees from the Democratic Republic of the Congo, 78 percent from Eritrea, and 44 percent from Iran reported being Christian.
During the last decade, 36 percent (184,000) of refugees admitted to the United States were Muslim. Virtually all refugees from Somalia and Syria were Muslim, as were 81 percent of refugees from Iraq and 44 percent from Myanmar.
FY 2016 marked the only time since 2012 when the United States resettled more Muslim refugees (46 percent, or 38,900 individuals) than Christians (44 percent, or 37,500 individuals) (see Figure 5). The Trump administration’s restrictions on admission of nationals of some mostly Muslim countries, additional vetting procedures, and historically low admissions ceilings substantially affected the proportion of resettled Muslim and Christian refugees. Under the Biden administration, there has been an increase in the number of resettled Muslim refugees, closer to the levels of prior years.
Over the last decade, the shares of refugees identifying as Buddhist, Hindu, or members of other religions fell, and the shares of the two dominant religious groups—Christians and Muslims—increased. Whereas followers of these two religions accounted for 68 percent of resettled refugees in FY 2012, their share went up to 96 percent in FY 2022.
Figure 5. Religions of Refugees Admitted to the United States, FY 2012-22
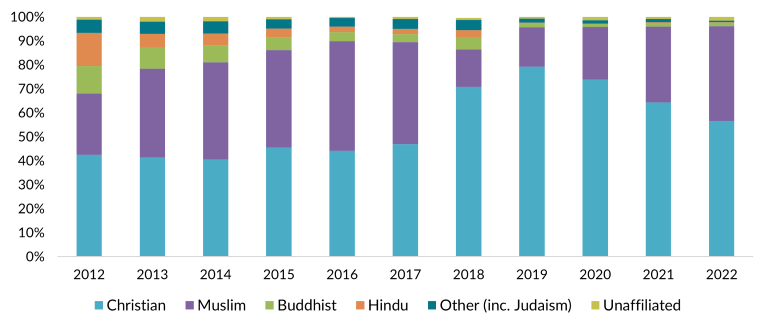
Source: MPI analysis of State Department WRAPS data.
Just a fraction of the world’s 32.5 million refugees as of mid-2022 are ever resettled; the vast majority remain in countries of first asylum. The U.S. refugee resettlement program focuses on admitting the most vulnerable populations and those believed to have the best prospects for long-term integration. Individuals with critical medical conditions or disabilities and families with young children are typically prioritized for resettlement. Between FY 2010 and FY 2020 (the latest publicly available years with age and sex breakdown), 31 percent of refugees admitted to the United States were children under age 14, 33 percent were women and girls ages 14 and older, and 36 percent were men and boys ages 14 and older.
Asylees
In FY 2021 (the most recent data available), close to 17,700 people were granted asylum either affirmatively or defensively, a 43-percent decrease from 31,000 in 2020 and a 61-percent decrease from 45,900 in 2019. Of the 17,700 new asylees, 58 percent (more than 10,300 individuals) were granted asylum affirmatively, while the remaining 42 percent (nearly 7,400 individuals) were granted asylum defensively. (See Box 3 for explanation of the differences between affirmative and defensive asylum.) Additionally, 2,150 individuals were granted derivative asylum status within the United States as immediate family members of principal asylum applicants, while 2,200 individuals obtained derivative status outside the country. (Note: This reflects the number of travel documents issued to family members residing abroad, not their actual arrival to the United States.)
Nationals of Venezuela, China, and El Salvador accounted for 31 percent (5,500) of those granted asylum in FY 2021 (see Table 3). Nationals from El Salvador, Honduras, and Guatemala combined represented close to 22 percent of all asylum grants in FY 2021, compared to just 4 percent in FY 2010.
Table 3. Affirmative, Defensive, and Total Grants of Asylum by Nationality, FY 2021
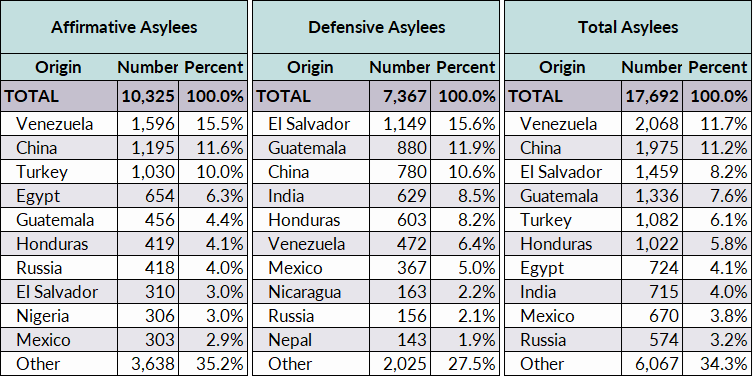
Source: U.S. Department of Homeland Security (DHS) Office of Immigration Statistics, 2021 Yearbook of Immigration Statistics, available online.
Between FY 2012 and 2021, nearly 280,100 people were granted asylum. Chinese were by far the largest group, accounting for 23 percent of all asylum grants during the decade.
Click here for an overview of the Biden administration’s changes to the asylum system at the U.S.-Mexico border.
Adjustment to Lawful Permanent Resident Status
In FY 2021, 56,400 refugees and asylees adjusted their status to lawful permanent residence (also known as getting a green card), of whom 35,800 (64 percent) were refugees and 20,600 (36 percent) were asylees (see Figure 6).
Figure 6. Refugees and Asylees Granted U.S. Lawful Permanent Residence, FY 2000-21
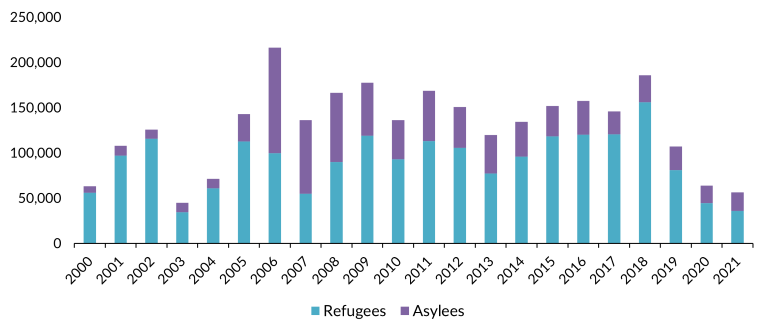
Source: DHS Office of Immigration Statistics, Yearbook of Immigration Statistics, various years, available online.
Refugees must apply for a green card one year after being admitted to the United States. Asylees become eligible to adjust to LPR status after one year of residence but are not required to do so. As green-card holders, refugees and asylees are eligible to receive federal student financial aid, join certain branches of the U.S. armed forces, and return from international travel without a U.S. entry visa. They generally may also apply for U.S. citizenship five years after being admitted.
More than 1.3 million asylum applications were awaiting processing as of May. Of these, approximately 750,000 were pending in immigration courts—comprising about 40 percent of all cases in the immigration court system—and 600,000 were with U.S. Citizenship and Immigration Services (USCIS). The average asylum case in immigration court takes more than 4.2 years to be completed.
Support for this Spotlight was provided in part by the Doris Duke Foundation.
Sources
American Immigration Council. 2023. Beyond a Border Solution: How to Build a Humanitarian Protection System that Won’t Break. Washington, DC: American Immigration Council. Available online.
Baugh, Ryan. 2022. Annual Flow Report: Refugees and Asylees: 2021. Washington, DC: U.S. Department of Homeland Security (DHS), Office of Immigration Statistics. Available online.
Capps, Randy and Michael Fix. 2015. Ten Facts about U.S. Refugee Resettlement. Migration Policy Institute (MPI) fact sheet, October 2015. Available online.
Chaves-González, Diego and Carlos Echeverría-Estrada. 2020. Venezuelan Migrants and Refugees in Latin America and the Caribbean: A Regional Profile. Washington, DC: MPI. Available online.
Chishti, Muzaffar and Jessica Bolter. 2019. The Travel Ban at Two: Rocky Implementation Settles into Deeper Impacts. Migration Information Source, January 31, 2019. Available online.
---. 2021. Border Challenges Dominate, but Biden’s First 100 Days Mark Notable Under-the-Radar Immigration Accomplishments. Migration Information Source, April 26, 2021. Available online.
Bruno, Andorra. 2018. Refugee Admissions and Resettlement Policy. Washington, DC: Congressional Research Service. Available online.
Flahaux, Marie-Laurence and Bruno Schoumaker. 2016. Democratic Republic of the Congo: A Migration History Marked by Crises and Restrictions. Migration Information Source, April 20, 2016. Available online.
Meissner, Doris. 2017. Taking Action to Reflect Current Reality: Obama Administration Ends “Wet Foot, Dry Foot” Policies on Cuban Migration. MPI commentary, January 2017. Available online.
Pierce, Sarah and Jessica Bolter. 2020. Dismantling and Reconstructing the U.S. Immigration System: A Catalog of Changes under the Trump Presidency. Washington, DC: MPI. Available online.
United Nations High Commissioner for Refugees (UNHCR). 2022. Global Trends: Forced Displacement in 2021. Geneva: UNHCR. Available online.
---. 2023. Venezuela Situation. Updated January 2023. Available online.
---. N.d. Figures at a Glance. Accessed June 12, 2023. Available online.
U.S. State Department, Bureau of Population, Refugees, and Migration, Refugee Processing Center. 2023. Refugee Admissions Report. Updated June 5, 2023. Available online.
---. 2023. Refugee Arrivals by State and Nationality. Updated June 5, 2023. Available online.
U.S. Department of Homeland Security (DHS), Office of Immigration Statistics. 2022. Yearbook of Immigration Statistics 2021. Washington, DC: DHS, Office of Immigration Statistics. Available online.