

Frequently Requested Statistics on Immigrants and Immigration in the United States

Reflecting some of the many nationalities that make up the American experience. (Photo: Nicola/Flickr)
Immigration has become far more central in the public conversation in the United States, typically the topic of political controversy, dueling statistics, and perceptions that often are at a significant lag to changing realities on the ground.
To this latter point: It has yet to be widely recognized that the immigrant population is growing far more slowly than in recent years, and that the unauthorized population has peaked and may even have declined. The makeup of the foreign-born population is also changing: New arrivals in the United States are more likely to be from Asia and less likely to be from than other world regions, and they are on average more educated than previous generations of migrants to the United States. The Mexican immigrant population in the United States has declined by half a million people since the beginning of the decade. And in 2018, the United States ceded its status as the world’s top country for resettling refugees, surpassed by Canada.
Seeking to inform conversations around immigration, this Spotlight offers answers to some of the most frequently asked immigration-related questions, drawing on the most authoritative, current data available about the 44.7 million immigrants residing in the United States as of 2018. Among the questions it answers: Who is immigrating to the United States today and from where? How many people arrive in the country through the various immigration channels? Do they speak English? Where do they live and work? How many immigrants become U.S. citizens? How many apply and receive asylum in the United States?
To answer these questions, this article draws on the most recent resources and data from the Migration Policy Institute (MPI); the U.S. Census Bureau (using its 2018 American Community Survey [ACS], 2019 Current Population Survey [CPS], and 2000 decennial census); and the U.S. Departments of Homeland Security (DHS) and State. (Note: DHS and State Department data refer to fiscal years that begin on October 1 and end on September 30; ACS and CPS data refer to calendar years). For more detailed information on U.S. and global immigration data sources and one-click access to these datasets, see the MPI resource: Immigration Data Matters.
Click on the bullet points for more information on each topic:
- Immigrants Now and Historically
- Demographic, Educational, and Linguistic Characteristics
- Immigrant Destinations
- Immigrants in the Labor Force
- Income and Poverty
- Health Insurance Coverage
- Children of Immigrants
- Permanent Immigration
- Temporary Visas
- Refugees and Asylum Seekers
- Unauthorized Immigrants
- Immigration Enforcement
- Naturalization Trends
- Visa Backlogs
Immigrants Now and Historically
How many immigrants reside in the United States?
More than 44.7 million immigrants lived in the United States in 2018, the historical numeric high since census records have been kept. One in seven U.S. residents is foreign born, according to 2018 American Community Survey (ACS) data. Immigrants’ current share of the overall U.S. population—13.7 percent of the country’s 327.2 million people—remains below the record-high 14.8 percent hit in 1890, but is a very significant increase over the record low 4.7 percent marked in 1970.
The foreign-born population remained largely flat between 2017 and 2018, with an increase of 203,000 people, or growth of less than 0.5 percent. That is the lowest annual increase since 2010, and a significant drop from the 1.8 percent increase recorded from 2016 to 2017. To put this in a broader demographic context, the United States has experienced slowing total population growth every year since 2015 because of drops in natural increase (the difference between births and deaths) and net international migration (the difference between those who arrived and departed).
How have the number and share of immigrants changed over time?
The U.S. government first began collecting data on the nativity of the population in the 1850 census. That year, there were 2.2 million immigrants, representing nearly 10 percent of the population.
Between 1860 and 1910, the immigrant share fluctuated between 13 percent and almost 15 percent of the overall population, peaking at 14.8 percent in 1890, largely due to high levels of immigration from Europe.
Restrictive immigration laws in 1921 and 1924—which kept permanent immigration open almost exclusively to northern and western Europeans—coupled with the Great Depression and World War II, led to a sharp drop in new arrivals from the Eastern Hemisphere. The foreign-born share steadily declined, hitting a record low of 4.7 percent in 1970 (9.6 million; see Figure 1).
- How has immigration to the United States fluctuated over time? Check out the U.S. Immigrant Population and Share over Time, 1850-Present data tool.
Figure 1. Size and Share of the Foreign-Born Population in the United States, 1850-2018
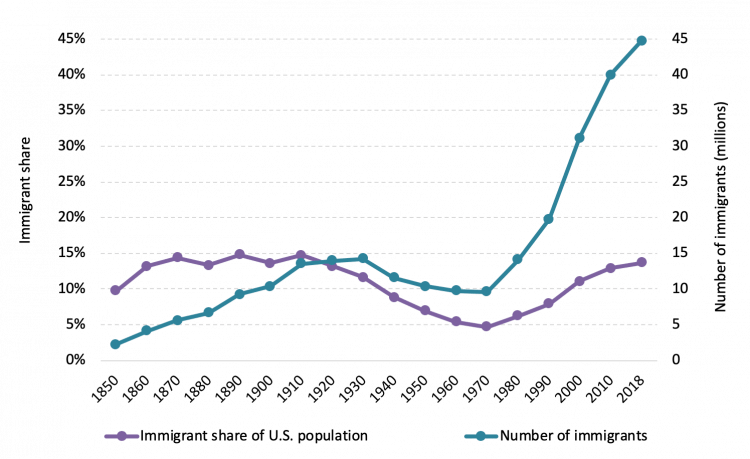
Source: Migration Policy Institute (MPI) tabulation of data from U.S. Census Bureau, 2010-2018 American Community Surveys (ACS), and 1970, 1990, and 2000 Decennial Census. All other data are from Campbell J. Gibson and Emily Lennon, "Historical Census Statistics on the Foreign-Born Population of the United States: 1850 to 1990" (Working Paper no. 29, U.S. Census Bureau, Washington, DC, 1999).
Since 1970, the share and number of immigrants have increased rapidly, mainly because of large-scale immigration from Latin America and Asia, with the foreign-born population standing at 44.7 million as of 2018. Important shifts in U.S. immigration law (including the Immigration Act of 1965 that abolished national-origin admission quotas, the Refugee Act of 1980, and preferential treatment of Cuban immigrants); the United States’ growing economic and military presence in Asia and Latin America; economic ties, powerful immigrant networks, and deep migration history between the United States and its southern neighbors; and major economic transformations and political instability in countries around the world all have helped usher in the vast diversification of immigration flows.
- To see the changing regional makeup of immigration to the United States, use the Regions of Birth for Immigrants in the United States, 1960-Present data tool.
- Read about historical U.S. immigration trends and policies in Immigration in the United States: New Economic, Social, Political Landscapes with Legislative Reform on the Horizon.
- Learn about the impact of the 1965 law in Fifty Years On, the 1965 Immigration and Nationality Act Continues to Reshape the United States.
- Read more about the end of national-origin quotas in The Geopolitical Origins of the U.S. Immigration Act of 1965.
How do today’s top countries of origin compare to those 50 years ago?
In 2018, Mexicans comprised 25 percent of all immigrants in the United States. Although still exceeding any other immigrant group by far, the Mexican share of the total foreign-born population has dropped since 2000 when it was 30 percent. After Mexicans, Indians represented the second-largest immigrant share with about 6 percent, followed by Chinese (including those born in Hong Kong and Macao but not Taiwan) and Filipinos, each making up about 5 percent of the overall immigrant population. Rounding out the top ten were immigrants from El Salvador, Vietnam, Cuba, and the Dominican Republic (each accounting for 3 percent each); and Korea and Guatemala (each 2 percent). These ten countries collectively accounted for 57 percent of all immigrants in the United States in 2018.
The predominance of Latin American and Asian immigration in the late 20th and early 21st centuries starkly contrasts with the trend in the mid-1900s, when immigrants were largely European. In the 1960s no single country accounted for more than 15 percent of the total immigrant population. Italians were the top origin group, making up 13 percent of the foreign born in 1960, followed by Germans and Canadians (about 10 percent each).
- To see immigration trends from individual countries over time, use the Countries of Birth for U.S. Immigrants, 1960-Present data tool.
How many immigrants have entered the United States since 2010, and what are the leading sending countries?
Twenty-three percent of the 44.7 million immigrants in the United States in 2018 entered the country in 2010 or later, 25 percent between 2000 and 2009, 21 percent between 1990 and 1999, and 30 percent entered before 1990.
While immigrants from Mexico dominated the flows post-1970, the composition of new arrivals has changed since 2010. Recently arrived immigrants are more likely to come from Asia, with India and China leading the way. The number of immigrants from the Dominican Republic, the Philippines, Cuba, Venezuela, and El Salvador have also increased between 2010 and 2018. By contrast, there were more than half a million fewer Mexican immigrants in the United States in 2018 than in 2010, representing the biggest absolute decline of all immigrant groups.
Among the countries with at least 100,000 immigrants in the United States in 2018 that experienced the fastest growth between 2010 and 2018, the top five were Nepal (an increase of 127 percent), Venezuela (120 percent), Afghanistan (112 percent), Syria (93 percent), and Nigeria (83 percent).
- Read more on immigrants from New Origin Countries in the United States.
- Check out Largest U.S. Immigrant Groups over Time, 1960-Present, an interactive tool showing the top ten source countries by decade.
- To learn more about key immigrant populations, check out the Migration Information Source’s Spotlights archive, which includes data-rich articles on individual immigrant groups in the United States, including Mexicans, Indians, Chinese, Vietnamese, Koreans, South Americans, Europeans, sub-Saharan Africans, and those from the Middle East-North Africa region.
How many U.S. residents are of recent immigrant origin?
Immigrants and their U.S.-born children now number approximately 90 million people, or 28 percent of the overall U.S. population, according to the 2019 Current Population Survey (CPS). The Pew Research Center projects that the immigrant-origin share will rise to about 36 percent by 2065.
Demographic, Educational, and Linguistic Characteristics
What is the median age for immigrants?
The median age of the overall immigrant population in 2018 was 45.2 years, making the foreign-born population older than the native-born population, which had a median age of 36.3 years. The immigrant population is generally older because the children of many immigrants are born in the United States, which contributes to the lower median age of the U.S.-born population.
Fewer than 1 percent of immigrants were under age 5 in 2018, whereas 7 percent of the U.S.-born population was under age 5 that year. Five percent of immigrants were aged 5 to 17 years, compared to 18 percent of the native born; approximately 78 percent of immigrants were 18 to 64 years, compared to 59 percent of the U.S. born; and 16 percent of immigrants were aged 65 years and older, the same proportion as the U.S. born.
What is the female share of the immigrant population?
In 2018, about 52 percent of all immigrants were female. The share has fluctuated slightly over the past four decades; women accounted for 53 percent of immigrants in 1980, 51 percent in 1990, 50 percent in 2000, and 51 percent in 2010.
What is the racial makeup of immigrants?
In 2018, 46 percent of immigrants reported their race as single-race White, 27 percent as Asian, 10 percent as Black, and 15 percent as some other race. About 2 percent reported having two or more races.
How many immigrants are Hispanic or Latino?
In 2018, 44 percent of U.S. immigrants (19.8 million people) reported having Hispanic or Latino origins.
Note: The Census Bureau classifies Hispanic and Latino as ethnic categories, separate from the racial categories listed above (see Definitions box for more information).
How many Hispanics in the United States are immigrants?
The majority of U.S. Hispanics are native born. Of the 59.8 million people in 2018 who self-identified as Hispanic or Latino, 33 percent (19.8 million) were immigrants and 67 percent (40 million) were native born.
- Use the MPI Data Hub State Immigration Data Profiles tool to learn more about the demographic characteristics of immigrants and the U.S. born (including race and ethnicity) in each of the 50 states and the District of Columbia, as well as nationally.
Which languages are most frequently spoken in U.S. homes?
In 2018, approximately 78 percent (240.3 million) of all 307.5 million people ages 5 and older regardless of nativity reported speaking only English at home. The remaining 22 percent (67.3 million) reported speaking a language other than English at home.
At the national level, Spanish is the language most commonly spoken after English. Among people speaking a language other than English at home, 62 percent were Spanish speakers, followed by speakers of Chinese (5 percent, including Mandarin and Cantonese); Tagalog (almost 3 percent); and Vietnamese, Arabic, French (including Cajun), and Korean (about 2 percent each) (see Table 1).
Table 1. Top Languages* Spoken at Home, Population Ages 5 and Older, United States, 2018
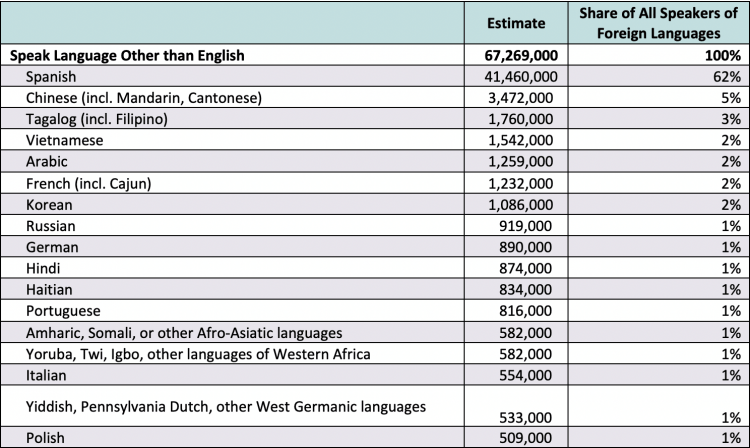
* The table lists languages that have at least 500,000 speakers.
Source: Migration Policy Institute (MPI) tabulation of data from the U.S. Census Bureau 2018 American Community Survey (ACS).
Spanish was the most common language after English in all but four states: Alaska (Aleut, Eskimo dominated), Hawaii (Ilocano, Samoan, Hawaiian, or other Austronesian languages), and Maine and Vermont (French). See the map below that shows the most commonly spoken languages other than English and Spanish by state.
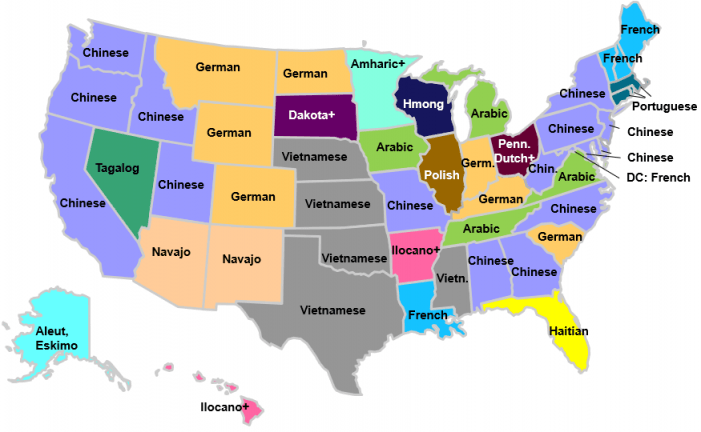
Notes: Amharic+ includes Amharic, Somali, Cushite, Beja, or other Afro-Asiatic languages; Chinese includes Mandarin and Cantonese; Dakota+ includes Dakota, Lakota, Nakota, and Sioux; French includes Cajun; Ilocano+ includes Ilocano, Samoan, Hawaiian, Marshallese, or other Austronesian languages; Pennsylvania Dutch+ includes Pennsylvania Dutch, Yiddish, or other West Germanic languages; and Tagalog includes Filipino.
Source: MPI analysis of data from the U.S. Census Bureau 2018 ACS.
How many immigrants are Limited English Proficient (LEP)?
In 2018, approximately 47 percent (20.8 million) of the 44.4 million immigrants ages 5 and older were Limited English Proficient (LEP). Immigrants accounted for 81 percent of the country’s 25.6 million LEP individuals.
Note: The term "Limited English Proficient" refers to persons ages 5 and older who reported speaking English "not at all," "not well," or "well" on their survey questionnaire. Individuals who reported speaking “only English” or speaking English "very well" are considered proficient in English.
- Read more about the LEP population in Language Diversity and English Proficiency in the United States.
- Limited English Proficient Population: Number and Share, by State, 1990, 2000, 2010, and 2018.
What share of the immigrant population has a college education?
In 2018, 32 percent (12.6 million) of the 39.3 million immigrants ages 25 and older had a bachelor's degree or higher, compared to 33 percent of U.S.-born adults (see Figure 3). Notably, the share of college-educated immigrants was much higher—47 percent—among those who entered the country between 2013 and 2018.
Figure 3. Educational Attainment of U.S.-Born, Immigrant, and Recently Arrived Immigrant Residents, 2018
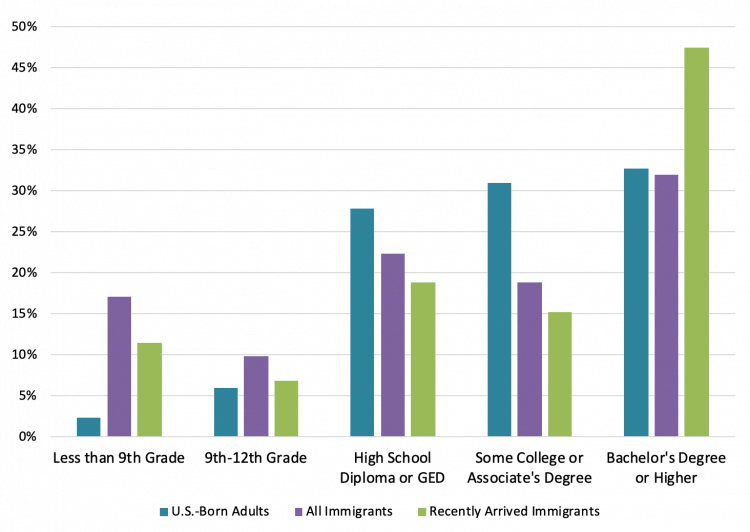
Source: MPI tabulation of data from the U.S. Census Bureau 2018 ACS.
Educational attainment varies by country of origin. In 2018, 80 percent of Indian immigrant adults in the United States had a bachelor’s degree or more. Other top countries: United Arab Emirates (74 percent), Taiwan (73 percent), Singapore (70 percent), and Saudi Arabia (69 percent).
- Educational Attainment Among U.S.-Born Adults and All Immigrant Adults by Country of Birth in 2018.
- Read more about the socioeconomic characteristics of highly skilled immigrants in College-Educated Immigrants in the United States.
Immigrant Destinations
In 2018, the top five U.S. states by number of immigrants were California (10.6 million), Texas (4.9 million), Florida (4.5 million), New York (4.4 million), and New Jersey (2 million).
When classified by the immigrant share of the total population, the top five states in 2018 were California (27 percent), New Jersey (23 percent), New York (23 percent), Florida (21 percent), and Nevada (19 percent).
- Interested in the top U.S. destinations for immigrants by country or region of origin? Use our interactive maps to see top immigrant concentrations at state and county or metropolitan-area levels.
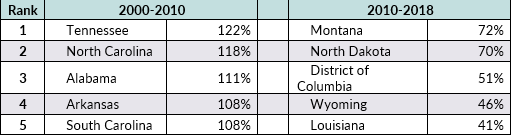
While traditional immigrant destinations lead in terms of absolute number of new immigrants, other states have seen much larger relative growth in their immigrant populations (see Table 2).
Table 2. Top Five States by Absolute and Percent Growth in Immigrant Population, 2000-10 and 2010-18
Absolute growth
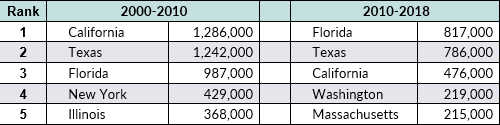
Percent Change
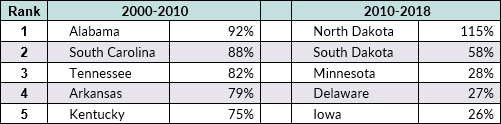
Note: In some states, the initial foreign-born population was quite small. Thus, relatively small absolute increases in the immigrant population in these states have translated into high percent growth.
Source: MPI tabulation of data from the U.S. Census Bureau 2010 and 2018 ACS and 2000 Decennial Census.
- For more information on the top states of residence for the foreign born, see the interactive tool, Immigrant Population by State, 1990-Present.
Immigrants in the Labor Force
How many immigrants are in the U.S. civilian labor force?
Immigrants constituted 17 percent (28.4 million) of the civilian labor force (164.9 million) in 2018. The foreign-born share of the civilian labor force in 2018 is more than three times the share in 1970, when approximately 5 percent of the labor force was comprised of immigrants. Between 1970 and 2018, the foreign-born share of the overall U.S. population grew somewhat slower, from less than 5 percent to close to 14 percent—meaning immigrants participate in the workforce at higher levels than the U.S. born.
- For more on the evolving share of immigrants in the labor force nationwide and by state, see Immigrant Share of the U.S. Population and Civilian Labor Force, 1980-Present.
What types of jobs do immigrants perform?
Of the 27.2 million employed foreign-born workers ages 16 and older in 2018, the largest share, more than 33 percent, worked in management, professional, and related occupations. See Figure 4 for other occupations.
Figure 4. Employed Workers in the Civilian Labor Force (ages 16 and older), by Nativity and Occupation, 2018
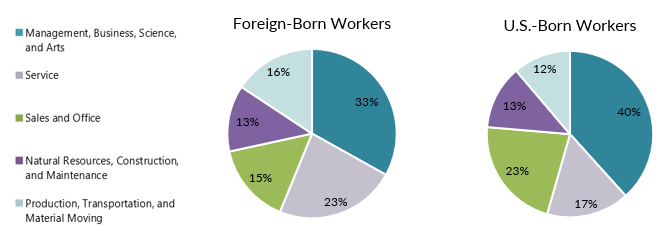
Note: Numbers may not add up to 100 as they are rounded to the nearest whole number.
Source: MPI tabulation of data from the U.S. Census Bureau 2018 ACS.
Check out the Data Hub’s State Immigration Data Profiles for more information on the labor force participation of immigrants and the U.S. born in the United States, each of the 50 states, and the District of Columbia.
Income and Poverty
In 2018, the median income of immigrant households was $60,000, compared to $62,000 for native-born households.
Fifteen percent of immigrants were poor (that is, with family incomes below the official poverty threshold), compared to 13 percent of the U.S.-born population.
Health Insurance Coverage
What share of immigrants have health insurance?
In 2018, approximately 57 percent of U.S. immigrants had private health insurance (compared to 69 percent of the U.S. born), and 30 percent had public health insurance coverage (compared to 37 percent).
Since implementation of the Affordable Care Act (ACA) in 2014, health insurance coverage improved for both the U.S. born and immigrants. From 2013 to 2017, the immigrant uninsured rate fell from 32 percent to 20 percent, and the rate for the native born fell from 12 percent to 7 percent. In 2017, the Trump administration made a number of changes to policies initiated by the ACA, including removing the individual coverage mandate, ending cost-sharing subsidies to insurers, and cutting funding for navigator programs. In 2018, the share of uninsured among the immigrant population remained at about 20 percent.
Note: Health insurance coverage is calculated only for the civilian, noninstitutionalized population. Since some people may simultaneously hold both private and public health insurance coverage, estimates of those with private health insurance and those with public coverage may overlap. Their sum therefore may be greater than the total number of people with health insurance.
Children of Immigrants
How many U.S. children live with immigrant parents?
In 2018, approximately 18 million U.S. children under age 18 lived with at least one immigrant parent. They accounted for 26 percent of the 69.5 million children under age 18 in the United States, up from 13 percent in 1990 and 19 percent in 2000.
Second-generation children—born in the United States to at least one foreign-born parent—accounted for 88 percent (15.9 million) of all children under age 18 with immigrant parents. The remaining 12 percent (2.1 million) were born outside the United States.
- For state-by-state and age information on children living with immigrant parents, see the Children in U.S. Immigrant Families data tool.
How has the number of children in immigrant families changed over time?
Between 2000 and 2010, the number of children ages 17 and under with immigrant parents grew 30 percent, from 13.1 million to 17 million. Between 2010 and 2018, the number grew by another 6 percent, reaching 18 million.
The population of first-generation children—those born outside the United States—declined by 12 percent between 2000 and 2010 (from 2.7 million to 2.4 million) and then by another 11 percent between 2010 and 2018 to 2.1 million.
In contrast, the number of second-generation children has grown steadily since 2000. Between 2000 and 2010, the number increased by 40 percent (from 10.4 million to 14.6 million), followed by a 9 percent increase between 2010 and 2018, reaching 15.9 million.
How many children living with immigrant parents are in low-income families?
In 2018, there were 26.9 million children under age 18 living in low-income families (i.e., with family incomes below 200 percent of the federal poverty threshold). Of them, 8.5 million (or 32 percent) were children of immigrants.
Children of immigrants were more likely to be in low-income families (47 percent of the 18 million) compared to children of U.S.-born parents (36 percent of the 51.5 million).
- For state-level estimates of children of immigrants and share in low-income families, see the Demographic and Social Profiles in the State Immigration Data Profiles tool.
Which states have the largest number of children in immigrant families and which ones have experienced the fastest growth of this population?
In 2018, the top five states by the total number of children under age 18 living with immigrant parents were California (4 million), Texas (2.5 million), New York (1.4 million), Florida (1.4 million), and New Jersey (766,000). These states accounted for 56 percent of the 18 million U.S. children with immigrant parents.
In terms of the share of children with immigrant parents, the top five states in 2017 were California (47 percent of all children in the state), New Jersey (41 percent), New York (37 percent), Nevada (37 percent), and Texas (35 percent).
While traditional immigrant destinations experience the largest absolute growth in children with immigrant parents over time, other states have seen much larger relative growth (see Table 3).
Table 3. Top Five States by Absolute and Percent Growth in Children with Immigrant Parents, 2000-10 and 2010-18
Absolute Growth
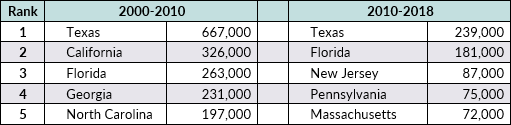
Percent Change
Note: In some states, the initial number of children with immigrant parents was quite small. Thus, relatively small absolute increases in the immigrant population in these states have translated into high percent growth.
Source: MPI tabulation of data from the U.S. Census Bureau 2010 and 2018 ACS and 2000 Decennial Census.
Permanent Immigration
How many immigrants obtained lawful permanent residence (aka getting a green card) in 2018?
In fiscal year (FY) 2018, nearly 1.1 million immigrants became lawful permanent residents (LPRs, also known as green-card holders). The number of new LPRs in 2018 decreased by 3 percent from 2017 (a drop of 30,600). In the past decade, the annual number of new green-card recipients has ranged from 991,000 (in 2013) to 1.2 million (in 2016).
In recent years, immigrants obtaining LPR status have been, on average, about evenly divided between those already living in the United States who are adjusting their status and those applying from outside the country. Fifty-two percent (or 568,000) of the 1.1 million new LPRs in 2018 received green cards from within the United States. Many of these new permanent residents are spouses, minor children, and parents of U.S. citizens, or persons who arrived as refugees or as temporary workers.
About 529,000 of the new LPRs (48 percent) were granted this status from abroad. The share of new arrivals rose steadily in the past decade from 41-42 percent in 2008-09, to 46-47 percent in 2013-14, and surpassed 50 percent in 2016. Most new arrivals are immediate family members of U.S. citizens and LPRs.
- Trace changing immigration trends over time with the Legal Immigration to the United States, 1820-Present data tool.
Under which categories are permanent immigrants admitted?
There are four main pathways to obtain a green card: through a family relationship, employment sponsorship, humanitarian protection (refugees and asylees), and the Diversity Visa (DV) lottery (also known as the green-card lottery).
Overall, of the 1.1 million immigrants who received green cards in 2018, 44 percent were immediate relatives of U.S. citizens (the immediate relative visa category is uncapped), followed by another 20 percent of family-related immigrants whose admission is limited by visa and country caps.
Seventeen percent adjusted from refugee or asylee status. About 13 percent of new LPRs were either sponsored by their employers or self-petitioned, including investors who create jobs. Approximately 4 percent were diversity lottery winners.
What are the top five countries of birth for new permanent immigrants in 2018?
The top five countries of birth were Mexico (15 percent), Cuba (7 percent), mainland China (6 percent), and India and the Dominican Republic (5 percent each). These countries represented about 38 percent of everyone who received a green card in 2018.
How many people are selected in the Diversity Visa lottery and where do they come from?
In FY 2018, 45,350 people from countries with low rates of immigration to the United States received a green card as diversity immigrants, representing approximately 4 percent of the 1.1 million new LPRs.
The leading countries of birth of DV immigrants were Nepal and Egypt, each accounting for about 8 percent of green-card lottery entrants adjusting to LPR status. Next of the list were Uzbekistan (7 percent); Ukraine (6 percent); and the Democratic Republic of the Congo, Albania, and Ethiopia (each with about 5 percent). Russia (4 percent), Turkey (3 percent), and Cameroon (3 percent) rounded out the top ten in 2018.
For some countries, the diversity visa lottery represents a major share of all new LPRs. For example, out of all Uzbek nationals adjusting to LPR status in 2018, 65 percent were DV immigrants. Shares were also high for nationals of Tajikistan (64 percent) and Algeria (51 percent). DV lottery winners represented between 40 and 48 percent of new LPRs born in Azerbaijan, Albania, Armenia, or Turkmenistan.
Created in 1990, the lottery sets aside 55,000 green cards annually, of which 5,000 must be used for applicants under the Nicaraguan and Central America Relief Act of 1997. Interest in the lottery is significantly higher than there are available visas: About 14.7 million qualified applications were registered for the DV-2018, covering 23.1 million applicants and their spouses and minor children. The number registering in the DV-2018 was 61 percent higher than the 9.2 million registered for the DV-2009. (The application number varies each year depending on which countries are eligible.) Before receiving permission to immigrate, lottery winners must provide proof of a high school education or its equivalent or show two years of work experience within the past five years in an occupation that requires at least two years of training or experience. They also must pass a medical exam and a background check.
- Read the most recent State Department Visa Bulletin for more on the DV lottery.
- For more information on the Diversity Visa program, read The Diversity Visa Program Holds Lessons for Future Legal Immigration Reform.
Temporary Visas
How many people have temporary visas?
According to the most recent Department of Homeland Security (DHS) estimates available at the time of this writing, 2.3 million foreign nationals on various temporary visas resided in the United States during 2016, up from about 2 million in 2015. Almost half (1,100,000) were temporary workers and their families, followed by 870,000 foreign students and their families (40 percent).
Sixty-one percent were from Asia. Nationals of countries in Europe and North America accounted for 15 percent each. The top five countries of origin—India, China, Mexico, Canada, and South Korea—accounted for 57 percent of all residents on temporary visas.
- Read about temporary nonimmigrant population trends, Temporary Visa Holders in the United States.
- Read about the size of the nonimmigrant population in the DHS publication, Estimates of the Size and Characteristics of the Resident Nonimmigrant Population in the United States.
How many people entered the United States on nonimmigrant visas?
According to the most recently available data from DHS, 42.7 million individuals entered in FY 2016 as I-94 nonimmigrants on various temporary visas. On average, each I-94 nonimmigrant was admitted 1.8 times. This is the first time, and to date the only time, the DHS Office of Immigration Statistics (OIS) has estimated the number of unique individuals who came temporarily, as opposed to the number of nonimmigrant admissions or entries.
Most of these nonimmigrants, 34.2 million, entered as tourists, followed by 3.7 million business visitors. Of these, 15 million tourists and 1.7 million business travelers were from Visa Waiver countries. Further, approximately 1 million international students entered on F-1 visas. OIS estimated that additionally about 290,300 individuals were admitted on high-skilled worker H-1B visas (mostly from India, China, Canada, the United Kingdom, and Mexico) and 81,600 on nonagricultural temporary or seasonal worker H-2B visas (mostly from Mexico, Jamaica, Guatemala, South Africa, and Canada).
How many nonimmigrant visas does the State Department issue?
In FY 2019, the annual number of nonimmigrant visas issued by the State Department decreased for the fourth time since 2015, to 8.7 million—a 3 percent decline from the 9 million issued in FY 2018 and a 20 percent decline from the recent high of nearly 11 million visas issued in FY 2015.
Three-quarters of the 8.7 million nonimmigrant visas issued in FY 2019 were temporary business and tourist visas (B and BCC visas). The next largest visa class was for academic students and exchange visitors and their family members (F and J visa categories), who comprised around 9 percent of all nonimmigrant visas issued in FY 2019. The third largest group was temporary workers and trainees and their family members (H visa categories), who comprised 7 percent of nonimmigrant visas.
Trump administration immigration policies implemented in 2017 and 2018 may in part explain the decline in admissions, including additional vetting procedures for certain groups, the travel ban barring individuals from seven countries (an expanded list of countries was added in 2020), and greater discretion for consular officers to deny visas. All applications from North Korea were denied in FY 2019. Other countries with high denial rates were Libya (89 percent of all visa applications), Iran (87 percent), Somalia (81 percent), Yemen (78 percent), Syria (75 percent), and Venezuela (60 percent). Although Chad was ultimately left out of the final iteration of the travel ban, 70 percent of B visa applications by Chadians were denied in FY 2019, an 18-percentage point increase from FY 2017. Between 2017 and 2019, visa refusal rates went up for visitors from some major non-travel ban countries as well, including Mexico (from 23 percent to 27 percent), China (from 15 percent to 18 percent), and India (from 23 percent to 28 percent).
Note: The number of visas issued does not necessarily match the number of foreign nationals who entered the United States in the same year because some nonimmigrant visas may not be used.
- Read the State Department’s Annual Reports of the Visa Office.
- Read the State Department’s fact sheet on Visa Refusals.
How many nonimmigrant admissions does DHS grant in a year?
In total, DHS granted 186 million nonimmigrant admissions in FY 2018, of which 105 million were admissions of Canadians and Mexicans traveling for business or pleasure. These travelers are exempt from completing the I-94 arrival/departure form at the port of entry, thus DHS does not provide characteristics for this group.
In 2018, there were 81.3 million total temporary admissions of I-94 nonimmigrants, a slight uptick from 77.6 million in 2017. (See Table 4.)
Table 4. Nonimmigrant Admissions by Category, FY 2018 (I-94 only)
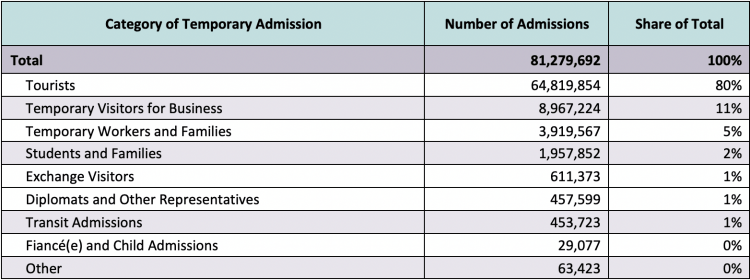
Note: Nonimmigrant admissions represent the number of entries. Individuals may have multiple entries within the year. OIS reports characteristics of nonimmigrants who must complete an I-94 arrival/departure form at entry.
Source: DHS Office of Immigration Statistics, Yearbook of Immigration Statistics 2018.
- Read more here: Nonimmigrant Admissions to the U.S. fact sheet.
Refugees and Asylum Seekers
How many refugees entered the United States, and where were they from?
Every year, the president in consultation with Congress sets the annual refugee admissions ceiling and allocations by region of origin. For FY 2019, the annual ceiling was set at 30,000 and for FY2020 at 18,000, both the lowest levels since the resettlement program was formally created in 1980. The Trump administration has asserted that cuts to the refugee program are necessary to shift resources and funding to address the backlog of cases in another system, the asylum one.
In FY 2019, 30,000 refugees were resettled in the United States, meeting the ceiling set for the year. This represents a 33 increase from the number of admissions in FY 2018 (22,491).
The Democratic Republic of the Congo (DRC), Myanmar (also known as Burma), Ukraine, Eritrea, and Afghanistan were the primary countries of nationality, accounting for 84 percent (25,296) of all refugees resettled in 2019. Rounding out the top ten were Syria, Iraq, Sudan, El Salvador, and Colombia. Together, nationals of the top ten countries comprised 91 percent (27,315) of all refugee arrivals in 2019. (See Table 5.)
Table 5. Top Ten Countries of Refugee Admissions by Nationality, FY 2019
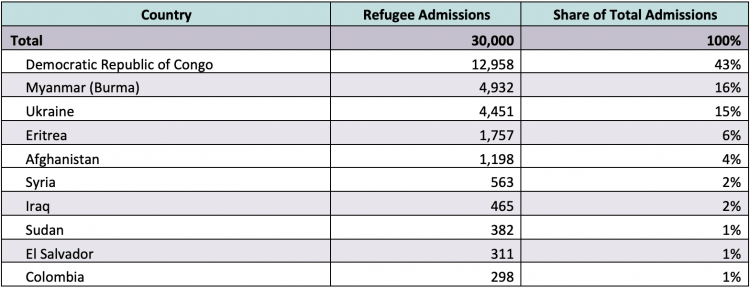
Source: MPI tabulation of Worldwide Refugee Admissions Processing System (WRAPS) data from the State Department’s Bureau of Population, Refugees, and Migration.
- Learn more with Ten Facts About U.S. Refugee Resettlement.
- For more data on refugees, including top resettlement states, read Refugees and Asylees in the United States.
- Learn more on refugee admissions by year, national origin, and destination with State Department WRAPS data.
How many asylum applications were filed and where are asylum seekers from?
In FY 2019, preliminary estimates show an estimated 84,000 affirmative asylum applications were received by U.S. Citizenship and Immigration Services (USCIS)—20 percent fewer than the 105,472 in FY 2018 and 40 percent fewer than the 139,777 in FY 2017. This marks the second year of declining applications after eight years of growth. Applicants for affirmative asylum must be present in the United States, and do not include those seeking asylum through the defensive asylum process while in removal proceedings.
For the third year in a row, Venezuela was the top country of origin for received affirmative asylum applications, with 24,531 in FY 2019; followed by China (9,737), Guatemala (9,620), El Salvador (5,960), and Honduras (5,548).
Meanwhile, 149,779 defensive asylum applications were filed with the Department of Justice’s immigration court system, known as the Executive Office for Immigration Review (EOIR), in FY 2019—a 30 percent increase from the 115,074 applications filed a year earlier.
What is the asylum approval rate?
According to USCIS data, 31 percent of affirmative asylum petitions adjudicated in FY 2019 were approved, a slight increase from the 30 percent in FY 2018, but a decline from the 43 percent in FY 2016 and 37 percent in FY 2017.
The same downward trend also applies to asylum petitions handled by immigration courts. In FY 2019, 29 percent of such petitions were approved, versus 43 percent in FY 2016, 37 percent in FY 2017, and 33 percent in FY 2018.
How many people receive asylum status?
In FY 2018, 38,687 individuals, including principal applicants and their spouses and/or unmarried children under age 21, were granted asylum after seeking protection upon or after arrival in the United States—a 46 percent increase from 26,509 a year earlier. An additional 6,304 individuals outside the United States were approved for asylum as immediate family members of principal applicants. (Note that this number reflects travel documents issued to these family members, not their arrival in the United States.)
The big increase in asylum grants was mainly driven by a spike in the number of cases granted by USCIS (rather than in the immigration courts), which rose to 25,439 in FY 2018 from 15,846 in FY 2017. This increase is largely because USCIS also increased the number of cases it adjudicated by more than 20,000. Further, in January 2018, in an attempt to reduce its backlog, USCIS started adjudicating asylum applications on a last-in, first-out basis. Applicants who know that their cases are likely to be adjudicated in weeks or months rather than years are less likely to submit non-meritorious cases.
China was the top country of origin for those receiving asylum, with 6,905 persons (or 18 percent of total asylum grants). The next four largest countries of origin were Venezuela (6,087), El Salvador (2,963), Guatemala (2,358), and Honduras (2,029). Together, nationals of these five countries made up 53 percent of those receiving asylum in FY 2018.
What is the current asylum application backlog?
Due to the large application volume and limited resources, both the affirmative and defensive asylum systems have extensive backlogs. At the end of September 2019, according to USCIS, there were 339,836 affirmative cases pending; EOIR reported 476,000 pending asylum cases as of October 11, 2019.
- For more information, see the affirmative asylum quarterly reports from USCIS, the workload and adjudication statistics data on asylum cases from EOIR, and the Refugees and Asylees Annual Flow Report from DHS’s Office of Immigration Statistics.
- For more on the immigration court backlog and asylum share, see the MPI report, The U.S. Asylum System in Crisis: Charting a Way Forward.
Unauthorized Immigrants
How many unauthorized immigrants are in the United States?
The Migration Policy Institute (MPI) estimated 11.3 million unauthorized immigrants resided in the United States in 2016. About half of all unauthorized immigrants resided in three states: California (27 percent), Texas (14 percent), and New York (8 percent). The vast majority (82 percent) lived in 174 counties with 10,000 or more unauthorized immigrants each, of which the top five—Los Angeles County, CA; Harris County, TX; Cook County, IL; Orange County, CA; and Queens County, NY—accounted for 20 percent of all unauthorized immigrants.
- Read A Profile of the Unauthorized Immigrant Population in the United States for an overview of the characteristics of this population.
- Visit the Data Hub’s Unauthorized Immigrant Population Profiles for detailed sociodemographic information for the United States, 41 states and the District of Columbia, and 135 counties.
Note: MPI is among a small number of organizations that generate estimates of the unauthorized population because the Census Bureau does not. It is important to acknowledge that the estimates issued by MPI and others (including the DHS Office of Immigration Statistics, Pew Research Center, and Center for Migration Studies of New York) are based on different methodologies and data sources. Hence the estimates are not fully comparable.
Where are unauthorized immigrants from?
Mexicans and Central Americans are estimated to account for roughly two-thirds (67 percent or 7.6 million) of the unauthorized immigrants in the United States as of 2012-16, MPI estimates. About 1.8 million (16 percent) were from Asia; 685,000 (6 percent) from South America; 579,000 (5 percent) from Europe, Canada, or Oceania; 351,000 (3 percent) from the Caribbean; and 318,000 (3 percent) from Africa.
The top five countries of birth for unauthorized immigrants were Mexico (53 percent), El Salvador (6 percent), Guatemala (5 percent), and China and Honduras (3 percent each).
- This interactive map, Unauthorized Immigrant Populations by Country and Region, Top States and Counties of Residence, 2012-16, displays top U.S. concentrations by country or region of origin.
How many unauthorized immigrants live with children under age 18?
As of 2012-16, about 4 million unauthorized immigrants (37 percent of the overall unauthorized population ages 15 and older) lived with one or more children under age 18, MPI estimates. Of this group, about 82 percent (3.3 million) resided with at least one U.S.-citizen child under age 18, and 17 percent (697,000) lived with only non-U.S.-citizen children.
How many children under age 18 live with at least one unauthorized immigrant parent?
Approximately 5.1 million children under age 18 lived with an unauthorized immigrant parent during the 2012-16 period, representing 7 percent of the U.S. child population. About 80 percent (4.1 million) of these children were U.S. citizens, another 16 percent (809,000) were themselves unauthorized, and 3 percent (167,000) were legally present, including LPRs and those with temporary visas.
How many people were eligible for the Deferred Action for Childhood Arrivals (DACA) program and how many applications have been received since its launch in 2012?
The DACA program, announced on June 15, 2012, offered a two-year grant of deportation relief and work authorization to eligible young unauthorized immigrants. Requirements for eligibility included:
- being at least 15 years old;
- having entered the United States before the age of 16;
- having continuously resided in the United States since June 15, 2007;
- being enrolled in school, having earned a high school diploma or its equivalent, or being an honorably discharged veteran; and
- having not been convicted of a felony, significant misdemeanor, or three or more misdemeanors; or otherwise posing a threat to public safety or national security.
On September 5, 2017, the Trump administration announced the termination of DACA, with a six-month wind-down. Multiple court challenges over the decision led to preliminary injunctions that allowed DACA recipients to renew their protections starting January 2018, but only for people who currently have or in the past have had DACA benefits.
Based on USCIS data going back to August 15, 2012, when the government began accepting applications, a total of 825,439 were approved, suggesting this is the maximum number of people who have ever held DACA status at one point or another during the life of the program. The agency granted 91 percent of the initial applications, which numbered 910,382; 9 percent (81,768) were denied.
The top states of residence for accepted initial applications since the program’s inception are California (28 percent), Texas (16 percent), Illinois and New York (5 percent each), and Florida (4 percent each). The top countries of origin are Mexico (78 percent), El Salvador (4 percent), Guatemala (3 percent), and Honduras (2 percent).
- USCIS data on DACA applications and approvals.
How many people still have DACA status?
MPI estimates that as of 2019 approximately 1.3 million people met all criteria to apply under the original DACA program. As of September 30, 2019, approximately 652,880 individuals had active DACA status, according to USCIS.
The top states of residence for DACA active participants were California (29 percent), Texas (17 percent), Illinois (5 percent), followed by New York, Florida, Arizona, and North Carolina (about 4 percent each).
The top countries of origin of active DACA program participants were Mexico (80 percent), El Salvador (4 percent), Guatemala (3 percent), Honduras (2 percent), and Peru, South Korea, Brazil, and Ecuador (about 1 percent each).
- View MPI estimates of DACA program participation numbers and the immediately eligible at national and state levels, as well as for top countries of origin.
How many people are covered by Temporary Protected Status?
Since the enactment of the Immigration Act of 1990, the United States has occasionally granted a form of humanitarian relief called Temporary Protected Status (TPS) when the home countries of foreign nationals in the United States experience natural disasters, armed conflicts, or other circumstances making return unsafe. TPS offers work authorization and protection from deportation for six- to 18-month periods. The first country to be designated for TPS was El Salvador in 1990, to protect Salvadorans who had fled the country’s civil war.
Since 1990, 22 countries have been designated for TPS. Ten countries currently are designated: El Salvador, Haiti, Honduras, Nepal, Nicaragua, Somalia, South Sudan, Sudan, Syria, and Yemen. As of November 2018, an estimated 417,000 people from these ten countries had TPS, with the largest groups being Salvadorans (252,000), Hondurans (81,000), and Haitians (56,000).
The Trump administration has announced that it will not extend TPS for immigrants from El Salvador, Haiti, Honduras, Nepal, Nicaragua, and Sudan when those designations expire. As a result, 97 percent of grantees could lose permission to work and protection from deportation. However, there have been several legal challenges, including one that resulted in a preliminary injunction barring termination of the El Salvador, Haiti, Nicaragua, and Sudan designations. The nationals of these four countries will receive automatic extension of TPS and work permits for as long as the injunction is in place. Additional court cases have ensued, and TPS protections have been extended through January 4, 2021 for all six countries originally set for termination.
- Read more about the TPS program in this Source feature article.
How many unaccompanied children and families have been apprehended at the U.S.-Mexico border?
Apprehensions at the Southwest border grew significantly in FY 2019, mostly due to the increase in families seeking asylum. The U.S. Border Patrol apprehended more than 474,000 minor children and adults travelling as families (known as “family units” in Border Patrol parlance) and about 76,000 unaccompanied children along the Southwest border during FY 2019. These are the highest numbers of apprehensions recorded since record-keeping began in 2008 for unaccompanied children and in 2012 for family units, and represent a significant uptick over the 107,200 family units and 50,000 unaccompanied children apprehended in all of FY 2018. However, while apprehensions of family units reached a peak of 84,000 in May 2019, they dropped to 16,000 in September. These children and families are primarily from Guatemala and Honduras.
Note: The term “family unit” refers to individuals—either a child under 18 years old, parent, or legal guardian—apprehended with a family member by the U.S. Border Patrol.
- View the most up-to-date DHS data on apprehensions of unaccompanied children and family units in FY 2020.
- View more DHS data on FY 2019 apprehensions.
Immigration Enforcement
Note: The government fiscal year runs from October 1 to September 30. All figures for immigration control and enforcement given here are for the fiscal year. The data presented here are the most recent offered by U.S. Customs and Border Protection (CBP) and U.S. Immigration and Customs Enforcement (ICE).
How many apprehensions of unauthorized immigrants occur at the border annually?
CBP reported 859,501 apprehensions at both southern and northern borders in 2019, a significant increase from 404,142 in 2018, and the highest number since 2007, when there were 876,704. Ninety-nine percent of apprehensions in 2019 occurred along the Southwest border.
Note: Apprehensions are events, not individuals. In other words, the same individual can be apprehended more than once, with each apprehension counted separately.
How many people are arrested by ICE within the United States yearly?
ICE made 143,099 administrative arrests in 2019, down 10 percent from a year earlier and less than half the number recorded at the peak in 2010 and 2011. An administrative arrest is the arrest of an individual for a civil violation of U.S. immigration law, which is subsequently adjudicated by an immigration judge or through other administrative processes.
How many people are deported per year?
Removals and returns, which are conducted both by ICE and CBP, result in the confirmed movement of inadmissible or deportable aliens out of the United States. CBP carried out 190,285 removals and returns in 2018, up 17 percent from 162,682 in 2017. CBP’s most recent public data on removals and returns are for 2018. During that fiscal year, ICE carried out 256,085 removals and returns, an increase of 13 percent from 2017. ICE offers more recent data than CBP on returns, and for 2019 effectuated 267,258 removals and returns, a 4 percent increase from 2018.
- For more information, see FY 2019 ICE Enforcement and Removal Operations Report.
Naturalization Trends
How many immigrants are naturalized citizens?
In 2018, 22.6 million immigrants were naturalized U.S. citizens, accounting for approximately 51 percent of the total foreign-born population (44.7 million) and 7 percent of the U.S. population (327.2 million), according to ACS estimates.
Of the 22.6 million naturalized citizens, 30 percent were naturalized between 2010 and 2018, 29 percent between 2000 and 2009, and 41 percent prior to 2000.
- Use this Naturalization in the United States, 1910-Present tool to learn more about naturalization population over time.
How many immigrants become U.S. citizens annually?
USCIS naturalized nearly 762,000 green-card holders in 2018. The total number of immigrants receiving U.S. citizenship increased by 8 percent from 707,000 in 2017. The number of petitions for naturalization filed in 2018 (810,548) fell by 18 percent from 2017 (987,000 petitions). At the same time, the number of denied petitions increased by 12 percent from 83,000 in 2017 to 93,000 in 2018. It takes longer for USCIS to process naturalization applications than a few years ago, with the number of months of average processing time almost doubling from 5.6 to 10.3 months between 2016 and 2018.
From a historical perspective, naturalizations have increased dramatically in recent decades. On average, fewer than 120,000 LPRs became citizens each year between 1950 and 1969, 210,000 in the 1980s, 500,000 in the 1990s, and 680,000 during the 2000s. Naturalizations reached an all-time high in 2008, increasing 59 percent from 660,000 in 2007 to 1,047,000 in 2008. This came as a result of impending application fee increases and the promotion of U.S. citizenship in advance of the 2008 presidential elections. Between 2010 and 2018, the average annual number of naturalizations was about 717,000.
- For more historical data on naturalization, see Naturalization in the United States, 1910-Present data visualization tool.
- For more information, see the Source article Naturalization Trends in the United States.
- For more information on USCIS processing times, see Historical National Average Processing Time for All USCIS Offices.
How many foreign nationals become U.S. citizens through military naturalization?
In 2018, 4,500 foreign-born military personnel naturalized as U.S. citizens—a 35 percent drop from 2017 (6,900) and the lowest since 2009. Since 2002, when President Bush designated the post-9/11 period as a period of hostilities and the U.S. military made it easier for some noncitizens join the service and naturalize faster, 102,100 foreign-born persons became U.S. citizens via military naturalization.
- For more information on the foreign born in the U.S. military, see Noncitizens in the U.S. Military: Navigating National Security Concerns and Recruitment Needs.
Where are newly naturalized citizens from?
Of the new U.S. citizens, 17 percent were born in Mexico, 7 percent in India, and 5 percent each in China and the Philippines (see Table 6). Immigrants from these four countries, together with those from Cuba, the Dominican Republic, Vietnam, Colombia, El Salvador, and Jamaica, comprised the top ten countries of birth for newly naturalized citizens in 2018. These countries accounted for 51 percent of the 762,000 new U.S. citizens that fiscal year.
Table 6. Top Ten Countries of Origin of Newly Naturalized Citizens, FY 2018
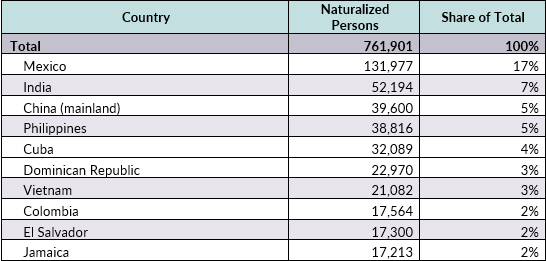
Source: DHS Office of Immigration Statistics, Yearbook of Immigration Statistics 2018.
Where do newly naturalized citizens live in the United States?
In 2018, 58 percent of the newly naturalized lived in one of five states. California had the largest number of new Americans, with 21 percent (163,000), followed by 13 percent in Florida (96,000), 11 percent in New York (81,000), 8 percent in Texas (65,000), and 5 percent in New Jersey (40,000)
The top five metropolitan areas with the largest number of naturalizations were New York-Newark-Jersey City (107,000), Los Angeles-Long Beach-Anaheim (62,000), Miami-Ft Lauderdale-Pompano Beach (58,000), Chicago-Naperville-Elgin (25,000), and Houston-The Woodlands-Sugar Land (23,000). These five metropolitan areas accounted for 36 percent of all naturalizations in FY 2018.
How many green-card holders are eligible to naturalize?
According to the latest available DHS estimates, about 9 million of the 13.2 million green-card holders residing in the United States on January 1, 2015 were eligible to naturalize.
- For more information, see Estimates of the Lawful Permanent Resident Population.
How long does it take on average for green-card holders to naturalize?
On average, immigrants held green cards for eight years before becoming U.S. citizens in 2018, unchanged from 2017. The time varied by country of origin: African-born immigrants spent an average six years in LPR status before naturalization, followed by those born in Asia (seven years), South America (eight years), Europe (nine years), Oceania (ten years), and North America (including Central America, 11 years).
In general, naturalization requires being at least 18 years of age, passing English and civic exams, and for most, residing in the United States with LPR status continuously for at least five years (three years for those married to a U.S. citizen).
- For more information, see DHS Annual Flow Report.
- Read the USCIS Naturalization Eligibility Requirements.
Visa Backlogs
How many visa applications for permanent immigration (green cards) are backlogged?
Because of limits on certain visa categories and per-country caps, the U.S. government in some cases is still processing applications that are two decades old or older. In February 2020, the State Department was processing some family-sponsored visa applications dating to March 1996, and employment-related visa applications from May 2008.
According to data on the petitions submitted to the State Department, there were about 3.6 million applicants (including spouses and minor children) who were on the waiting list as of November 1, 2019, the second time the backlog dropped in recent years (versus 3.8 million in 2018 and 3.9 million in 2017).
The overwhelming majority of backlogs were family-sponsored applicants (3.5 million, which includes the principal applicant and his or her immediate family members). About 126,000 were employment-sponsored applicants and their families.
Of the overall 3.8 million applicants, 1.2 million were citizens of Mexico, followed by those from the Philippines (291,000), India (284,000), mainland China (216,000), and Vietnam (210,000). Family- and employment-based prospective immigrants who are waiting to adjust their status to lawful permanent residence from within the United States are not included in the State Department estimate.
USCIS also publishes backlog statistics but only for petitions approved in one of the five employment-based categories. The most recent USCIS data show that close to 395,000 approved employment-based immigrant petitions were awaiting a priority date based on the May 2018 State Department Visa Bulletin. The figure corresponds to the number of primary applicants covered by these petitions but excludes their dependents. To MPI’s knowledge, USCIS did not publish backlog statistics on other types of green-card applications the agency adjudicates.
In other words, the overall number of people waiting for a green card—within and outside of the United States—is likely to be larger than the 3.6 million reported by the State Department (as of November 2019) and 395,000 reported by USCIS (as of May 2018).
- For more details about wait times by immigration category and country of origin, see the State Department Visa Bulletin.
- For more on capped employment- and family-based preference categories, see Explainer: How the U.S. Legal Immigration System Works.
- Read Going to the Back of the Line: A Primer on Lines, Visa Categories, and Wait Times for more on the green-card backlog.
- Read the National Visa Center annual report on immigrant visa applicants and view USCIS employment-based immigrant petition backlog data.